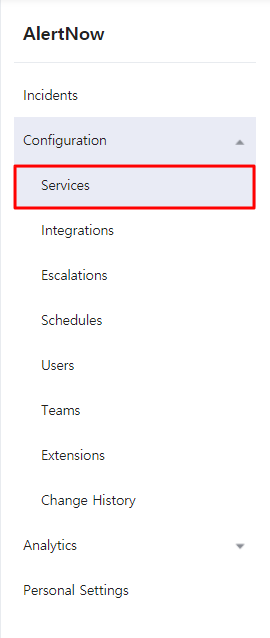
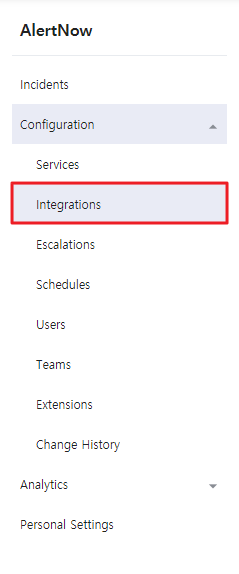
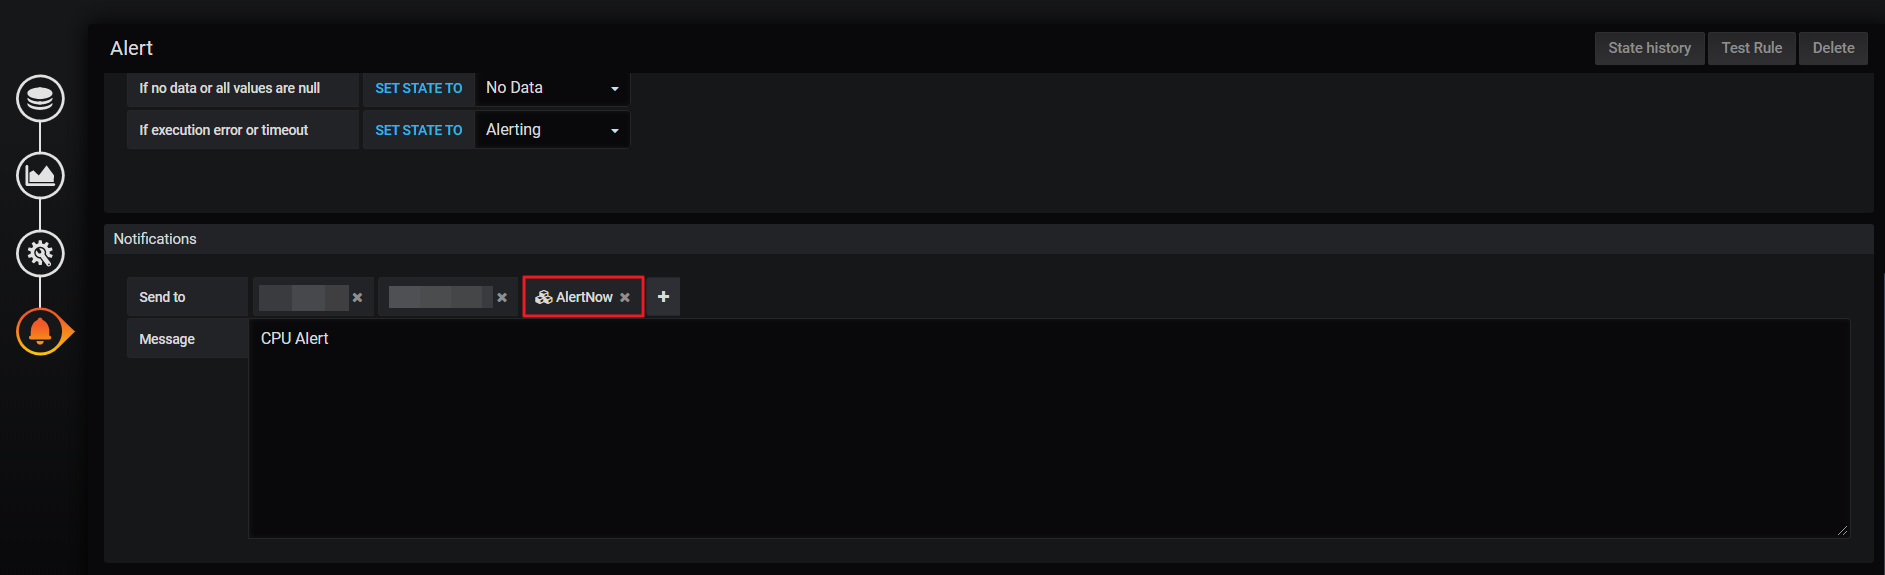
AlertNow
AlertNow is an incident management platform that provides alert monitoring, escalation policies, and on-call scheduling to quickly detect and resolve incidents.
Quick Start Guide
This guide shows how to configure basic settings in order to use AlertNow service.
Get started with these steps:
📑 Step 1: Set up Your User Profile
Set up your basic information and notification rules. Contact information, notification rules, user settings and additional information can be configured in Personal Settings.
For more information about setting up user profile, please refer to Personal Settings.
📑 Step 2: Set up Integrations
Set up the integration by selecting the tool or service you are using from the list of integrations provided by AlertNow. You can then add one or multiple integrations in order to receive alerts from those tools or services and manage them.
For more information about setting up integrations, please refer to Integrations.
📑 Step 3: Create a Service
Create a service to manage incidents that are created in the integration. Service is a unit for managing incidents and provides related information that easily allows users to view and access incidents, integrations, escalation rules, extension, maintenance history they need to manage incidents. So you can create and use a service to reflect your needs.
For more information about creating services, please refer to Services.
Introduction
What is AlertNow?
AlertNow is SaaS-based service incident lifecycle management platform that allows users to quickly detect and manage incidents that occurred by using alert monitoring, escalation policies, and on-call scheduling. The key features are as follows.
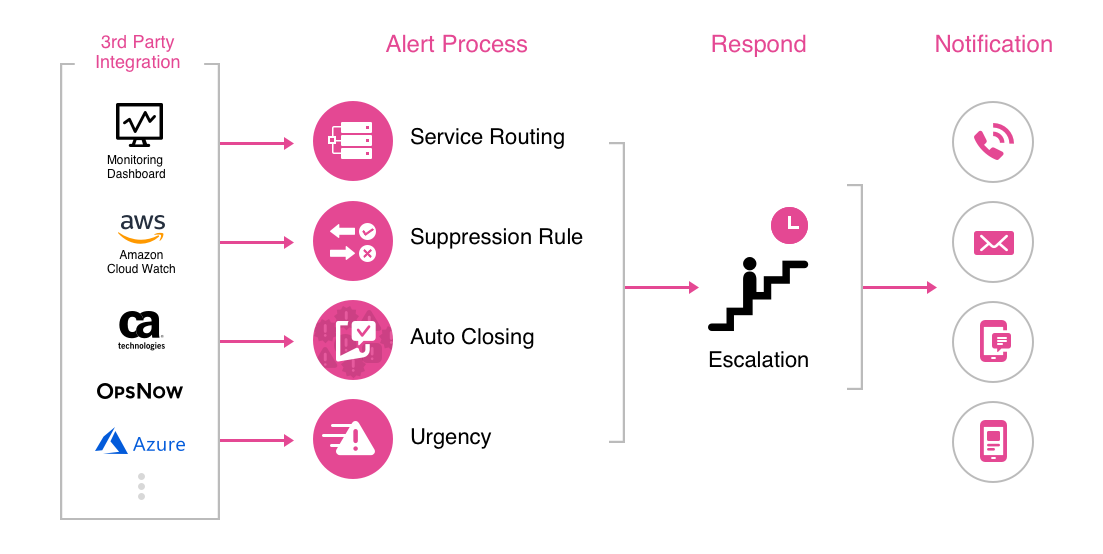
- Unified Incident Management
- Receive alert information occurred in multiple 3rd party monitoring tools.
- Remove unnecessary duplicated alerts based on customized rules and create incidents with necessary alerts.
- Effective Team Communication
- Send the alert when an incident occurred, to the person who can handle the incident at the right time.
- Quickly deliver the alert via channels (SMS, Voice Call, Slack, KakaoTalk, Jandi etc.) designated by the user.
- Incident Resolution Focused Escalation
- Set assignee, action and time to handle the incidents step-by-step.
- When an incident is not acknowledged or closed, it automatically escalates to the manager of the next step to handle the incident, which reduces MTTD (Mean-Time-To-Detect) and MTTR (Mean-Time-To-Restore).
AlertNow - Flow
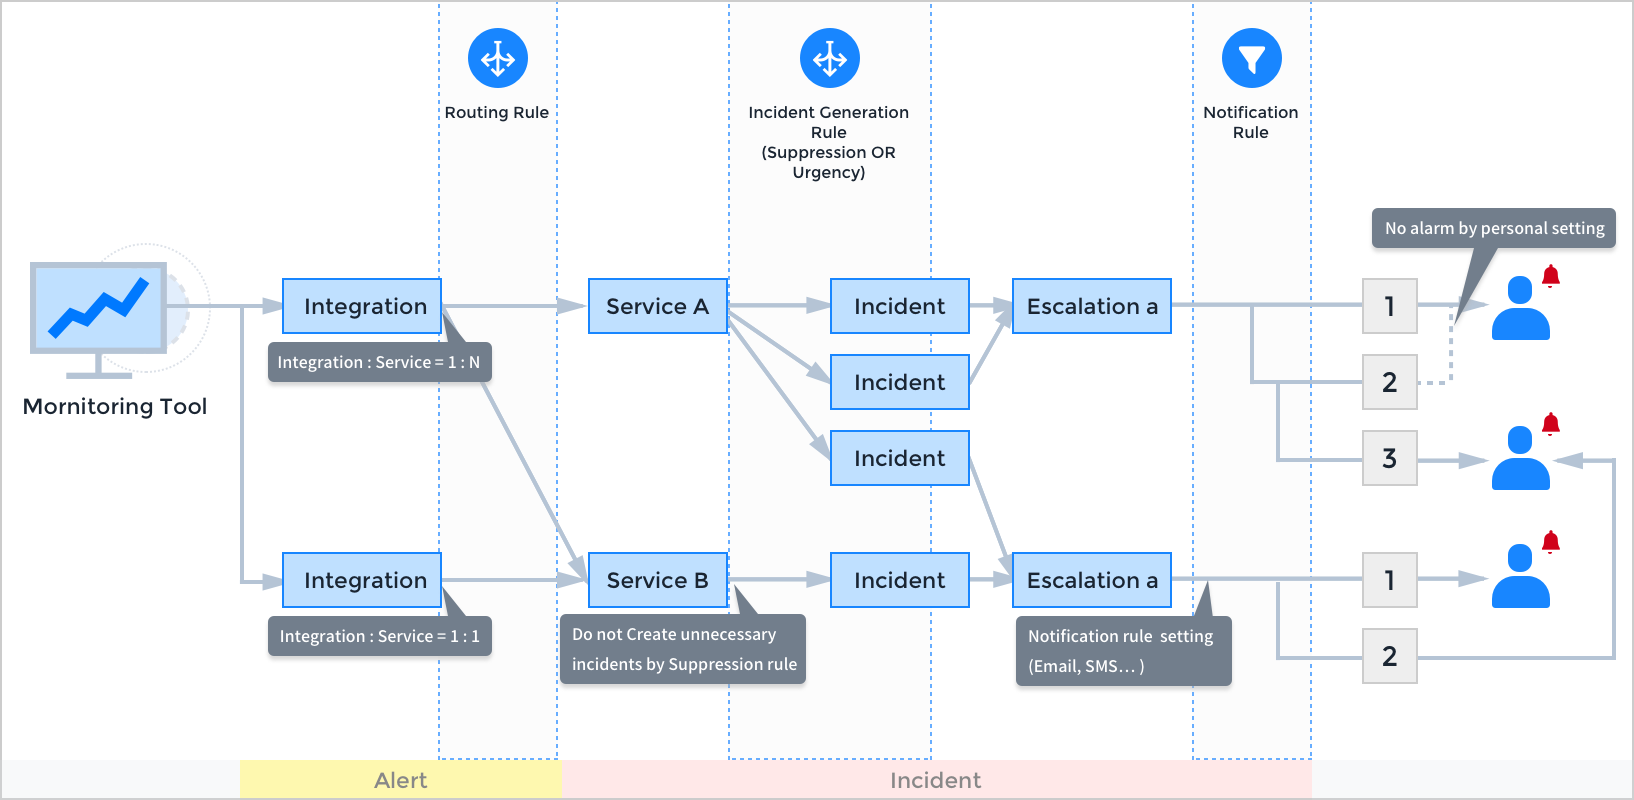
AlertNow - Setup Process
For Admin user, the setting steps are as follows:
Create Service → Create Integration → Create Schedule (Optional) → Create Escalation policy → Create Team (Optional) → Set Extension (Optional)
After completing the setting, alerts and incidents will be created according to information connected to integration. You can receive notifications about incidents created and status changed, and edit incidents accordingly.
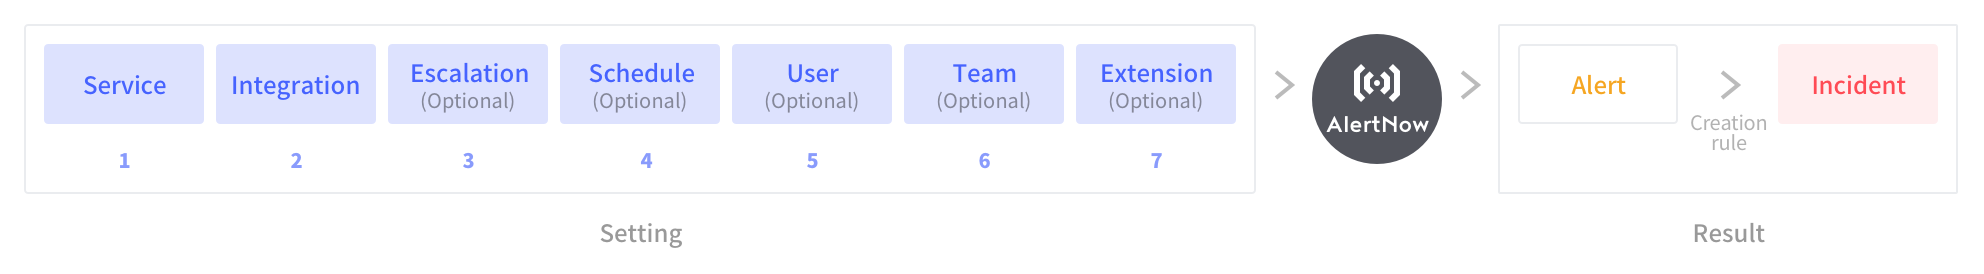
AlertNow Key Terms
- Personal Setting: Users can set personal information and notification rules.
- Alert: It is raw data and the user cannot change or delete the data.
- Service: It is a unit to manage incidents occurred from integrations, and can be services or applications that users actually use and can be used freely for user’s convenience.
- Escalation: Users can manage incidents by setting managers to handle step-by-step and action and time.
- Extension: Users can export specific data created in AlertNow via external tools or services.
- Incident: When collecting alerts, it manages the status of the ticket created by incident policy.
- Integration: It is an endpoint that connects notifications occurred in 3rd party monitoring tools to AlertNow.
- Team: Users can use this service for managing all the information related to incidents such as escalations, users and services in a group.
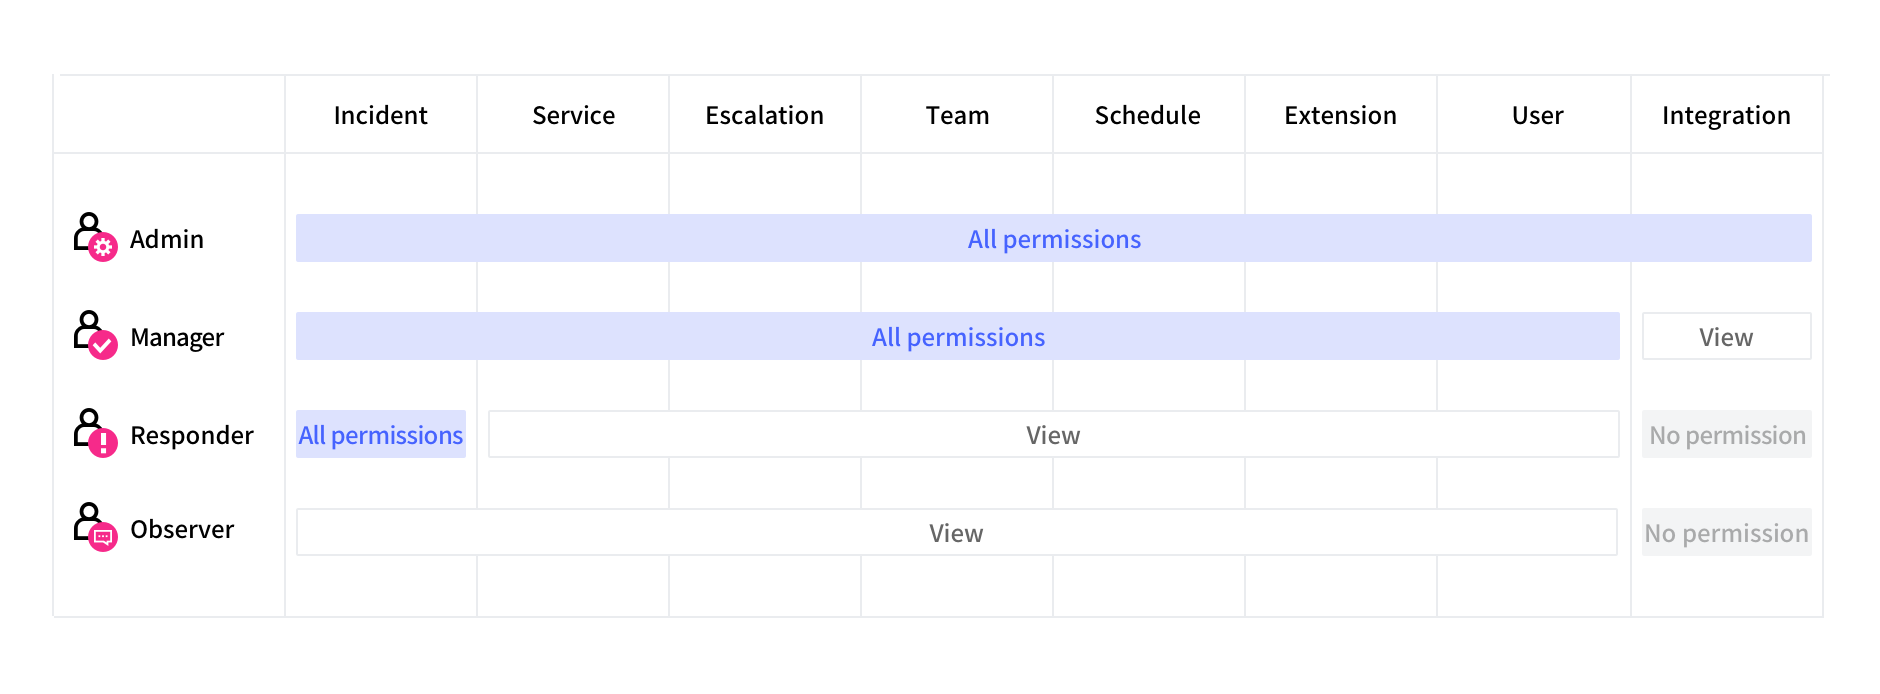
Permissions by Role
You can view permissions by roles in the table and diagram below.
Permissions – Table
| Role | Feature | Integrations | Schedules | Extensions | Teams | Incidents | Services | Escalations | Users |
|---|---|---|---|---|---|---|---|---|---|
| Admin | Create | √ | √ | √ | √ | √ | √ | √ | |
| Modify | √ | √ | √ | √ | √ | √ | √ | √ | |
| Delete | √ | √ | √ | √ | √ | √ | |||
| View | √ | √ | √ | √ | √ | √ | √ | √ | |
| Manager | Create | √ | √ | √ | √ | √ | √ | ||
| Modify | √ | √ | √ | √ | √ | √ | |||
| Delete | √ | √ | √ | √ | √ | ||||
| View | √ | √ | √ | √ | √ | √ | √ | √ | |
| Responder | Create | No permission | √ | ||||||
| Modify | √ | ||||||||
| Delete | |||||||||
| View | √ | √ | √ | √ | √ | √ | √ | ||
| Observer | Create | No permission | |||||||
| Modify | |||||||||
| Delete | |||||||||
| View | √ | √ | √ | √ | √ | √ | √ |
📜 Note: Delete feature is not supported in Incidents and Users.
Permissions – Diagram
AlertNow Role
AlertNow provides 4 user types for user management and service usage.
📜 Note: Team and Schedule features are only available on the Enterprise plan.
Admin
Admin has the permission to access and manage the entire AlertNow service. Also, only admin users can create integrations and set service routing.
- For Admin user, the setting steps are as follows:
Create Service → Create Integration → Create Schedule (Optional) → Create Escalation policy → Create Team (Optional) → Set Extension (Optional) - After completing the setting, alerts and incidents will be created according to information connected to integration. Admin will receive notifications about incidents created and status changed, and edit incidents accordingly.
Manager
Manager has the responsibility for the service, and has the permission to create, view, edit and delete. However, the manager can view only in Integrations and Users features.
- For Manager user, the setting steps are as follows: Create Service → Create Schedule (Optional) → Create Escalation policy → Create Team (Optional) → Set Extension (Optional)
- After completing the setting, alerts and incidents will be created according to information connected to integration. You can receive notifications about creating incidents and changing status, and edit incidents accordingly.
Responder
Responder is the main assignee who receives incident notifications and solves problems accordingly, and create and view permissions for Incidents and Alerts; and only view permissions for Services, Teams, Schedules, Extensions, Escalations, and Users. However, no permission for Integrations.
- For Responder user, it is impossible to create escalation policy, but can be set as a responder for an escalation.
- After completing the setting, alerts and incidents will be created according to information connected to integration. You can receive notifications about creating incidents and changing status, and edit incidents accordingly.
Observer
Observer can check the problem-solving status if necessary. Has no permission for Integration; and only has view permissions for Incidents, Services, Teams, Escalations, Schedules, Extensions, and Users.
- Observer cannot receive notifications for creating incidents and changing status because it cannot be assigned to escalation responders.
Using AlertNow
Using AlertNow Guide will allow you to get the full benefits of AlertNow.
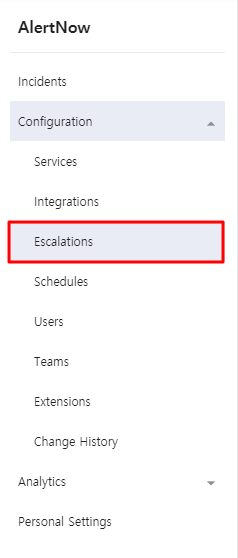
When configuring responders for incident notifications: Sending notifications
Click the [Escalations] menu.
![]()
Click the [Create escalation policy] button.
![]()
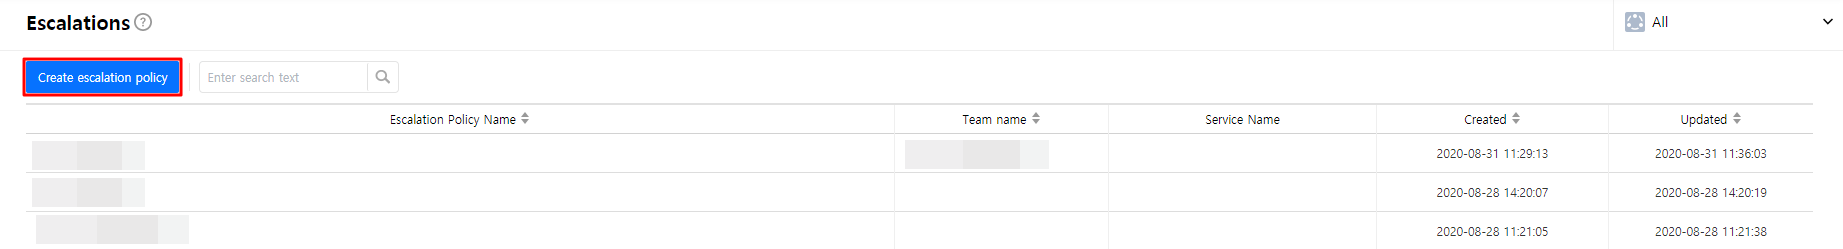
Configuring Responders
If you want to send notifications, you can configure the registered user as a responder to receive notifications step-by-step.
Enter a name and description for the escalation policy.
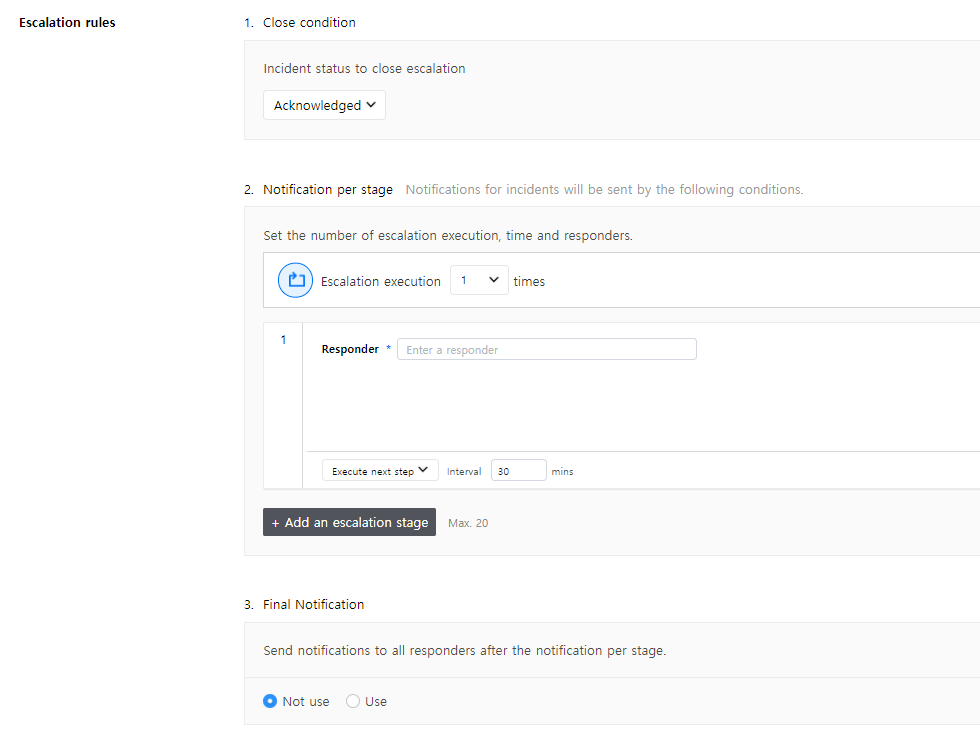
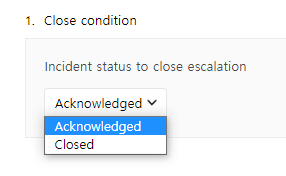
Set the incident status to close escalations, Acknowledged or Closed.
![]()
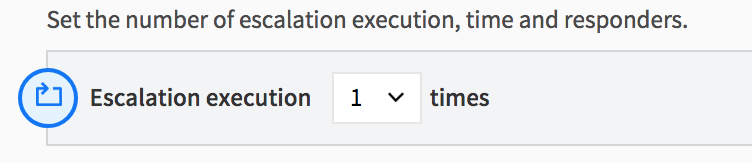
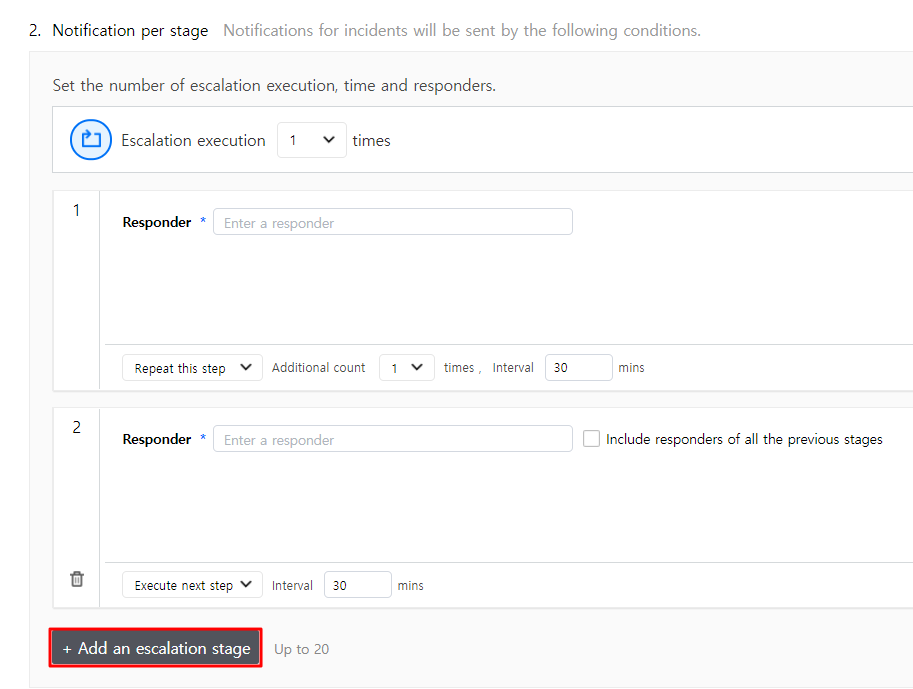
Set how many times the escalation repeats, and up to 10 can be set for repetition.
![]()
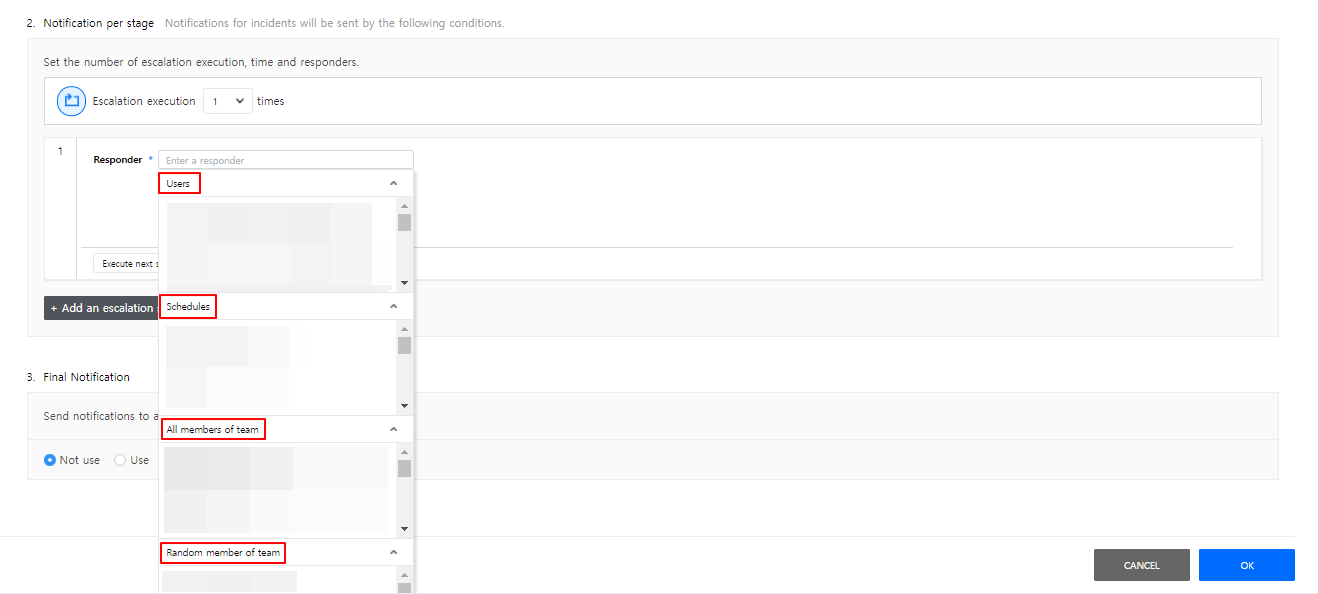
In a responder input field, enter names of responders. Responders can be set as Schedules, Users, All members of team, and/or Radom member of team, and multiple items can be selected.
![]()
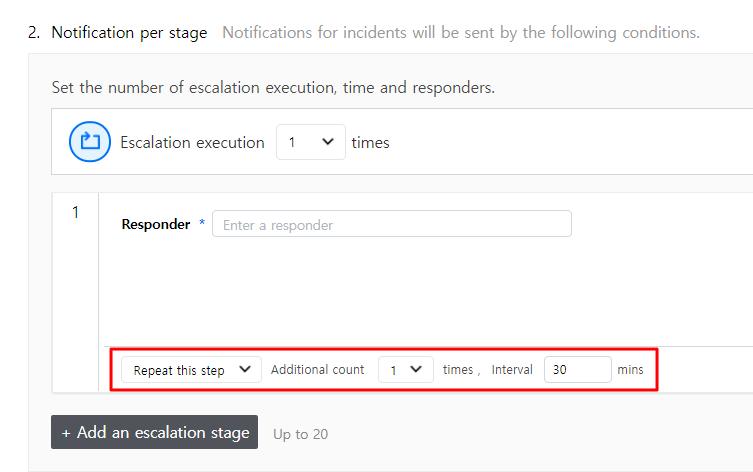
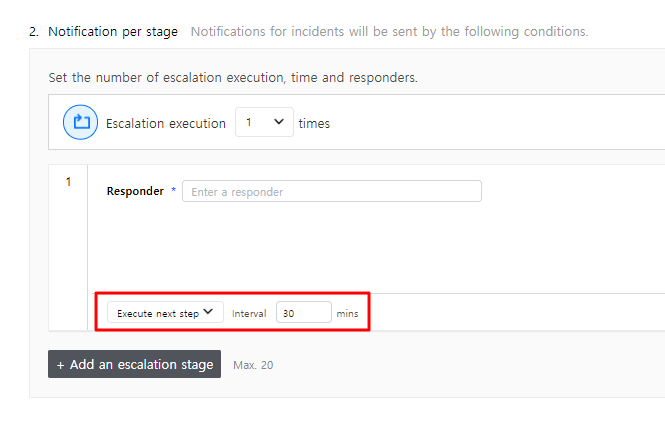
Click [Repeat this step] to repeat the same step before escalating it to the next step. You can also set a number of repeated counts and intervals.
![]()
As shown in the figure below, if the interval is set as 30 minutes and no one takes any actions against the alert, this step will be escalated to the next step.
![]()
Click [Add an escalation stage] to add an escalation step. A maximum of 20 steps can be added, and each escalation step can be repeated as well. When you select the [Include responders of all the previous stages] checkbox, you can send notifications to all responders of all the previous stages.
![]()
Configuring Final Notification
If no one acknowledges or closes the notification after the escalation process is done, it sends the final notification to inform responders once again.
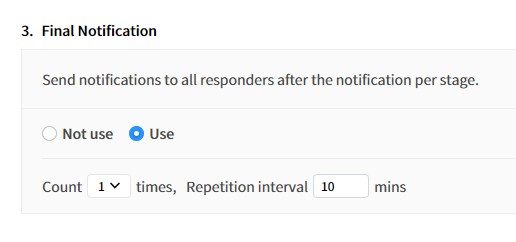
Select Use radio button to set the interval and count of final notification.
Click the [OK] button to create an escalation policy and send notifications.
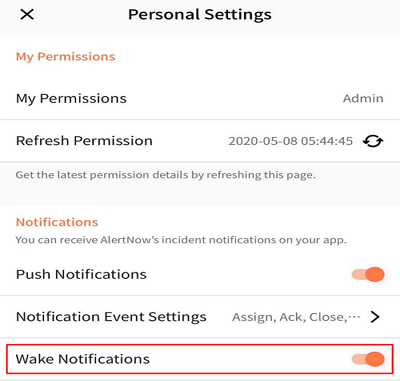
To receive notifications in various ways: Setting contacts
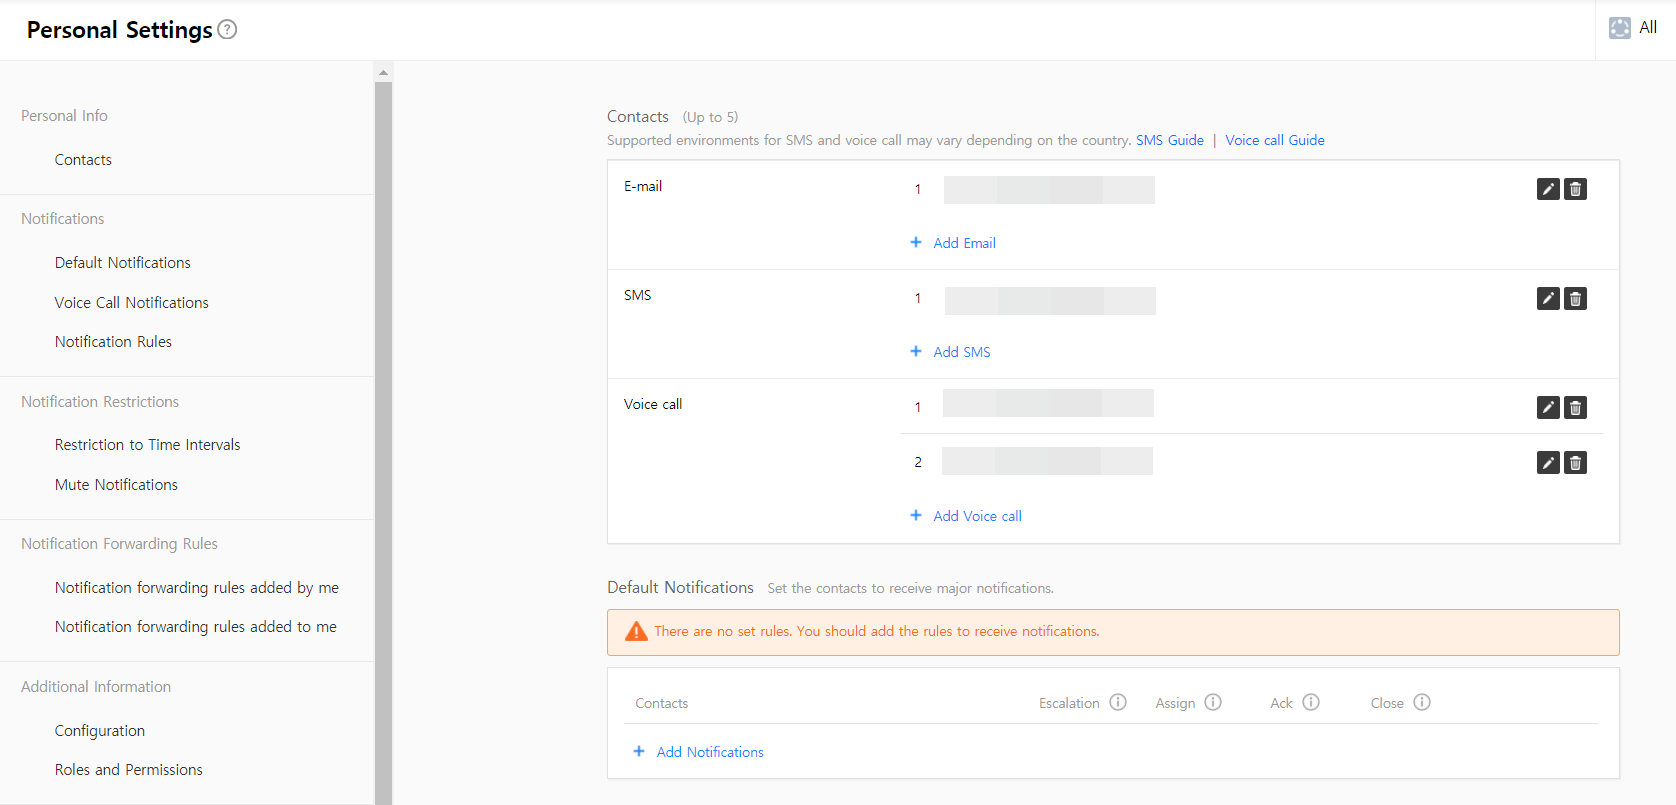
Registering Contacts
You can receive incident notifications via Email, SMS, WeChat, KakaoTalk, Telegram, Mobile app and Voice call.
Setting Contacts and Notifications
① Click the [Personal Settings] menu.
② The Personal Settings screen consists of the following.
💡 To find out more about the personal settings, please refer to Personal Settings.
Setting Additional Information
① You can set basic information, role, and permission in the Additional Information page.
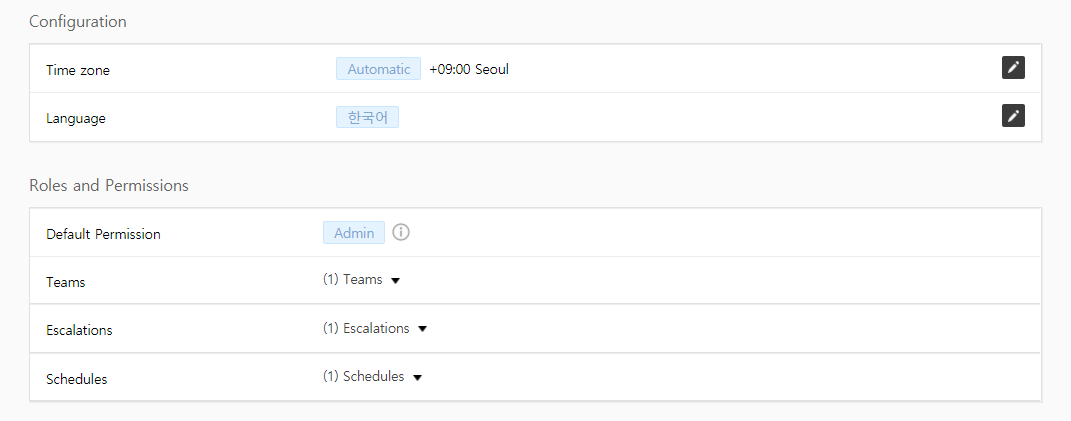
② Click the ![]() icon to set the time zone.
icon to set the time zone.
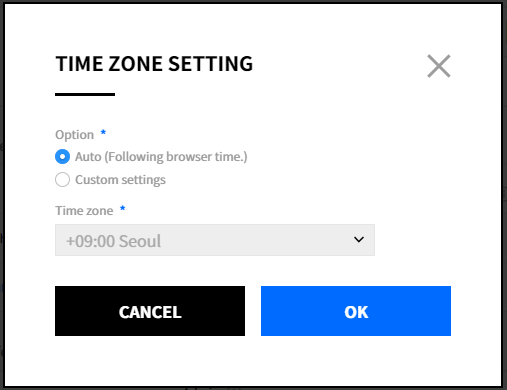
③ The time zone setting popup will be displayed as below. If you select Custom Settings radio button, you can change the time zone. Click the [OK] button to complete the setting.
④ Click the ![]() icon to set your language. Select a language you want to use and click the check button.
icon to set your language. Select a language you want to use and click the check button.

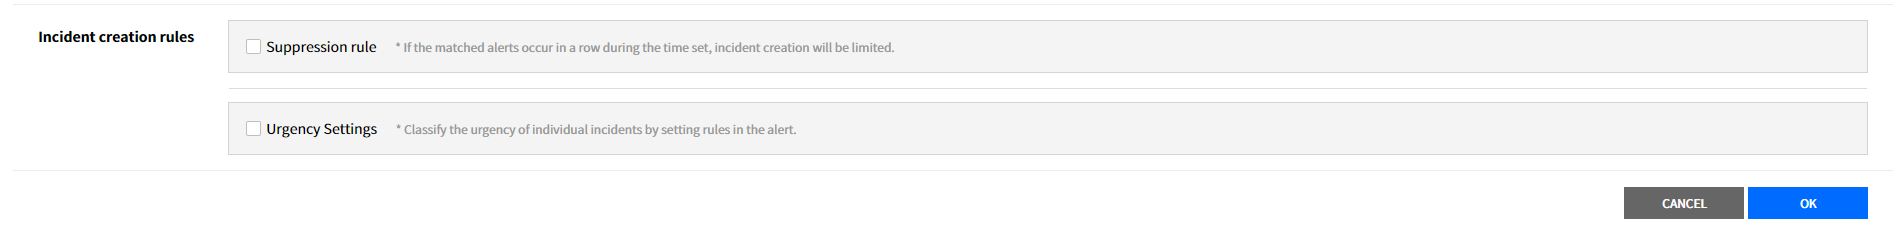
To Minimize Management Overheads: Setting Incident creation rules
When a problem occurs, you can manage incidents efficiently by limiting unnecessary alerts, and classifying it by incident urgency.
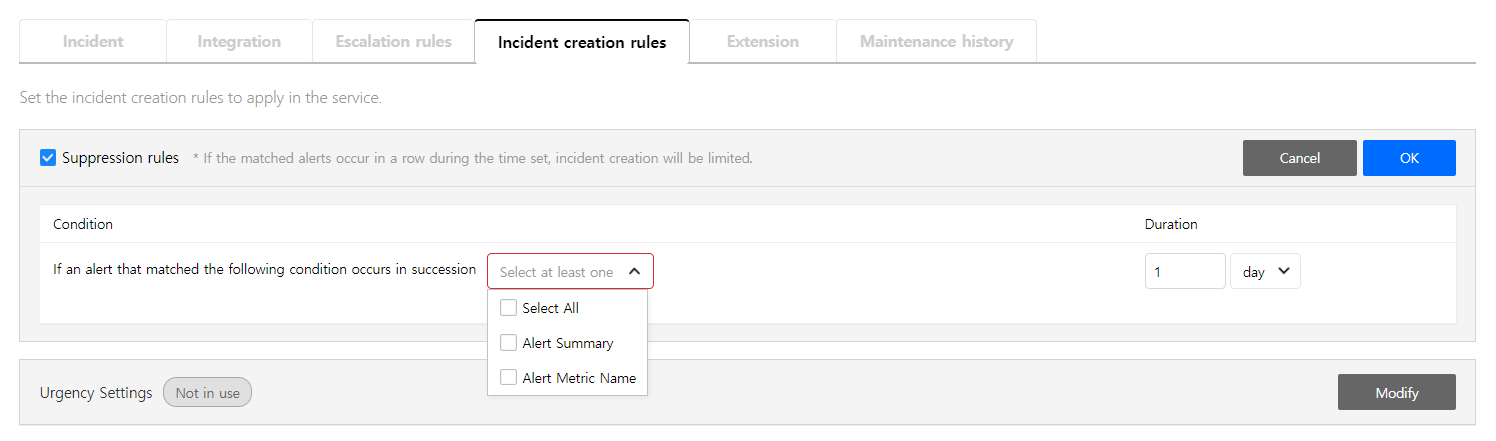
Setting Suppression Rules
The alerts will continue to occur until the problem is fixed. If the user creates an incident for alerts that were created for the first time, incidents will not be created for the same type of incidents.
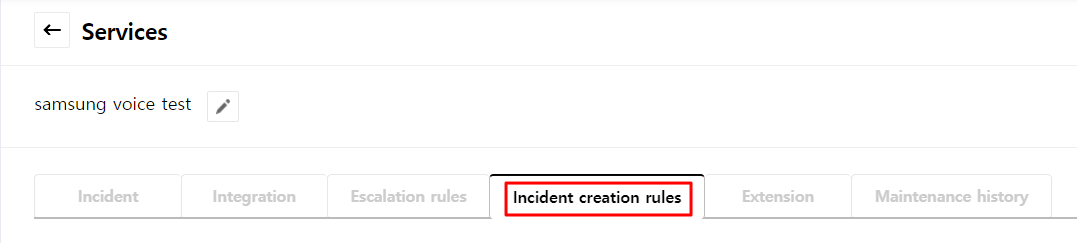
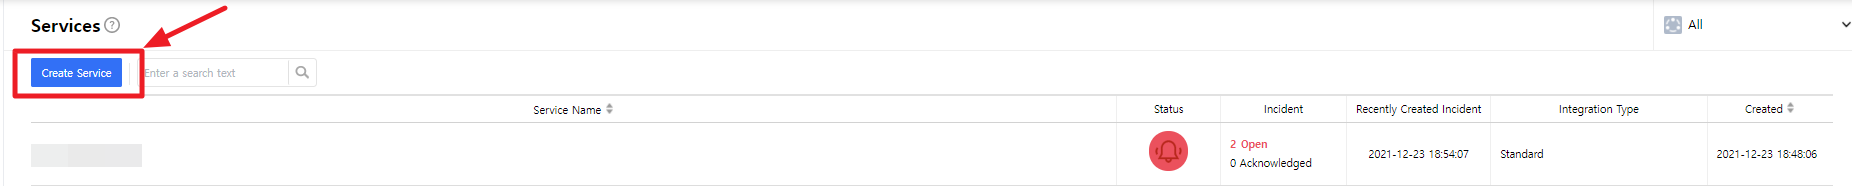
Click the [Services] menu.
![]()
Click one of the created services and click the [Incident Creation Rules] tab.
![]()
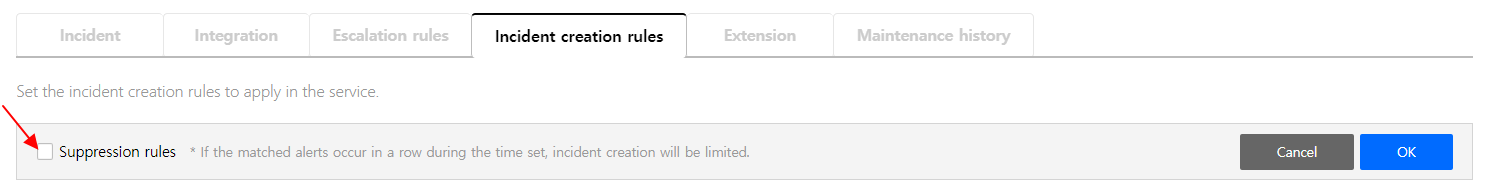
Click the [Modify] button of the suppression rules and click the checkbox at the left.
![]()
After selecting the condition and duration, click the [OK] button to create a rule. You can set the duration in seconds, minutes, hours, or days.
![]()
You can create only one rule at a time. You can deactivate the rule by clicking the [OK] button in the popup window after disabling the checkbox.
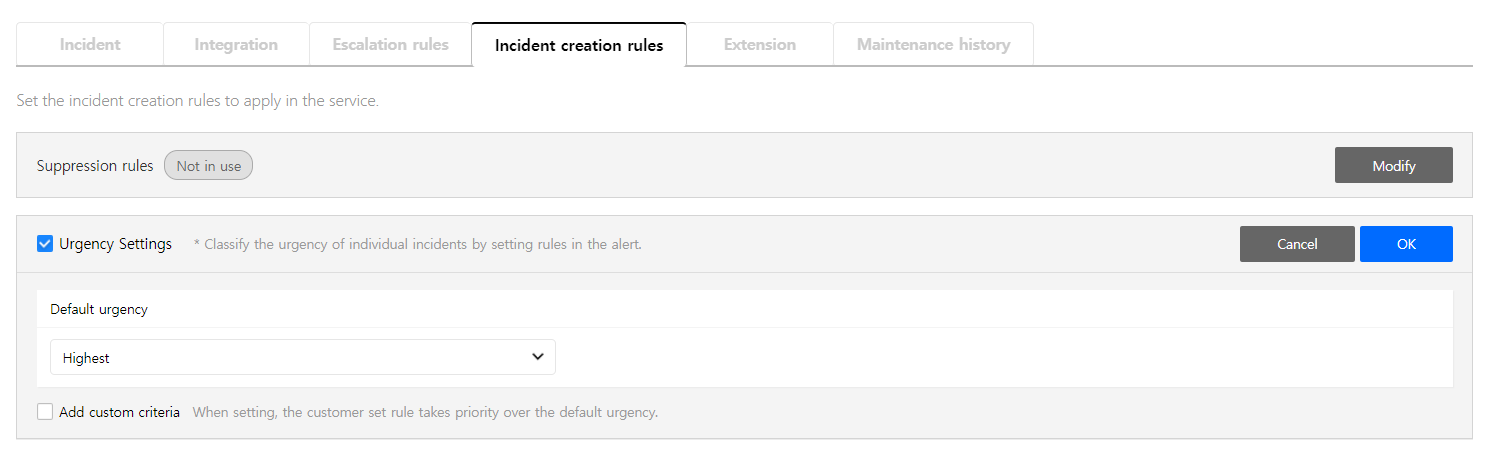
Setting Incident Urgency
You can set the urgency for an alert, and check it by classifying created incidents by incident urgency.
Click the [Services] menu.
![]()
Click one of the created services and click the [Incident Creation Rules] tab.
![]()
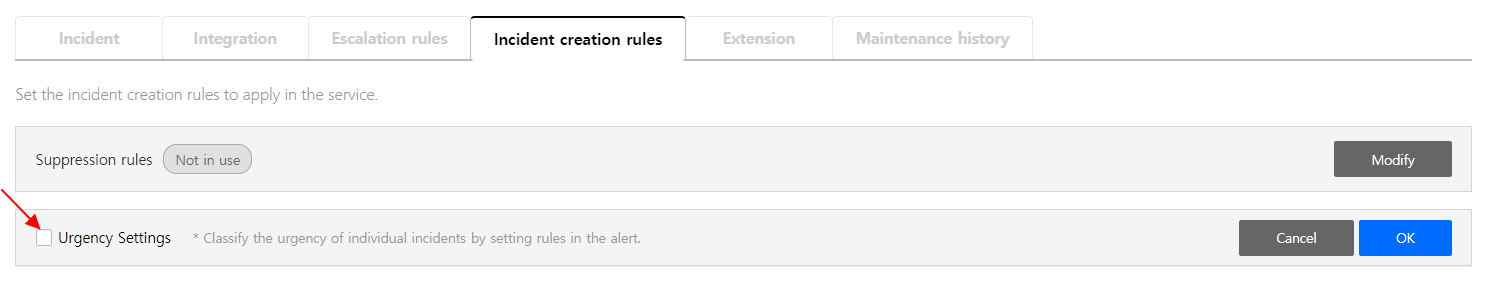
Click the [Modify] button of the urgency rules and click the checkbox at the left.
![]()
Select the default rule of incident urgency. You can select the urgency from Highest, High, Medium, Low or Lowest.
If you choose Add custom criteria checkbox, the custom rule will be applied over the default rule.
![]()
| Item | Description |
|---|---|
| Alert Summary | Refers to Title in an incident list. |
| Alert Metric Name | In an alert detail page, you will see the following when clicking View button. |
| It will also be displayed on the alert summary. | |
 |
Click the [OK] after selecting the condition, entering the comparison value, and setting the urgency. Then, the urgency rule will be added accordingly.
Click the [OK] button after disable the checkbox, then the rule will be deactivated.
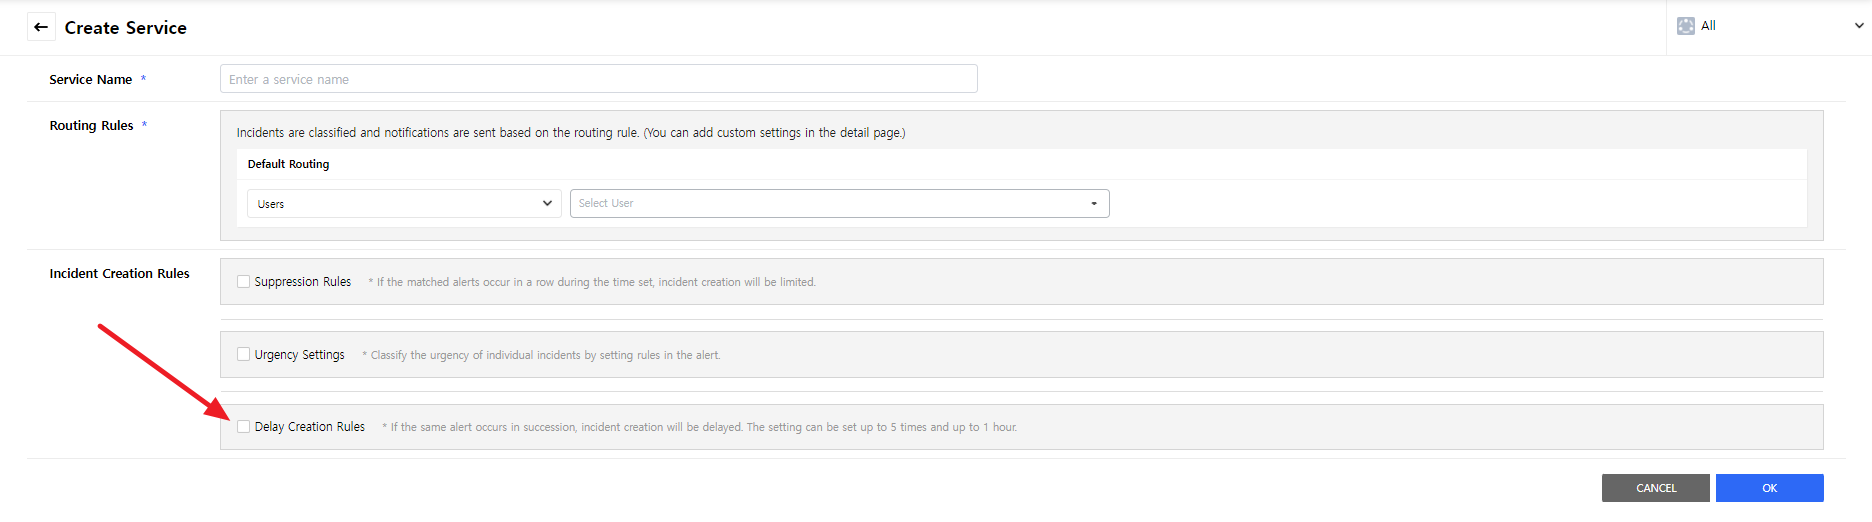
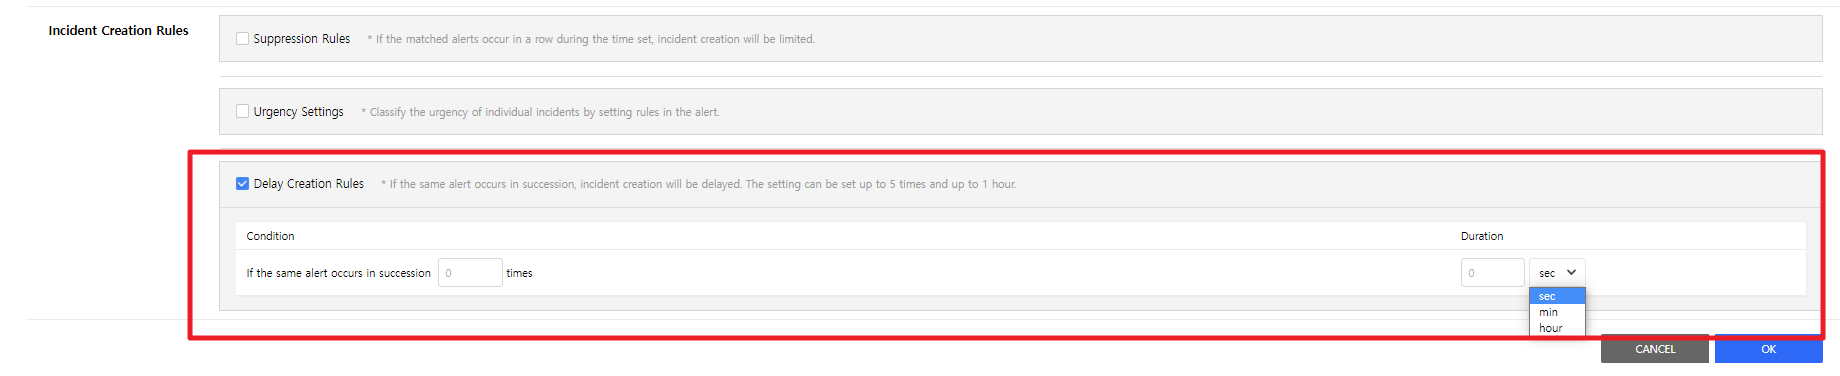
Delay Creation Rules
Users can delay creating incidents for a number of times and periods for the same incident occurred consecutively.
Go to detail page in Service menu by click the [Create Service] button.
![]()
In the detail page, choose [Delay Creation Rules].
![]()
Set a number of times and time periods to delay creating incidents.
![]()
📑 You can find delayed incidents in the Alerts list in the Incidents.
When registering a service to be notified: Adding a service
Service is a unit to manage incidents that occurred in integration and can be managed by routing rules set in an integration.
Service Configuration
Creating in Service Menu
Enter a service name
① Click the [Services] menu.
② Click button and enter a service name in the Create Service page.
Setting routing rules
You can receive notifications by classifying incidents based on routing rules.
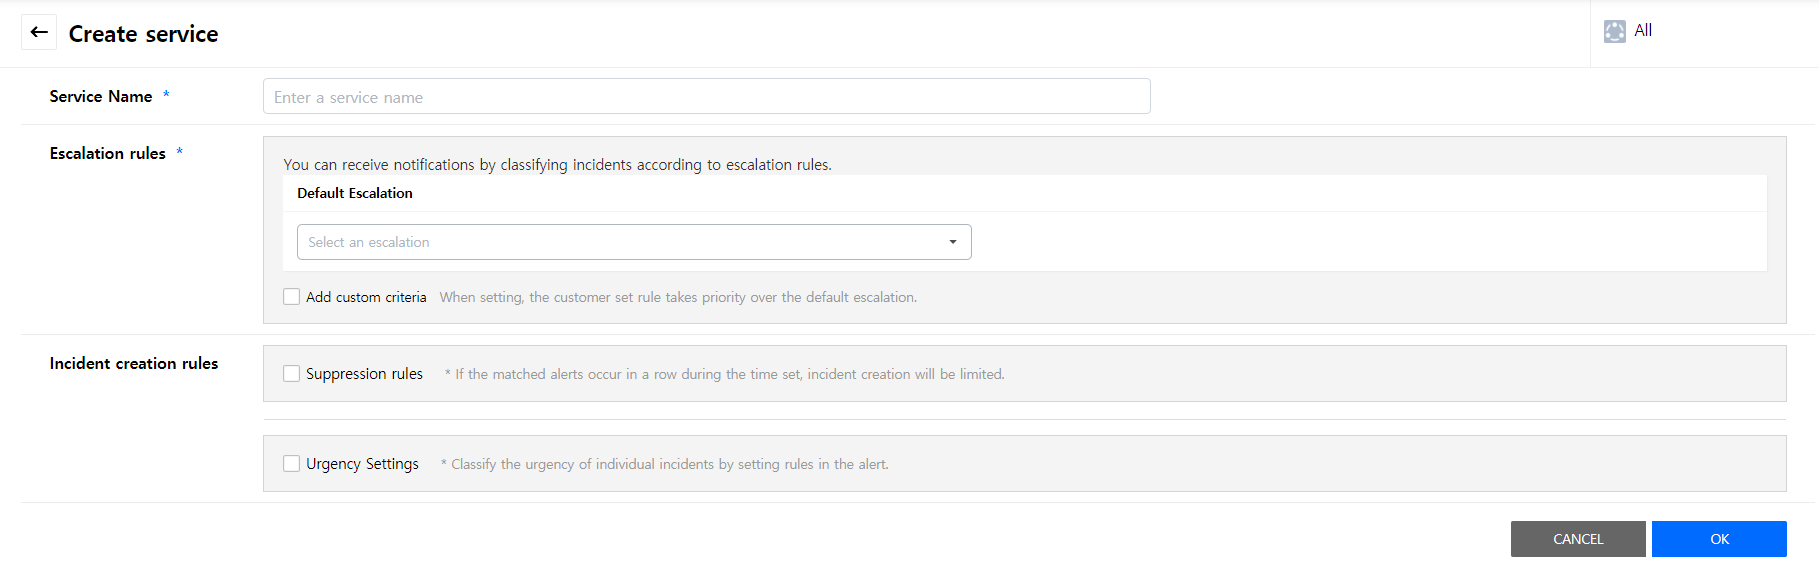
① Set the routing rule in the Create service page.
② Select the created escalation from the Escalations menu in the Routing Rule.
③ If you click the [Add custom criteria] checkbox, the custom rule will be applied over the default rule.
④ Select the escalation rule after entering the condition and comparison value.
⑤ Set the incident creation rules (Suppression Rule and Urgency Rule). Refer to the To minimize management overheads: Setting Incident creation rules for setting the creating rule.
⑥ Click the [OK] button to create a service. The created service will be displayed as below.
| Item | Description |
|---|---|
| Incident | You can check the Incident status by period and search condition. |
| Integration | You can check the integration information of the service. |
| Escalation Rules | You can check the escalation information of the service. |
| Incident Creation Rules | You can check the incident creation rule of the service. |
| Extension | You can check the extension information of the service. |
| Maintenance History | You can check the history of adding and deleting maintenance schedules of the service. |
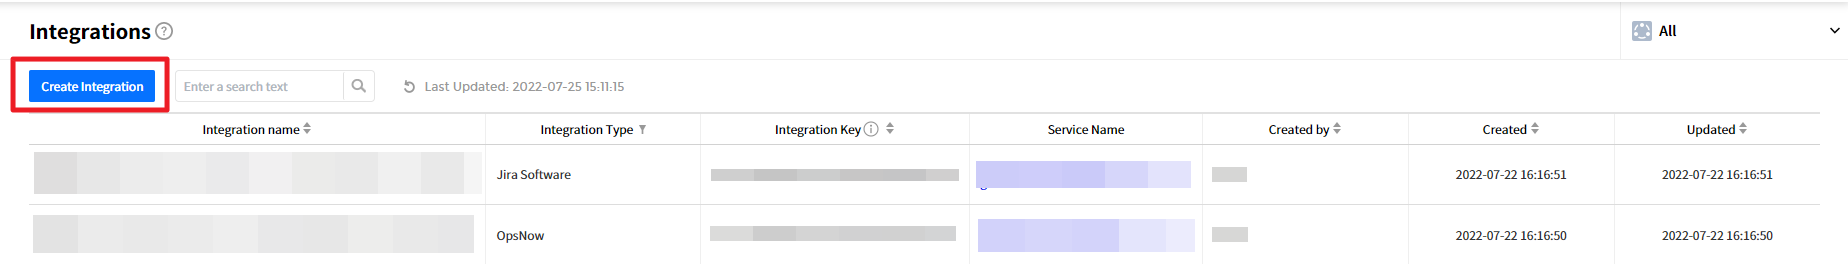
When syncing with 3rd party monitoring services: Adding an integration
This chapter explains how to create Integrations.
Creating an integration
Click the [Integrations] menu.
![]()
Click button.
![]()
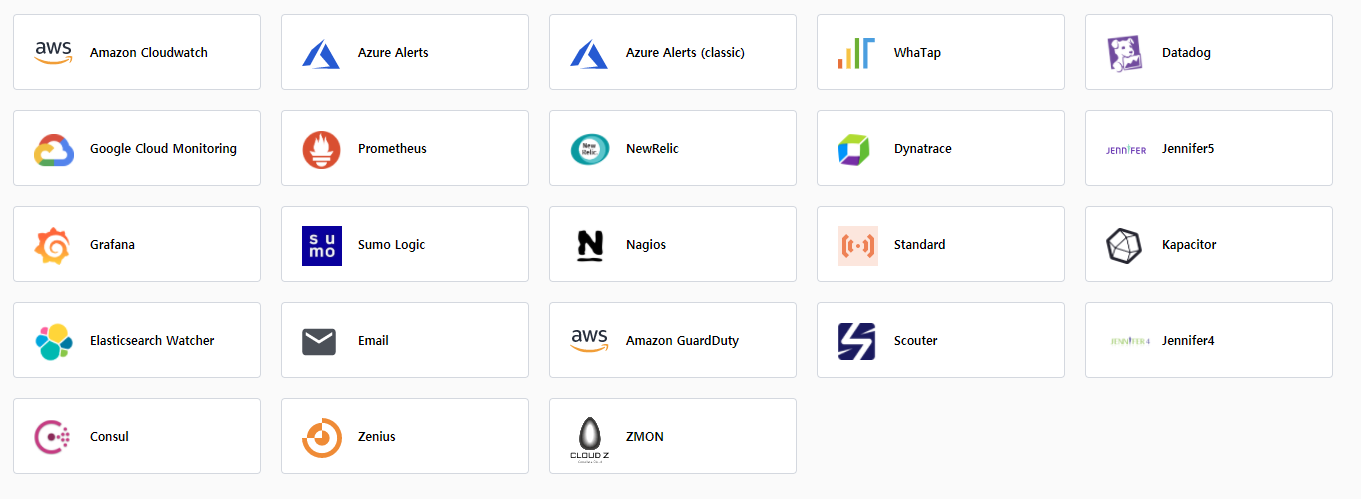
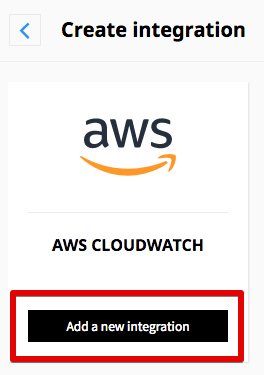
Select the integration type to create an integration. For example, if you are using AWS CloudWatch for monitoring, click the [AWS CloudWatch] card.
![]()
Create integration page will be displayed as below.
![]()
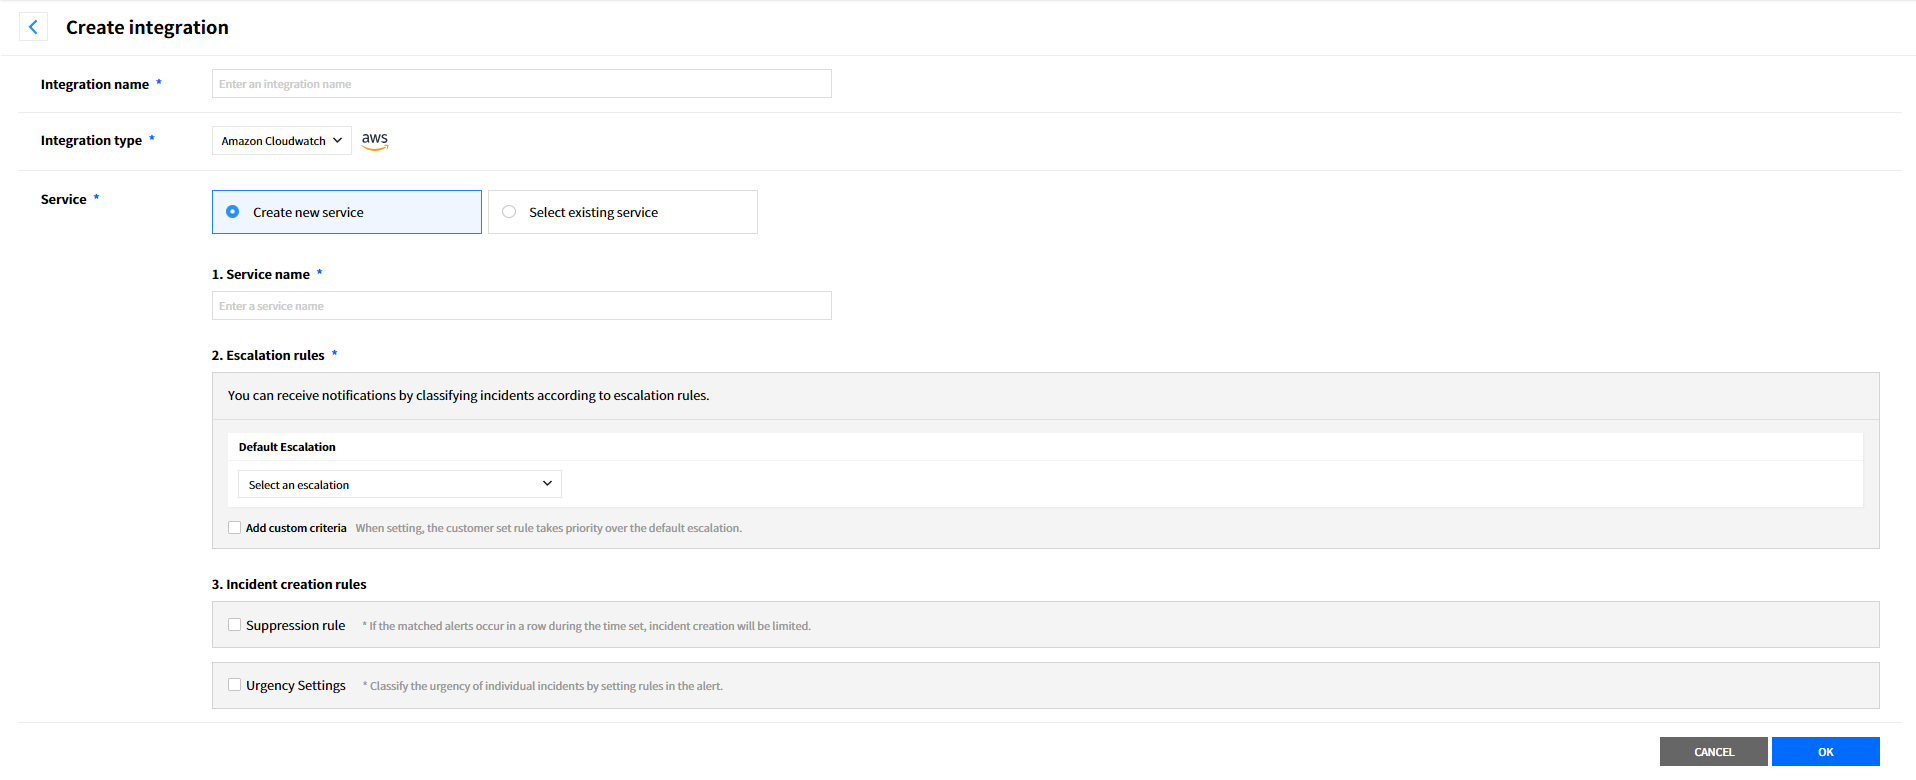
| Item | Description | Remark |
|---|---|---|
| Integration Name | Customers can set an Integration Name. | Required |
| Integration Type | The logo of the selected target is shown. | Required |
For creating a new service
When creating an integration, the service will also be created. You can create an integration in Create a new service page. Refer to the When registering a service to be notified: Adding a service for creating a service.
For selecting a service
When creating an integration, existing services will be mapped.
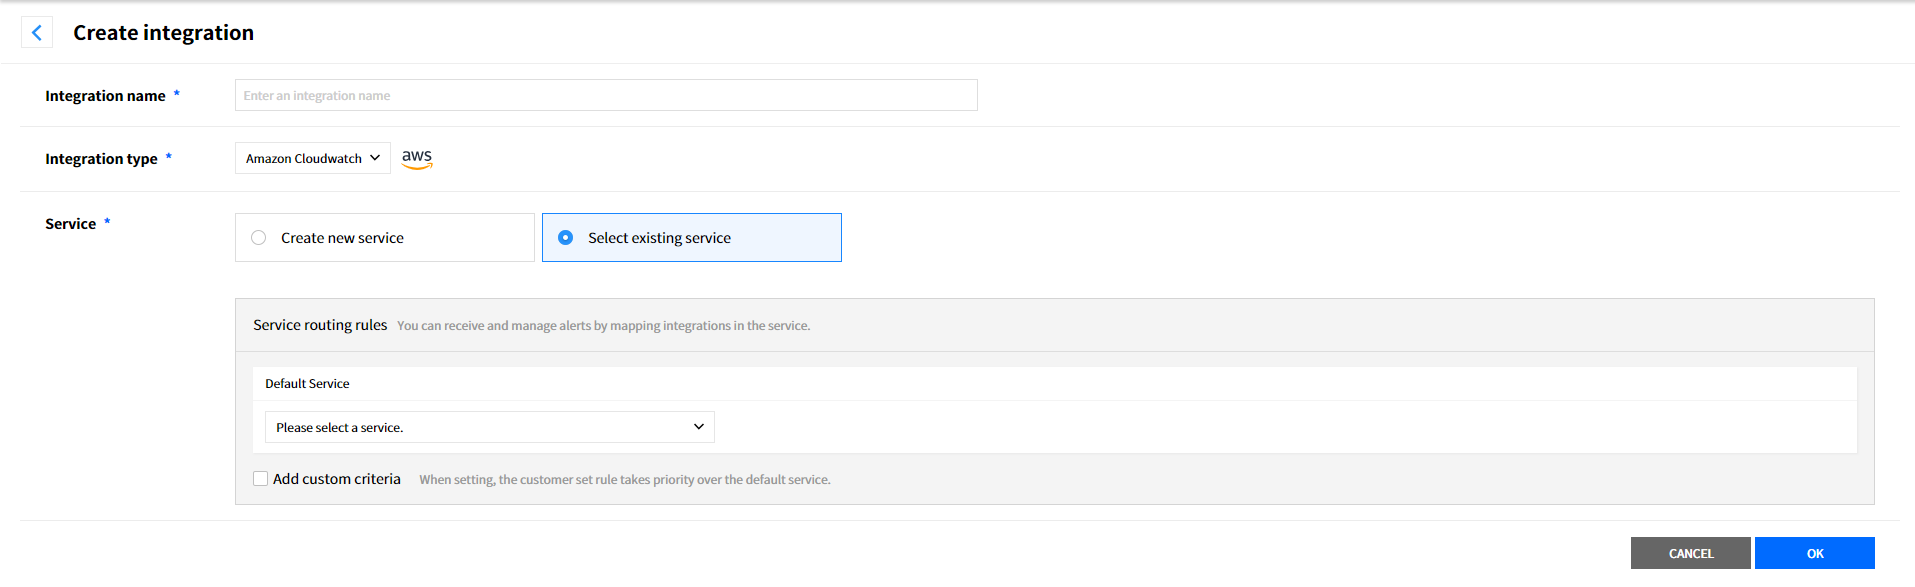
① Select the default service rule.
② If you choose Add custom criteria checkbox and set the conditions (Alert Summary and Alert Metric Name), the custom rule will be applied over the default rule.
③ Click the [OK] button after entering a name for an integration and selecting an existing service.
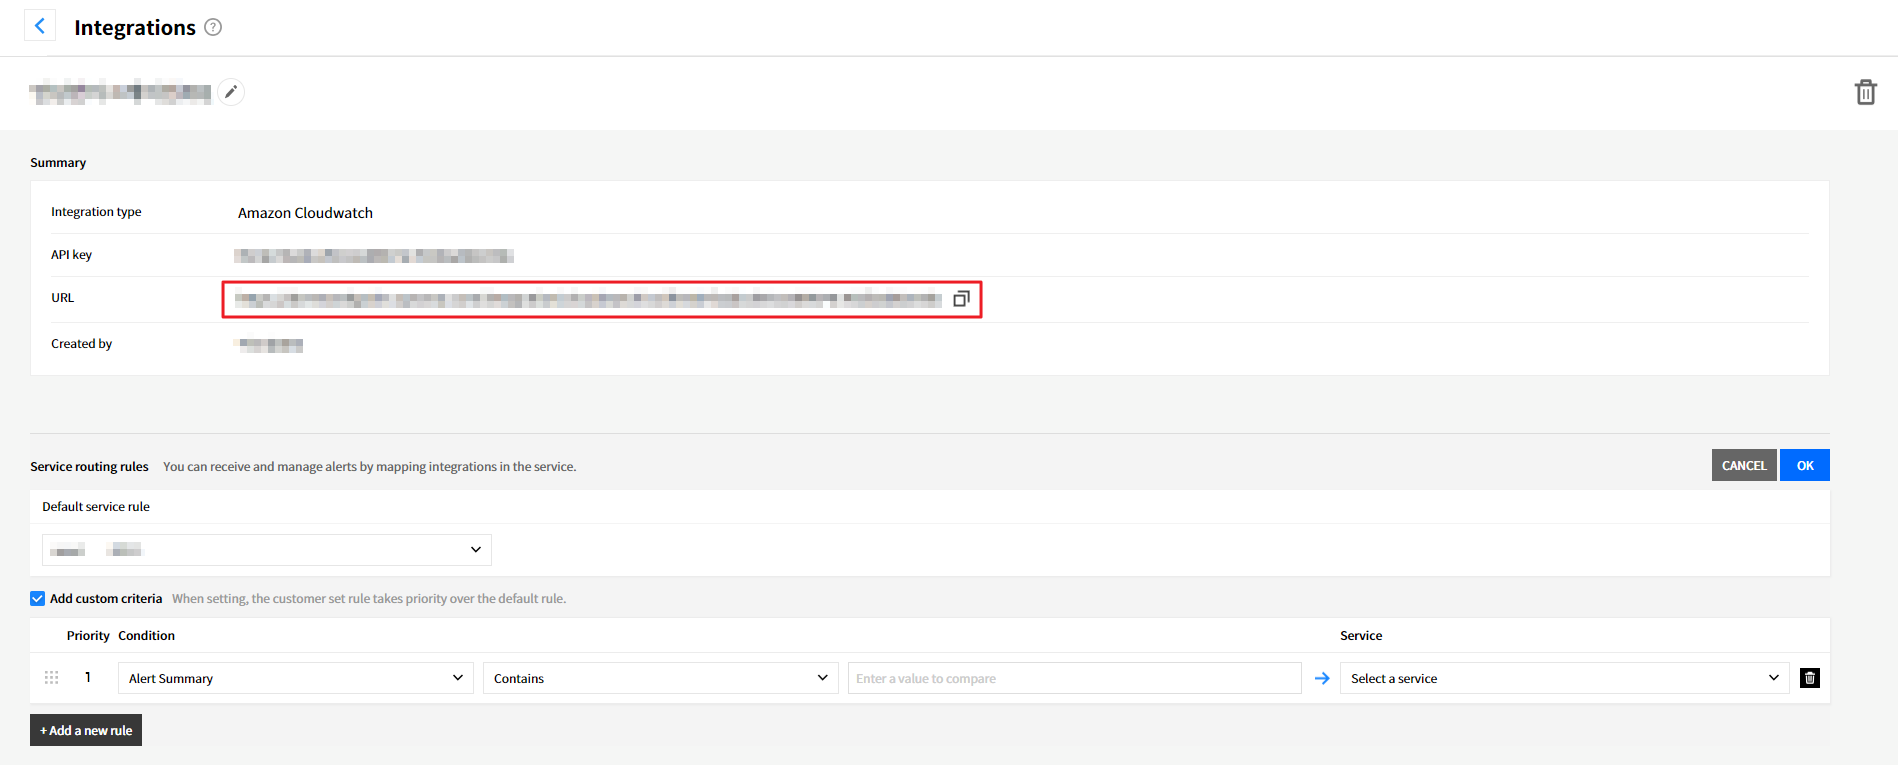
④ The URL is required information for connecting SNS (Simple Notification Service) and AlertNow. You can copy and paste the URL for creating SNS subscriptions.
To classify responders by tasks: Setting escalation routing
You can classify responders by setting conditions in creating a service.
① Click the [Services] menu to go to Services page and select the created service.
② Click the [Routing Rules] tab from the service page, and set routing conditions.
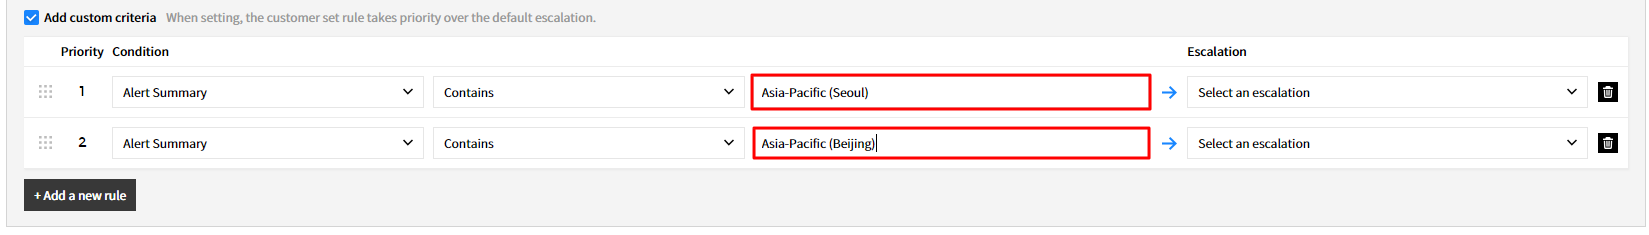
Setting responders by region
- Click the [Add custom criteria] checkbox, select Alert Summary and Contains and enter the region names in the comparison value field as below. You have to select the escalation after creating an escalation based on the conditions you set.
![]()
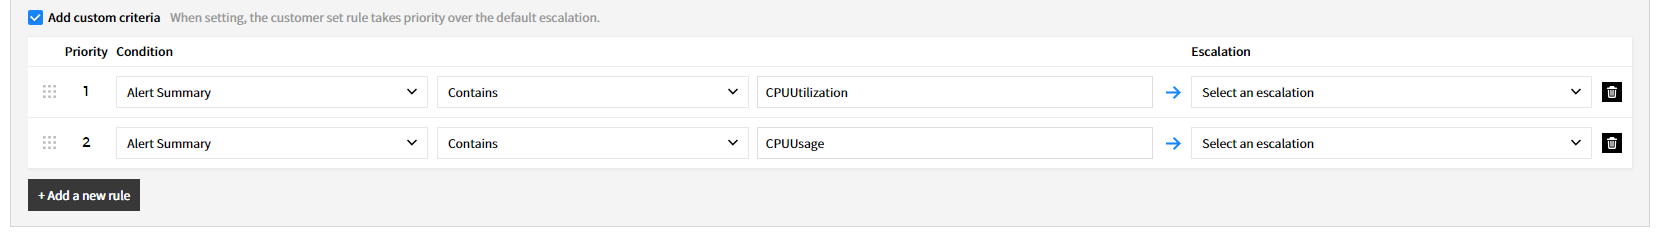
Setting responders by metric
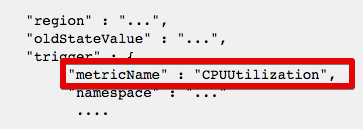
Click the [Add custom criteria] checkbox, and select “Alert Metric Name” and “Contains” in sequential order. Enter the metric names (ex: CPUUtilization) in the comparison value field as below. Select the escalation after creating an escalation based on the condition you set.
![]()
Click the [OK] button after setting the escalation rules.
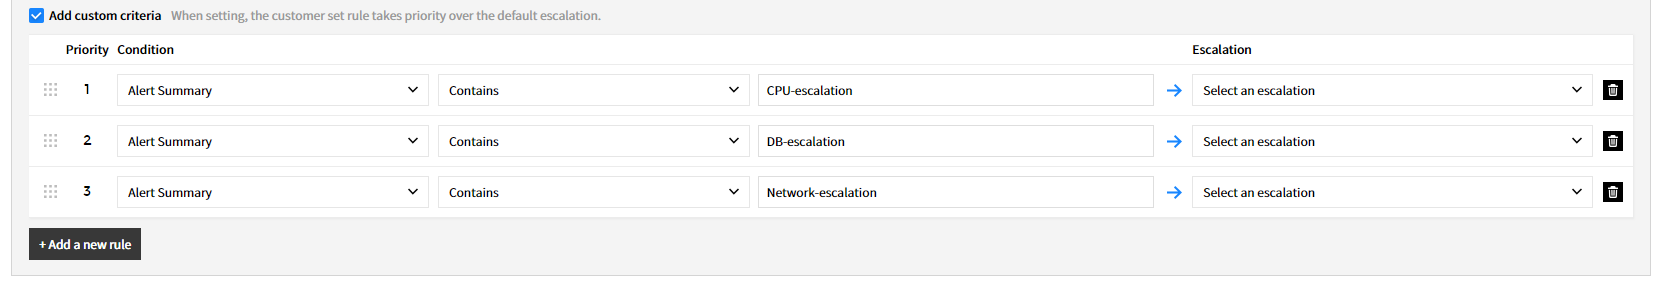
Setting responders by server roles (CPU, DB, Network)
Click the [Add custom criteria] checkbox and select “Alert Summary” and “Contains”. Enter the server roles in the comparison value field as below. Selecting the escalation after creating an escalation based on the condition you set.
![]()
Click the [OK] button after setting the escalation rules.
Help
What is AlertNow?
AlertNow is SaaS-based service incident lifecycle management platform that allows users to quickly detect and manage incidents that occurred by using alert monitoring, escalation policies, and on-call scheduling.
Access AlertNow
After signing in, available services will be displayed on the left menu bar. Click [AlertNow] from the list to access.
Menu Configuration
The menu configuration of each AlertNow service is shown below.
| Item | Description |
|---|---|
| Incidents | When collecting alerts, you can manage the status of the tickets created by incident policy. |
| Service | Service is a unit for managing incidents that occurred in Integration. |
| Schedules | Assign users to receive incident notifications in order to handle incidents more efficiently. |
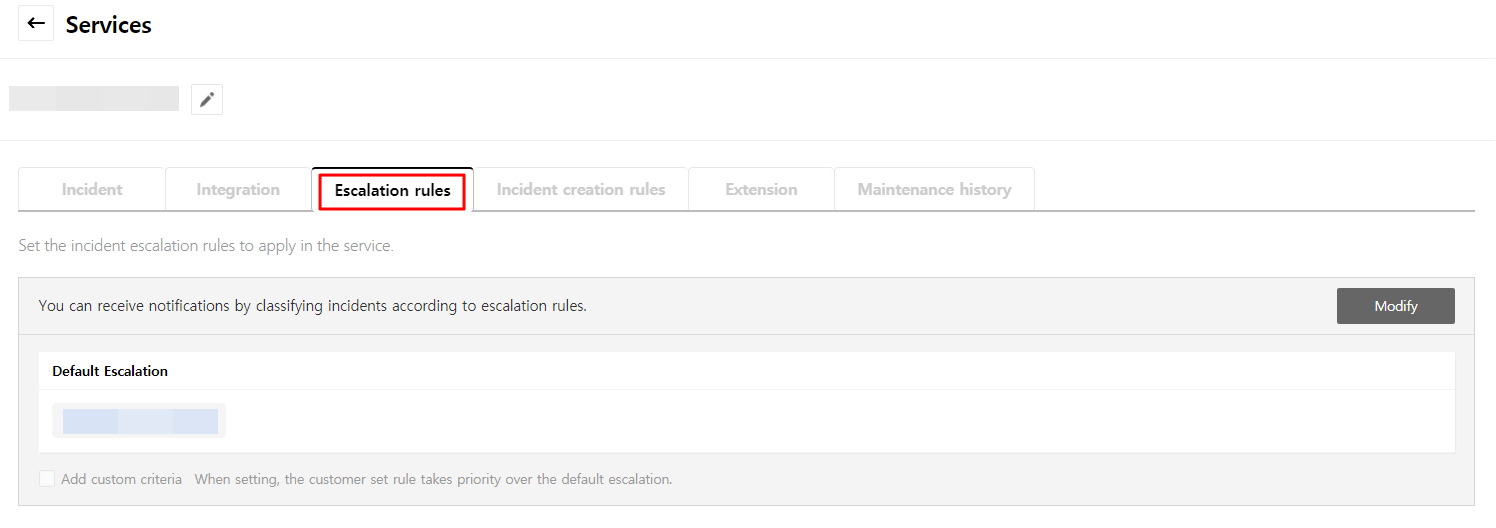
| Escalations | When an incident occurs, you can manage as a rule by appointing a manager to handle it step by step and setting the action and time (timeout) to be processed. |
| Integrations | Endpoint that connects notifications occurred from 3rd-party monitoring tools to AlertNow. |
| Extensions | Export data that were created in AlertNow to external tools or services. |
| Teams | Service for managing all the information related to incidents such as escalations, users and services in a group. |
| Users | Assign users as managers, responders, or observers to handle incidents efficiently. |
| Change History | Provide history logs that were made in AlertNow. |
| Notification History | Provide a history of SMS and Voice calls sent by the AlertNow. |
| Report | Visualize incident-related data via graph and table in System report, Incident report, and Notification report. |
| Personal Settings | Customize personal information and notification rules to handle incidents efficiently. |
| Mobile App | Receive notifications on your mobile app, and acknowledge or close incidents. |
Incidents
Overview
The Incidents menu provides a list of alerts and incidents that occurred in each service. Using the Incidents, the user can identify problems that need to be handled and record the processing status of each issue.
Alert
If you receive notification events that occurred from monitoring tools or other services that were integrated with AlertNow such as Amazon CloudWatch and Microsoft Azure, the notification event will be created as an Alert.
• Alert is raw data and the user cannot change the data or delete the created alert.
• Incident is created based on alerts. Not all alerts are created as incidents, but only the ones that match the Incident creation rule.
• Users do not receive all the notifications directly. AlertNow creates the Incident with alerts, and sends notifications that need to be reviewed by the user.
Incident
When events are sent to AlertNow, an incident is created through a predefined Incident Creation Rule. After the incident is created, the user can record how the incident was processed or receive notifications through Escalation.
With incidents, you can proceed the followings:
- Set the maintenance schedule depending on certain cases such as releases, DB, Infra, or Security operations. During that time, an incident will not be created. The alerts occurred during the maintenance will be saved as “Suppressed (by maintenance)” so that no incident will be created.
- Create incidents manually even if no alerts have been created.
- Merge more than two incidents manually.
To prevent duplicate incidents from being created, Receiving Return to Normal Notification, Limit Unclosed Incident Creation, Suppression Rules, and Delay Creation Rules are provided.
① Receiving Return to Normal Notification
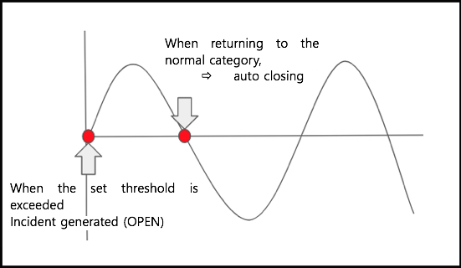
For incidents created based on the threshold, when the instance status gets back to normal, it automatically closes the existing incidents.
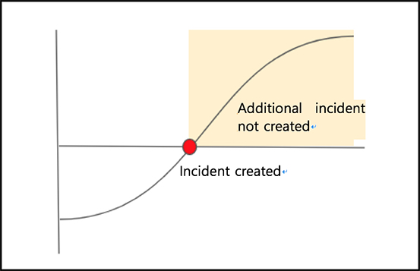
② Limit Unclosed Incident Creation
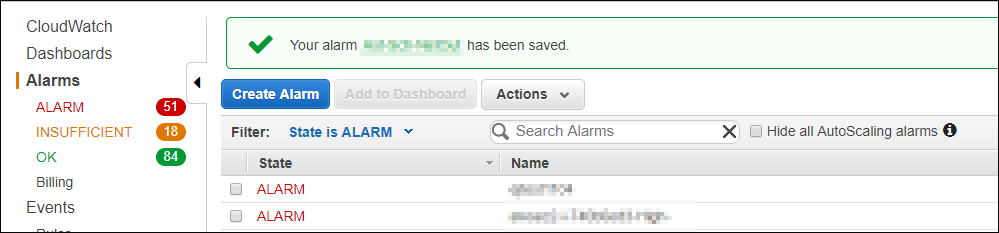
If there are unclosed incidents with the same CloudWatch alert name and dimension, it suppresses the incident creation.
📑 Note: Dimensions provided by CloudWatch
InstanceId, ApiName, Fleet, ServiceName, DistributionId, ClientId, RuleName, LogGroupName, ConnectionId, DBInstanceIdentifier, VolumeId, FileSystemId, LoadBalancerName, AutoScalingGroupName, ActionType, ClientId, PipelineId, JobId, Flow, StreamName, KeyId, FunctionName, BotName, MLModelId, Broker, HealthCheckId, Host, TopicName, QueueName, BucketName, AttackVector, LambdaFunctionArn, Domain, GatewayId, ServiceName, NatGatewayId,
VpnId, Rule, WorkspaceId
③ Suppression Rules
For alerts that are not filtered from “Unclosed incident creation limit”, it limits incident creation by applying the rules set from the service. If the conditions like Alert Summary and Metric Name occur repeatedly, you can set a period to avoid duplicate incidents from being created. However, there must be unclosed incidents to use suppression rules.
④ Delay Creation Rules
For recurring incidents, you can delay creating incidents until a specified time period and counts have passed. Enable this feature in the Creating Service of AlertNow page by second, minute, or hour (max. 1 hour), and at a maximum of 5 times for delaying the creation of incidents.
Alert and Incident relation
From what’s above, Alert and Incident can have the following relationships:
⑴ Based on Alert
| Incident creation | Alert : Created Incident | [ 1 : 1 ] |
| Triggered Incident | Alert : Triggered Incident | [ 1 : N ] |
⑵ Based on Incident
| Alert based on creation | Incident : Alert | [ 1 : 1 ] |
| Merge Incident | Base Incident : Dependent Incident | [ 1 : N ] |
| Related Incident | Incident : Related Incident | [ 1 : N ] |
Incident
Incidents > Incidents
The Incident provides a list of created incidents, so you can check the details of each incident and record the status of the process. It allows you to search specific incidents by filtering with period and keywords.
Screen Layout
The Incident menu is divided into two sections as below.
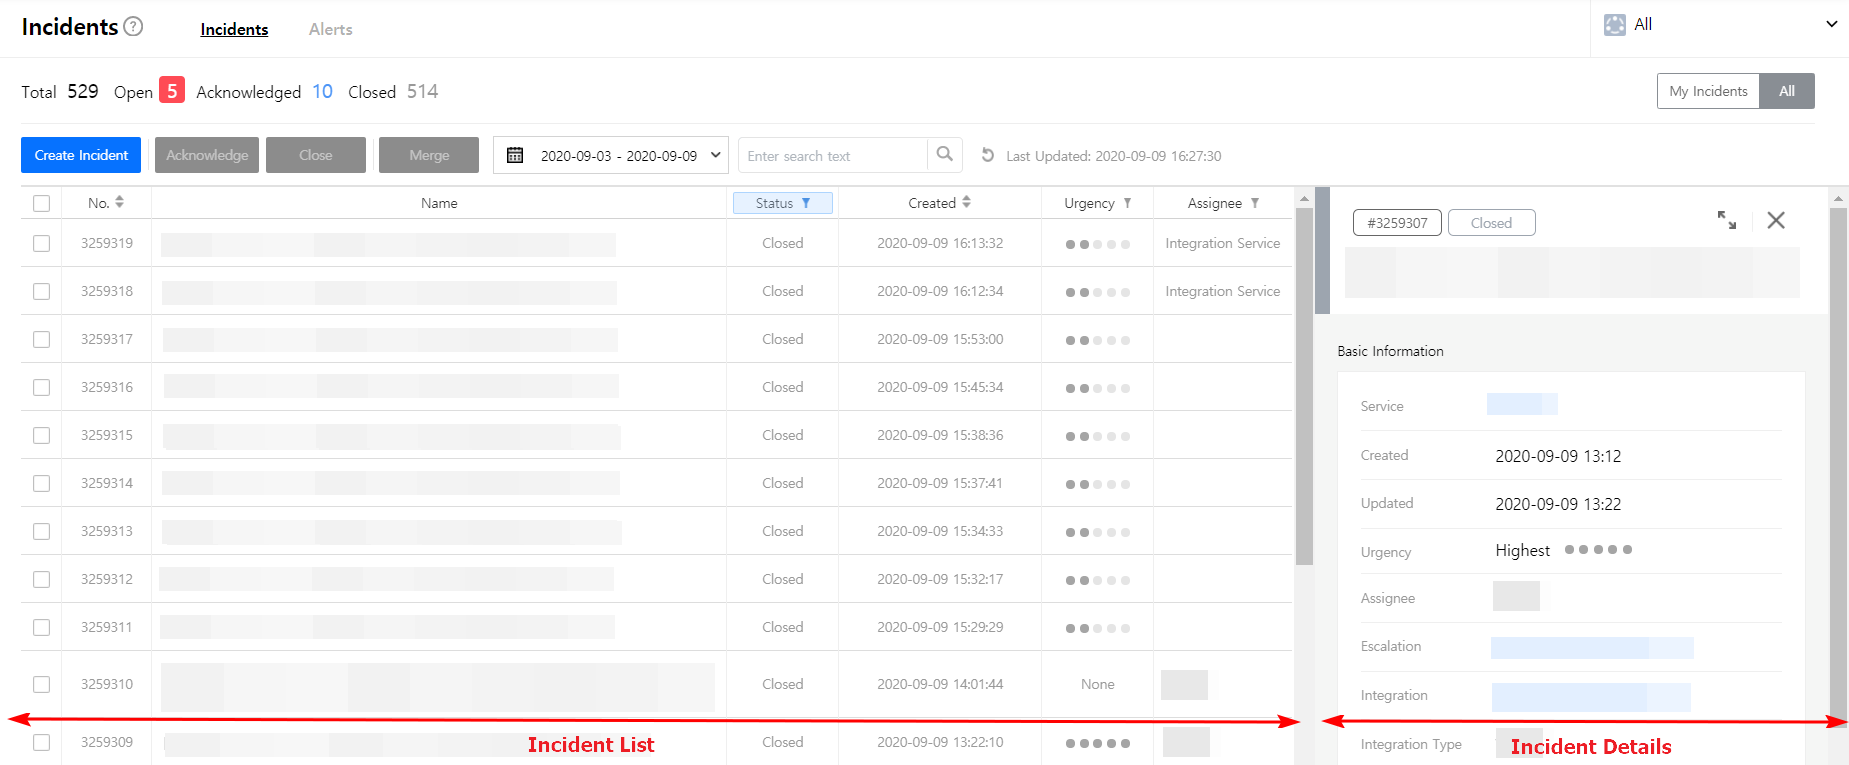
⑴ Incident List
You can check and search the list of incidents triggered. If you select the incident in the incident list, the information of the selected incident is displayed in the Details area. In the List page, you can check the following information.
| Item | Description |
|---|---|
| Number | Display the Identification Number of the incident. |
| Title | Display the title of the incident. |
| Status | Display the status of the incident, the values are as below. • Open • Acknowledged •Closed |
| Created | Display the created date and time of the incident. |
| Updated | Display the last updated date and time of the incident. |
| Urgency | Display the urgency of the incident. |
| Service | Display the name of the service where the incident occurred. |
| Assignee | Display the name of the user designated as the manager of the incident. |
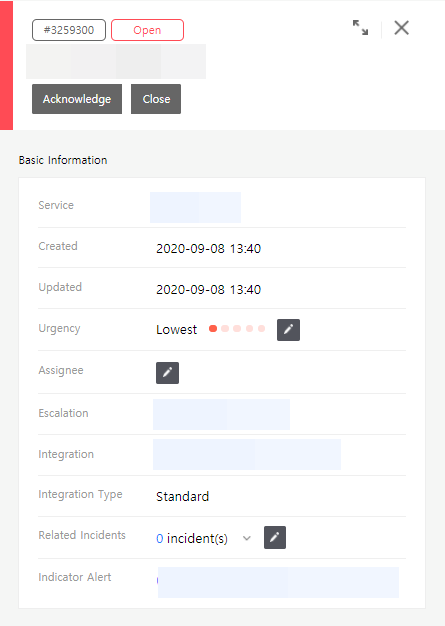
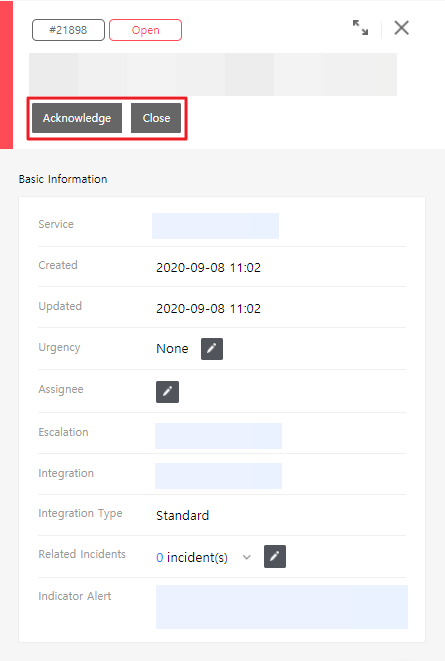
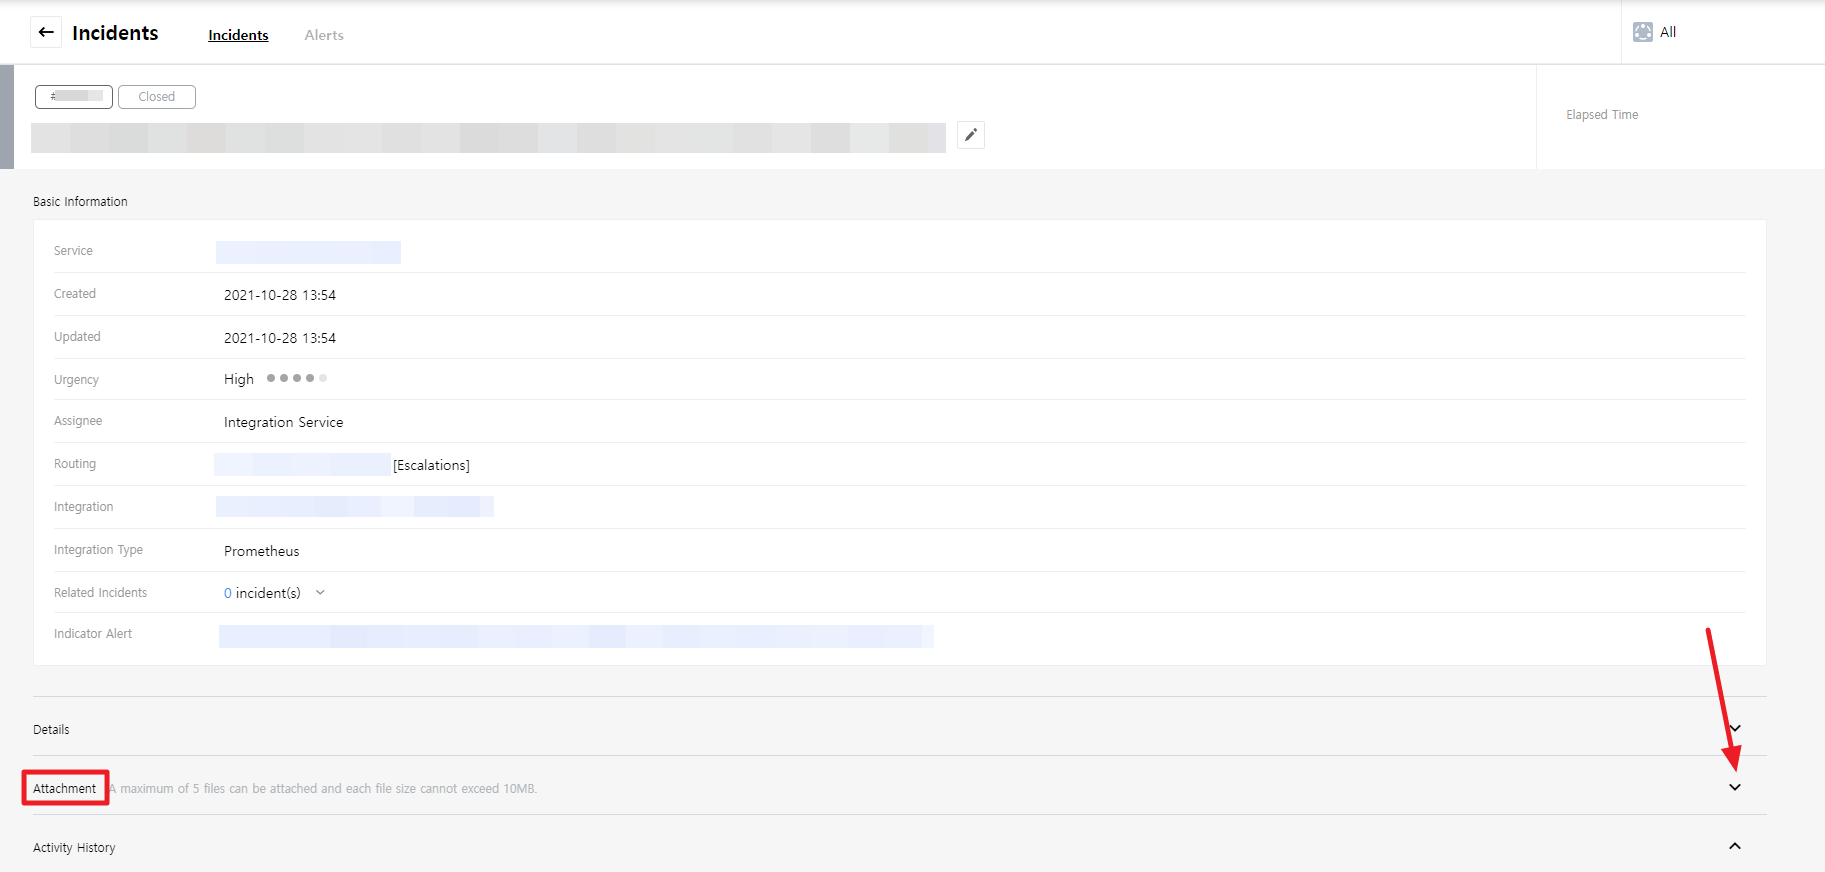
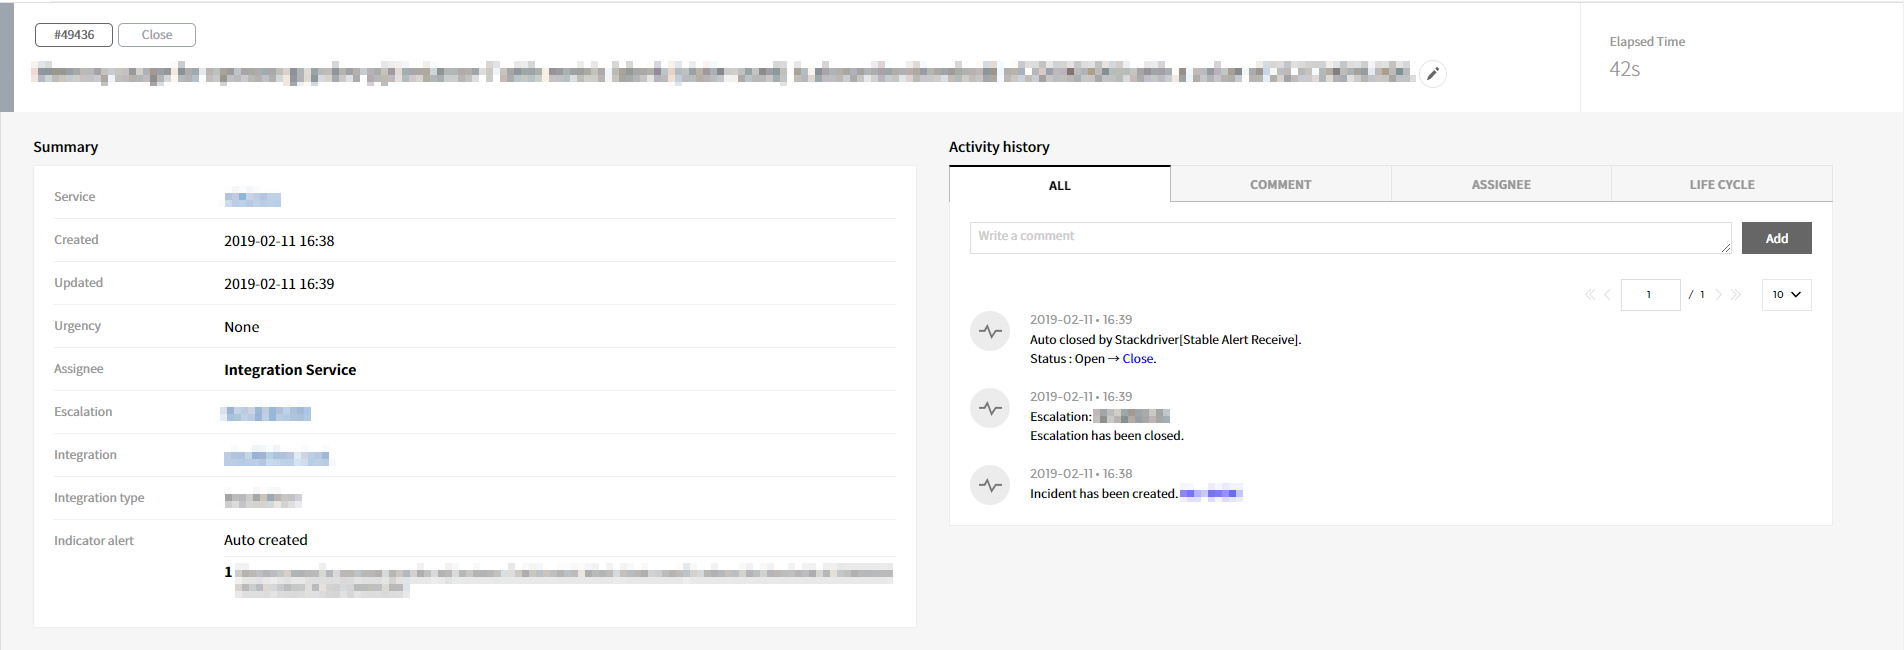
⑵ Incident Details
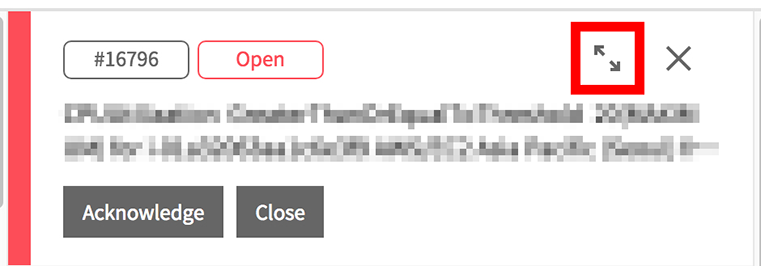
You can check the details of incidents selected in the Incident List. The user can also view on the bigger screen by enlarging it. In the Incident Details page, you can check the following information.
• Summary
| Item | Description |
|---|---|
| Service | Display the name of the service where the incident occurred. |
| Created | Display the created date and time of the incident. |
| Updated | Display the last updated date and time of the incident. |
| Urgency | Display the urgency of the incident. |
| Assignee | Display the manager of the incident. |
| Escalation | Display the Escalation Rule set in the incident. |
| Integration | Display the name of the Integration that caused the incident. |
| Integration Type | Display the Integration Type that caused the incident. |
| Indicator Alert | Display the alert that caused the incident. |
• Details
| Item | Description |
|---|---|
| Message | Display an attached message when an alert occurs. |
| Description | Display the description of the incident. You can enter the description manually. |
Incident Status
Incident has three types of status values and the title area is displayed with different colors depending on the status.
⑴ Open
The incident is newly created and has not yet been processed.
⑵ Acknowledged
The manager recognizes the problem and handles it.
⑶ Closed
The problem has been solved and closed.
Incident Search
The user can search incidents by filtering with period and keyword in the Incident List. The search results are displayed in the Incident List.
⑴ Period Search
- Preset period selection
The user can search incidents by filtering the period and keyword in the Incident List. The search results are displayed in the Incident List.
| Preset | Period |
|---|---|
| All | Search the entire period when incident occurred |
| Today | Select the current date |
| Yesterday | Select the yesterday’s date |
| Recent 1 Week | Select the recent 1 week based on the current time |
| This Week | Select the corresponding week based on the current time |
| This Month | Select the corresponding month based on the current time |
| Last Week | Select the previous week based on the current time |
| Last Month | Select the previous month based on the current time |
- Custom
You can manually select the search start and end date/time by selecting the [Custom]. When selecting a period, incidents within the selected period are displayed in the Incident List.
⑵ Keyword Search
The user can enter keywords to search for incidents. The search results will be displayed that matches with the keywords during the selected period.
⑶ Toggle Button
- My Incidents
In the Incident List, it only displays incidents that you have been assigned. - All
Display all incidents
Incident Management
You can perform the following tasks on Incidents.
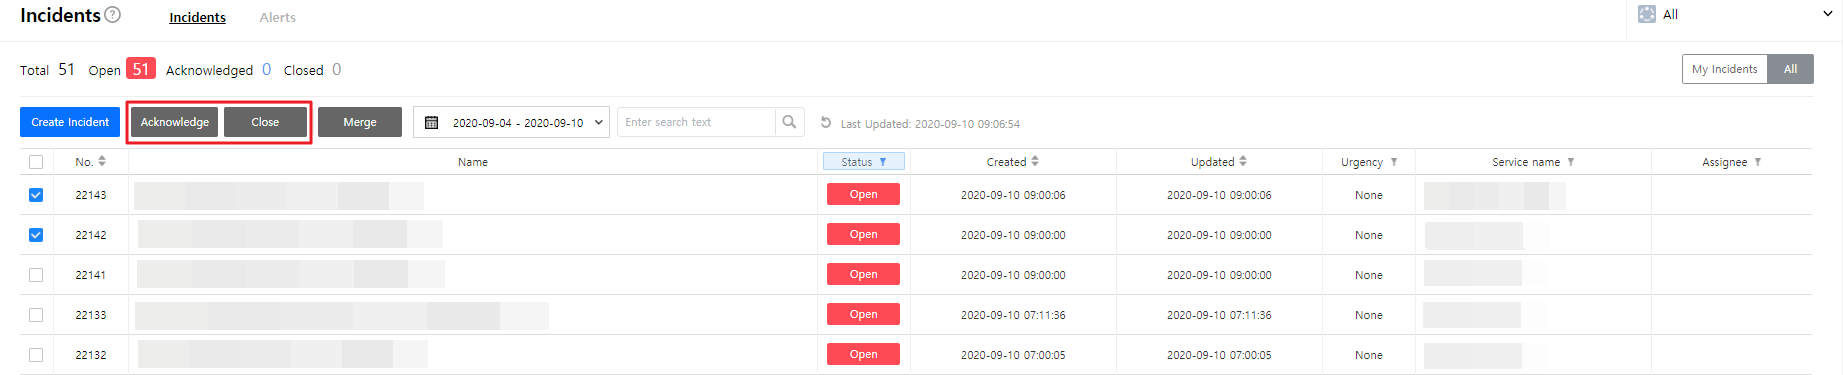
⑴ Change status
You can change the incident status. You can change the status of an individual incident, and you can select multiple incidents to change the status.
Change Incident Status
Press the button at the bottom of the name to change the status in the details page.
![]()
• Incident in Open status can be changed to Acknowledged or Closed status.
• Incident in Acknowledged status can be changed to Closed status.
• Incident in Closed status cannot be changed.Change Incident Statuses in Batch
You can change all of the incident statuses at once by selecting multiple incidents and changing the status of all incidents. Select multiple incidents and change the status by clicking the [Acknowledge] or [Close] button on the upper left of the Incident List.
![]()
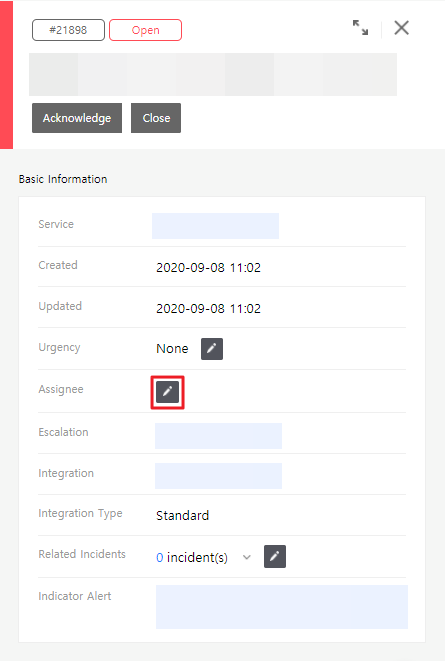
⑵ Assign and Change Assignee
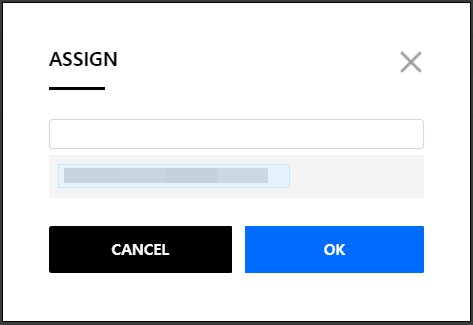
You can assign or change managers per incident. If you click the [Assign] button on the Incident Detail page, a popup will be prompted to assign a manager.
Select Incident to assign manager
The Manager field displays the name of the currently assigned manager. If you click the [Assign] button, a popup will be prompted to assign a manager.
![]()
Select Manager
You can assign a manager by typing the name of the manager from the popup window. However, you cannot assign multiple managers for a single incident.
![]()
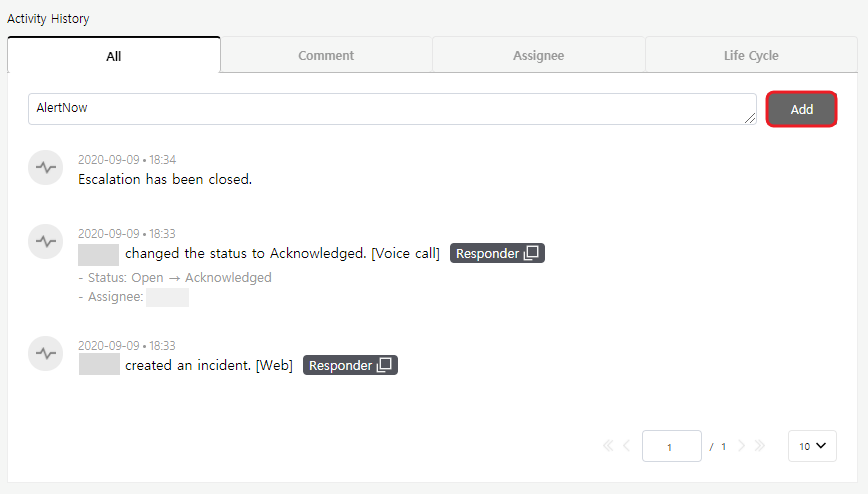
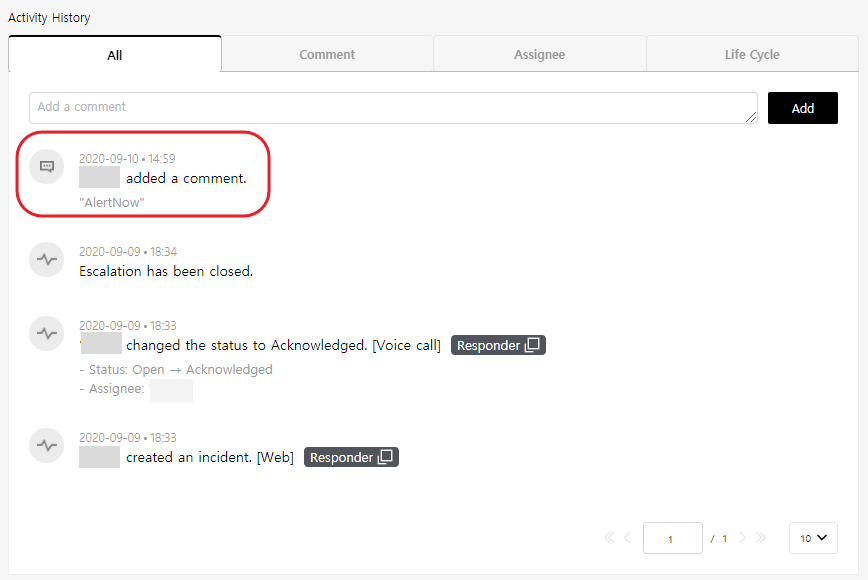
Write comment
You can write a comment on IncidentsGo to Full screen of the Incident page. In the Incident Detail page, enter either in the “All” or “Comment” at the Activity History tab.
![]()
Click the [Add] button after entering a comment.
![]()
Check the comment you entered.
![]()
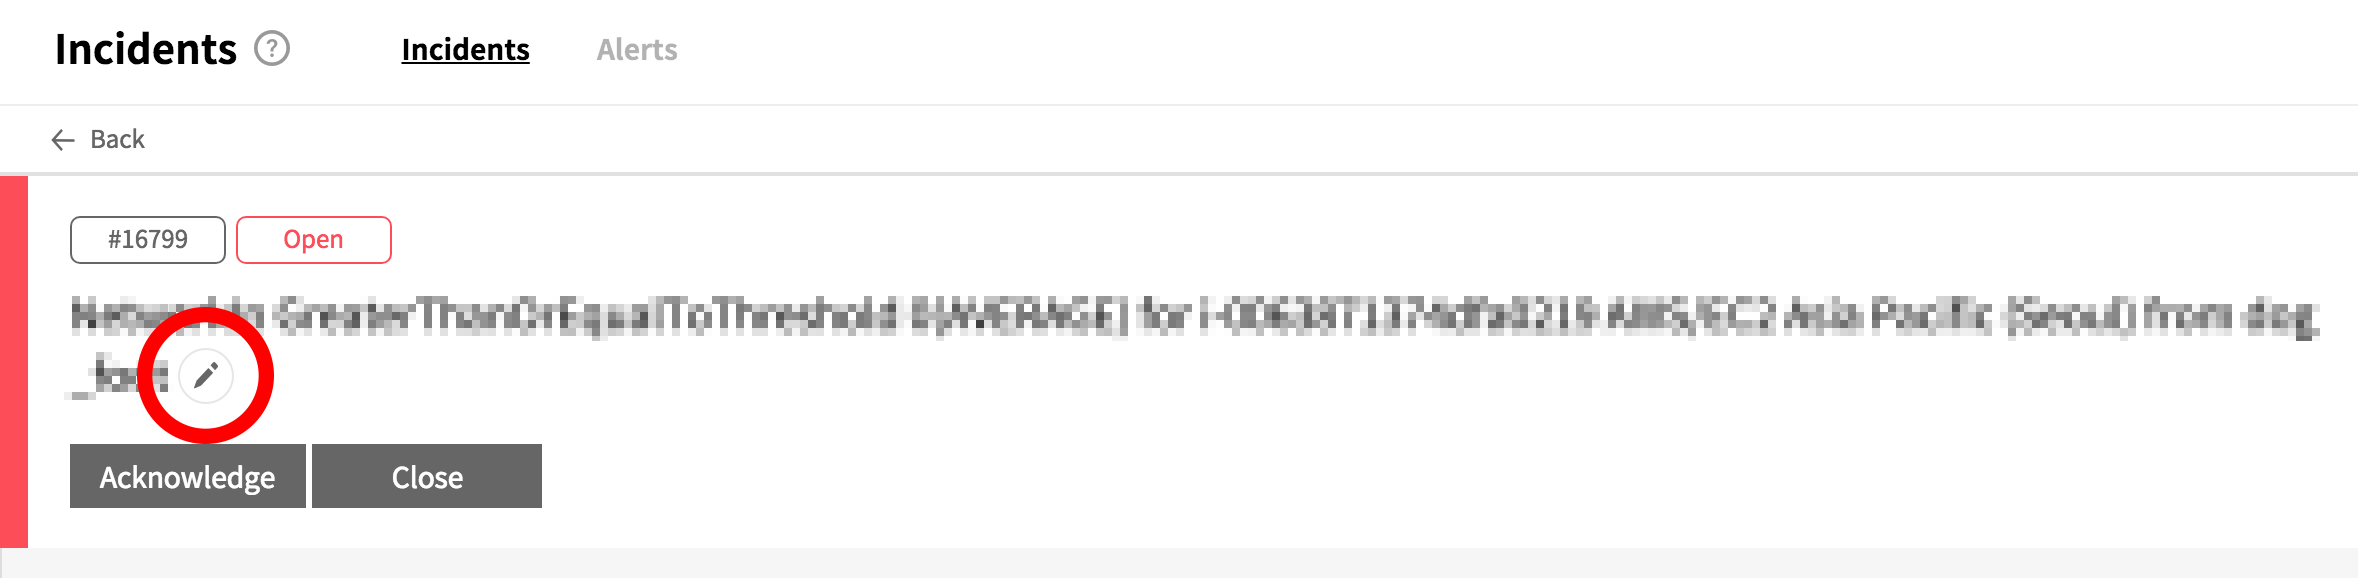
Change Title
You can change the title of each incident.Click the [Modify] button in the Title area of the full screen.
![]()
Click the [OK] button after editing the title.
![]()
Check the title you changed.
![]()
⑶ Check Indicator Alert
You can check the indicator alert for each incident, and go to the Details page of each alert.
a. Check incident indicator alert
b. Click the indicator alert to view alert details
Create Incident Manually
You can create incidents manually before alerts are created.
① On Incidents, click the [Create Incident] button.
② A pop-up window will be displayed as below.
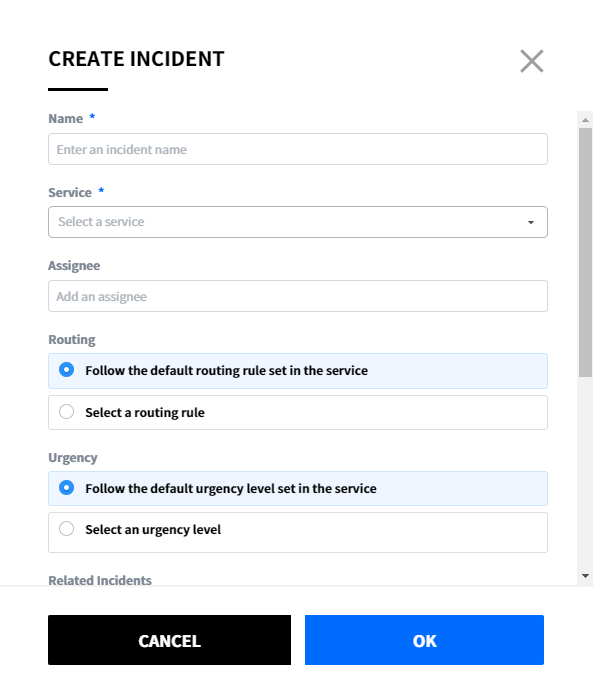
See below for the description of each field on the pop-up window.
| Item | Description |
|---|---|
| Service | Select a service created in the Service page. |
| Title | Enter the incident title. |
| Assignee | If you hover the mouse over the input field, a list of assignees will be shown as a dropdown. You can select the assignee from that list. If you designate yourself for an assignee, • the incident status is automatically set as Acknowledge upon creation, so escalation may not be made. (When setting an escalation rule, if the incident status to close escalation in Close condition is Acknowledge, escalation will not be made, but if the status is Close, escalation will be continued.) • notifications will not be sent even if the notification in When an incident is assigned to me is set in Personal Setting > Notification rules. |
| Routing | Follow the default routing rule set in the service When selecting, the default escalation rules set in the service will be applied. Select a routing rule The user can select an escalation rule that has been manually created. |
| Urgency | Follow the default urgency level set in the service When selecting, the default urgency rule set in the service will be applied. Select an urgency level The user can manually select the urgency. (None/Highest/High/Medium/Low/Lowest) |
| Related Incident | Add related incidents by searching the existing incident numbers. |
| Select Date/Time | Set a date and time in the past for the incident. |
| Send Notice | Send a notice via SMS by creating an incident. |
| Description | Enter the description about an incident to be created. |
③ If you click the [OK] button, incident will be created.
④ The created incident will be shown as below.

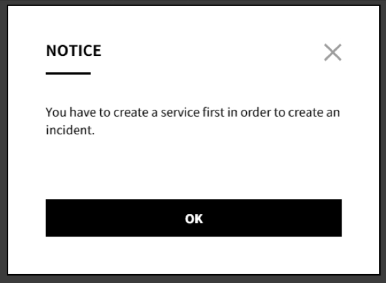
💡 You cannot create an incident when there is no created service. You must create a service first in order to create an incident.
Merge Incidents
You can merge two or more incidents manually. To merge incidents, you need to specify the parent incident and dependent incident. Dependent incidents must be open or acknowledged. When merging incidents, the status of parent incident will not be changed, dependent incident will be closed and the status will be changed to “Closed (Merged)”. When the incidents are merged, all the notifications and escalations will be stopped.
① Select incidents you want to merge, and click the [Merge] button.
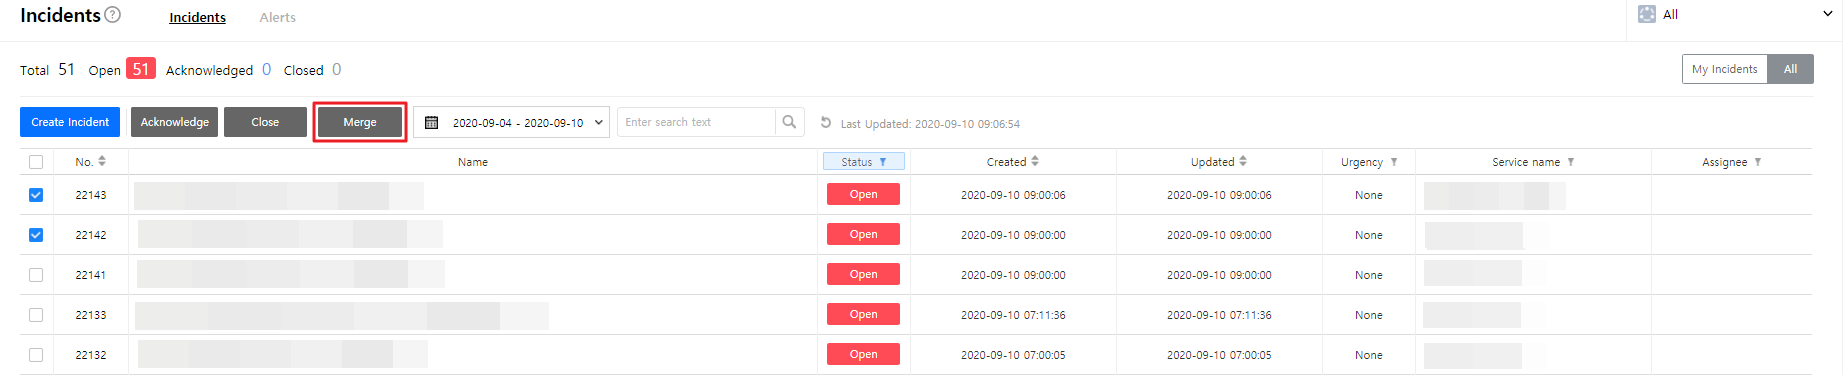
② A popup will be prompted as below.
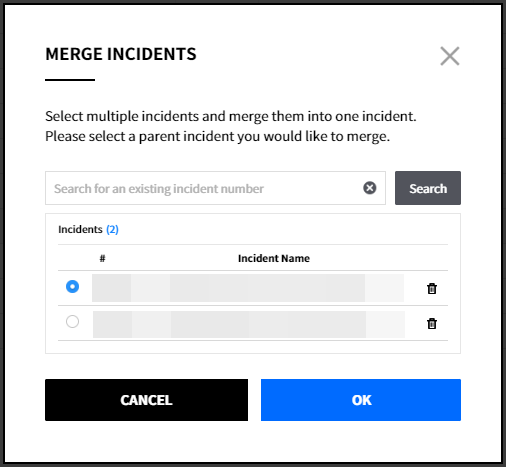
③ Select a parent incident to merge, and click the [OK] button to complete merging incidents.
④ The merged incident will be shown as below.

Incident File Management
You can add, delete, or download attachments to Incidents in order to manage the incidents efficiently.
① Select an Incident first and go to Attachment section.
② In the Attachment page, you can drag and drop files or click the [Browse files] button to upload the file.
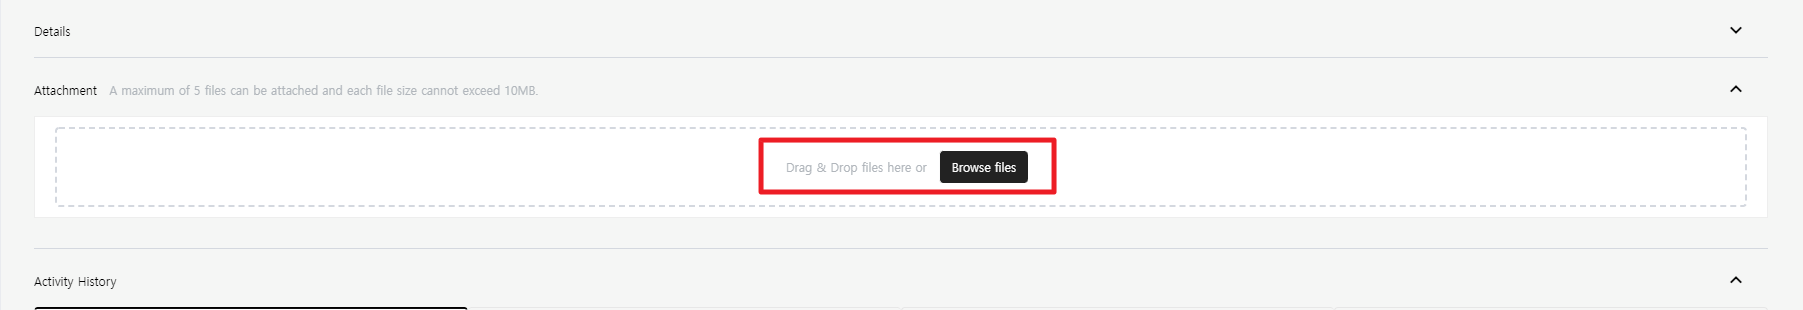
③ When the files are uploaded, you can see the file list as below.
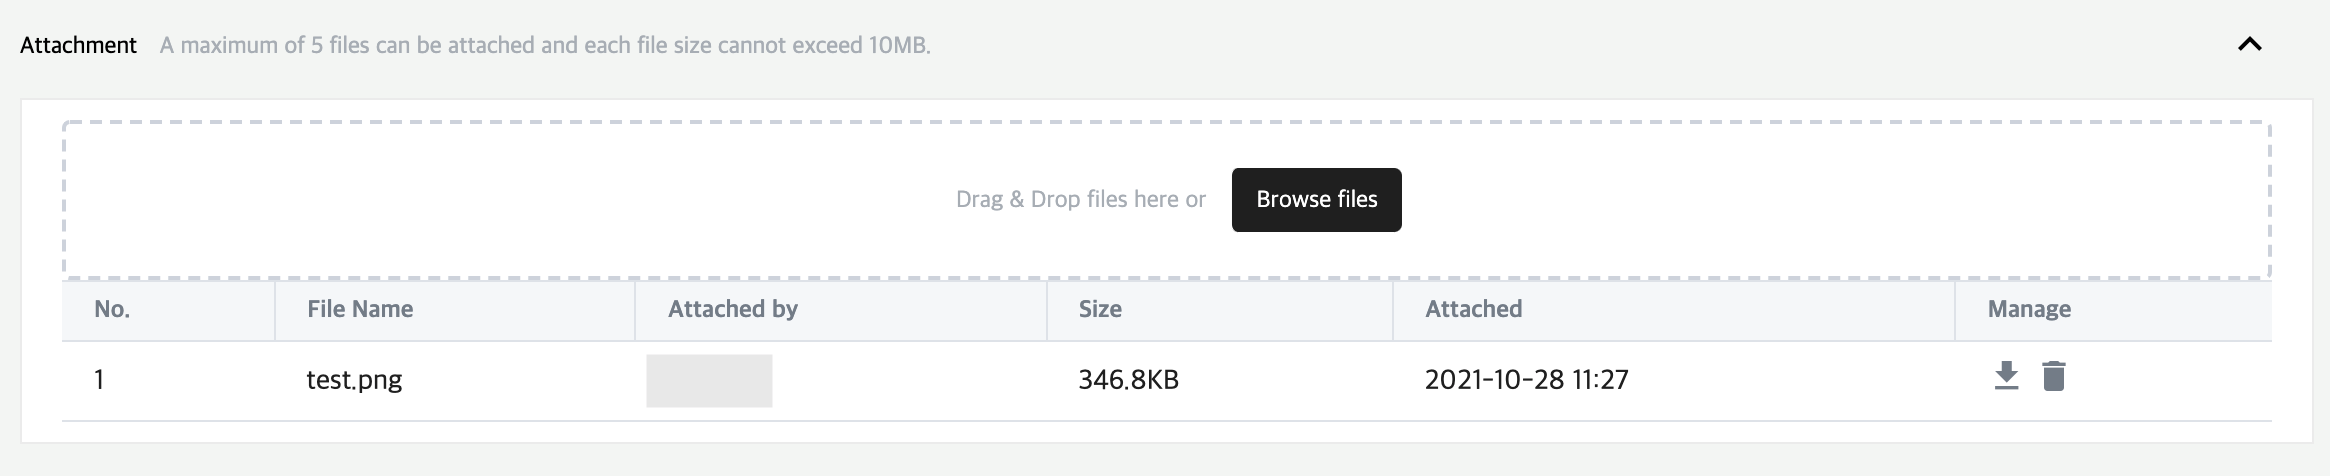
④ Select icons in the Manage tab to download or delete a file.
Alert
Incidents > Alerts
The Alerts menu provides a list of alerts and checks the details as well. You can also search for specific alerts by filtering with the period and keywords.
Screen Layout
The Alert menu is divided into two sections as below.
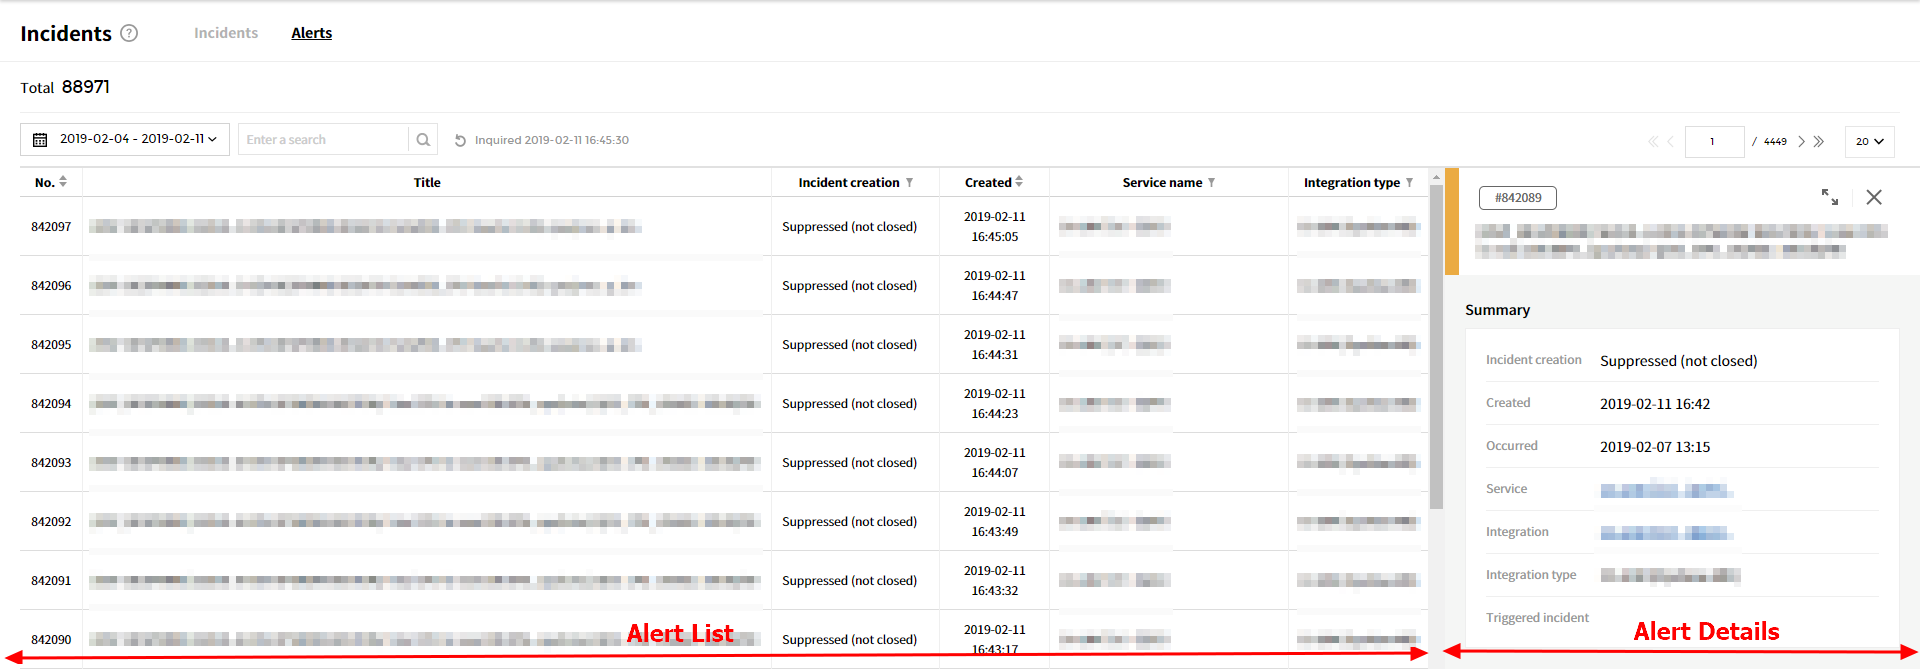
⑴ Alert List
You can check and search alerts triggered from the alert list. If you select the alert from the list, the information about the selected alert will be displayed. In the List page, you can check the following information.
| Item | Description |
|---|---|
| Number | Display the Identification Number of the alert. |
| Title | Display the title of the alert. |
| Incident Creation | Display whether the incident for corresponding alert has been created. - Incident created - Suppressed (by suppression rule) - Suppressed (by maintenance) - Suppressed (not closed) - Suppressed (by delay rule) |
| Created | Display the created date and time of the alert. |
| Service | Display the name of the service where the alert occurred. |
| Integration Type | Display the integration type of the service where the alert occurred. |
⑵ Alert Details
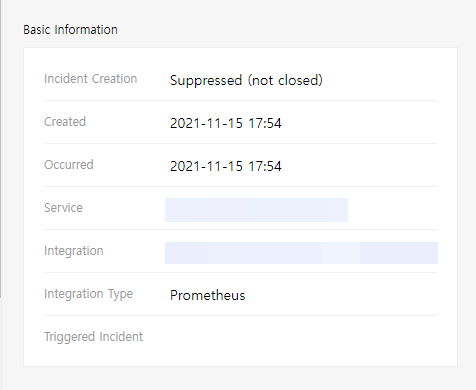
You can check the details of the alert selected in the Alert List. The user can also view on the bigger screen by enlarging it. In the Alert Details page, you can check the following information.
• Summary
| Item | Description |
|---|---|
| Incident Creation status | Display Incident creation results according to Incident creation rule. |
| Created | Display the created date and time of the alert. |
| Occurred | Display the occurred date and time of the alert. |
| Service | Display the name of the service where the alert occurred. |
| Integration | Display the integration of the alert. |
| Integration Type | Display the Integration Type of the service that caused the alert. |
| Triggered Incident | Display the incident name where the alert occurred. |
• Details
| Item Description | |
|---|---|
| Message | Display a message when alerts were triggered. |
| Description | Description of the alert. You can write descriptions manually. |
Alert Search
The user can search alerts by filtering with the period and keyword in the Alert List. The search results are displayed immediately in the Alert List.
⑴ Period Search
- Preset period selection
Provide various period options for the user to choose. When the user selects a period option from the table below, the result will be displayed in the list immediately.
| Preset | Period |
|---|---|
| All | Search the entire period when incident occurred |
| Today | Select the current date |
| Yesterday | Select the yesterday’s date |
| Recent 1 Week | Select the recent 1 week based on the current time |
| This Week | Select the corresponding week based on the current time |
| This Month | Select the corresponding month based on the current time |
| Last Week | Select the previous week based on the current time |
| Last Month | Select the previous month based on the current time |
- Custom
You can manually select the start and end date/time by selecting the [Custom]. When selecting the period, alerts within the selected period are displayed in the Alert List.
⑵ Keyword Search
You can search incidents by entering keywords. The search results will be displayed that matches with the keyword during the selected period.
Alert Management
You can perform the following tasks on Alert in the list.
⑴ Check Message
You can check the detailed message about the alert that occurred.
a. Click the [Full Screen] icon on the Alert Detail page.
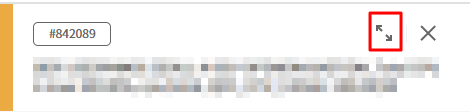
b. Detailed message is displayed in the new tab.
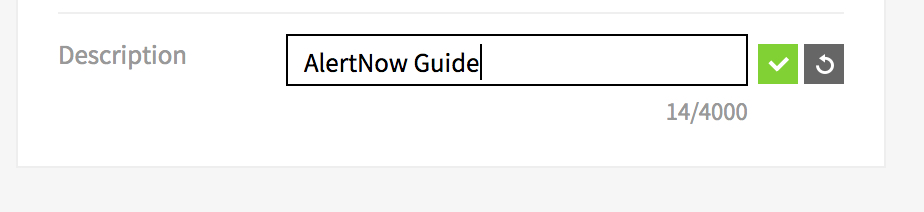
⑵ Enter Description
You can write a description about the alert that occurred.
- Click the [Full Screen] icon on the Alert Detail page. Then go to Description at the bottom of the detail page.
- Enter the description and click the check button.
![]()
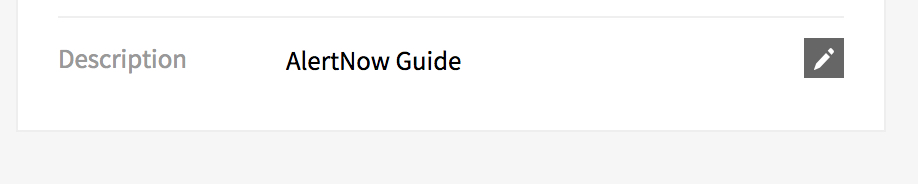
- Check the description you entered.
![]()
⑶ View Triggered Incident
You can check the incidents created by selecting an alert, and go to the Details page of each incident.
- Check Triggered Incidents
![]()
- Click the triggered incident to view Incident details
![]()
Services
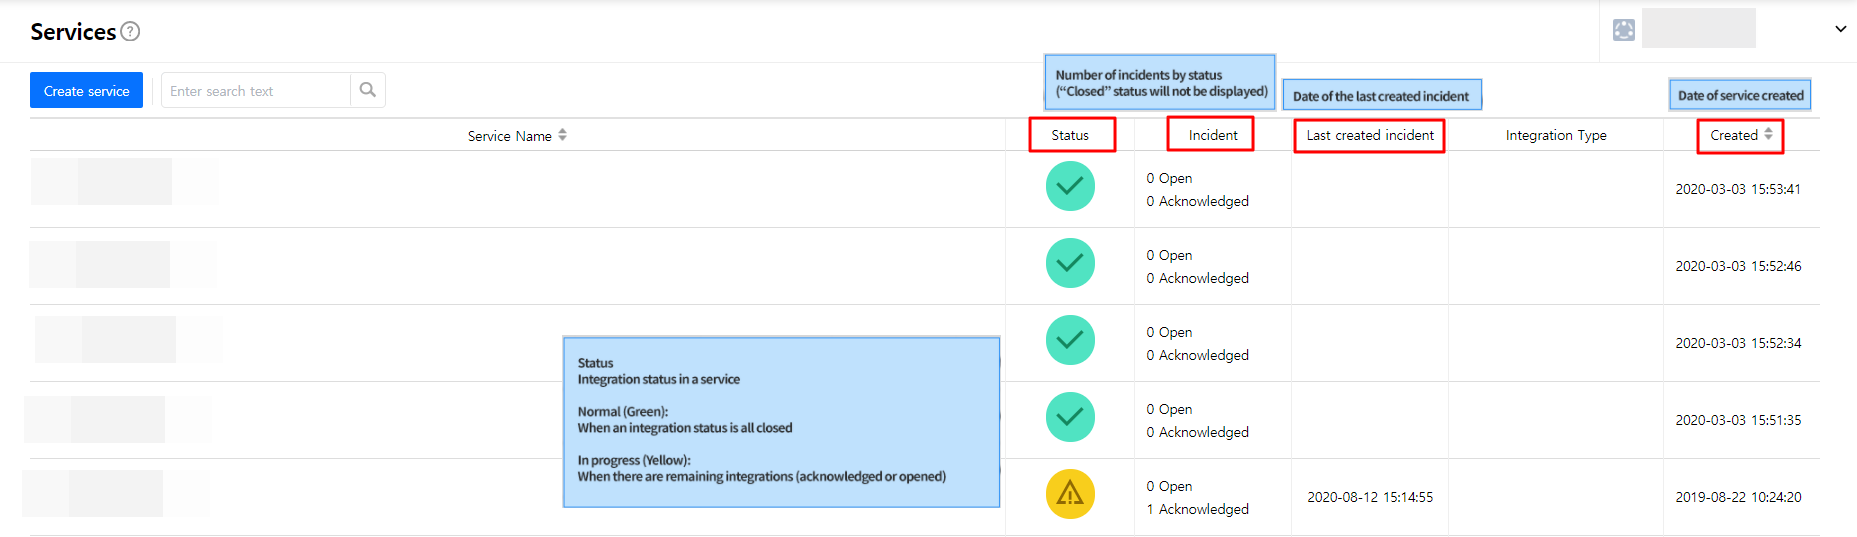
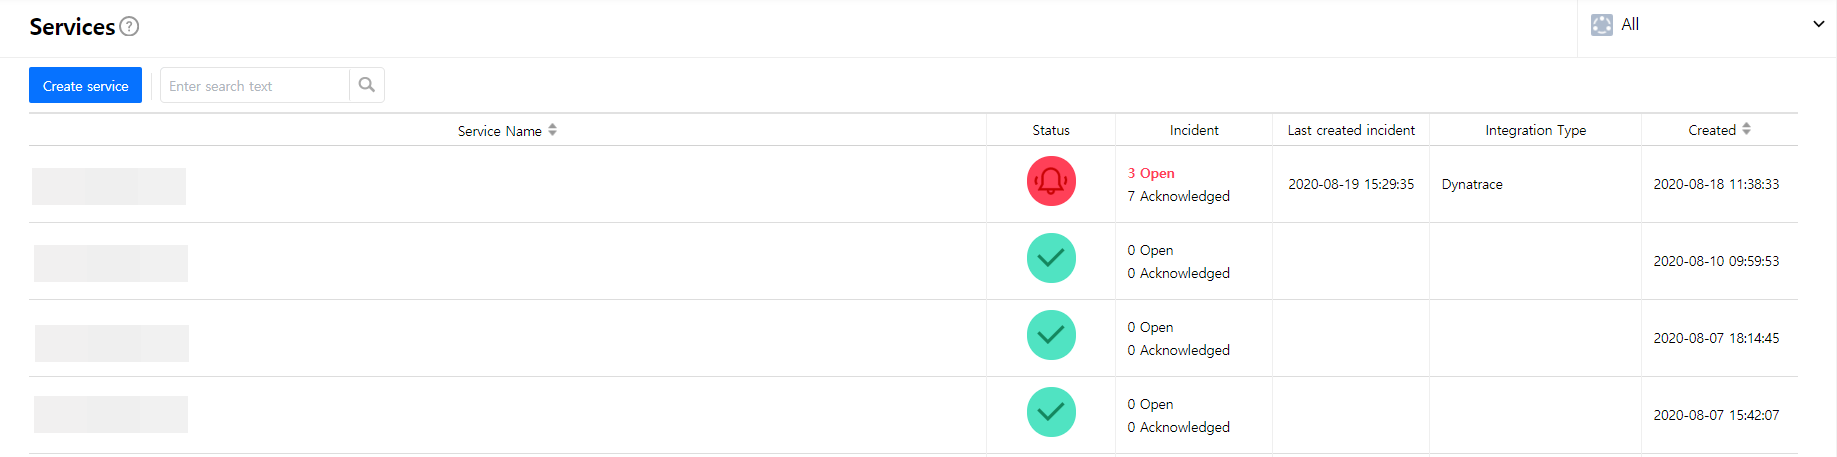
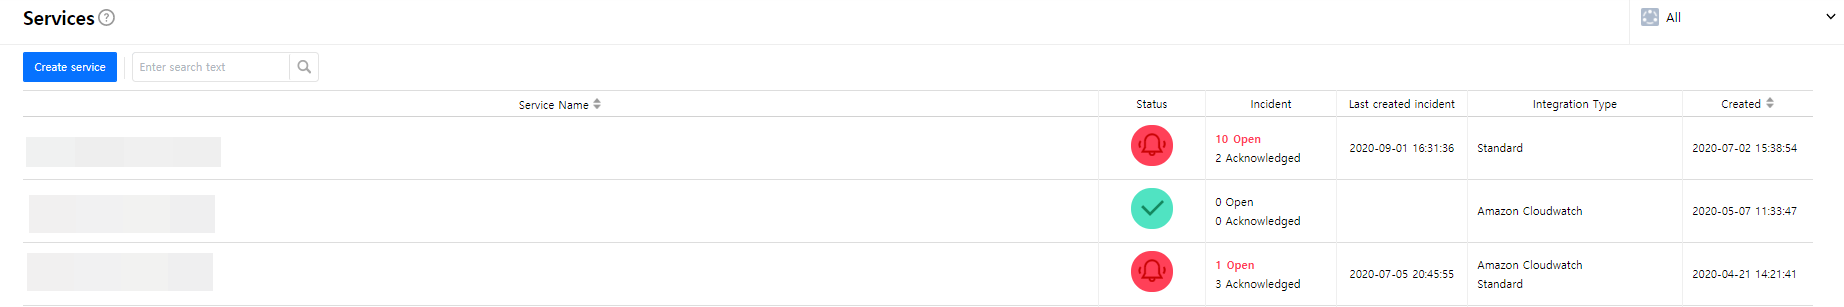
Service is a unit for managing incidents that occurred in Integration, and provides all the necessary data about Incidents, Integrations, and Escalations in a single page in order to manage incidents efficiently. Also, you can use routing rules that are set in integrations to manage incidents.
Service can be created in two ways:
Create a Service from Menu
Select the [Service] from the menu.
Click the [Create Service] button.
Enter the required information.
| Item | Description | Note |
|---|---|---|
| Service Name | Enter a name for a service that you want to create. | Required |
| Routing Rule | • Default Routing If the setting is to set to None, the default routing will be used. |
Required |
| Incident Creation Rule | • Suppression Rules If conditions like Summary and Metric Name occur repeatedly, you can add time conditions (Sec, Min, Hour, Day) to suppress repeating alerts. • Urgency Settings Set a level of urgency to handling incidents for optimal outcomes. • Delay Creation Rules Delay creating recurring incidents until a certain time period and counts. Time period can be set in second, minute, or hour, and the feature can be set at a maximum of one hour and 5 times. |
Custom Settings
① Choose the created service and go to the detail page, and select each tab to configure the settings.
| Item | Description |
|---|---|
| Incident | View incident status based on period and search conditions. |
| Integration | View the integration information about the service. |
| Routing Rule | View routing rules about the service, and can be edited. |
| Incident Creation Rule | View the incident creation rule about the service, and can be edited. |
| Extension | View the extension information about the service, and can be edited. |
| Maintenance History | View adding and deleting histories about the maintenance schedule. |
② In the Routing Rule tab, click [+ Add new rule] to open Routing Rule popup window. If the settings is set to None, Default Routing rules will be used. In addition, the person who creates the service will be assigned as the default responder.
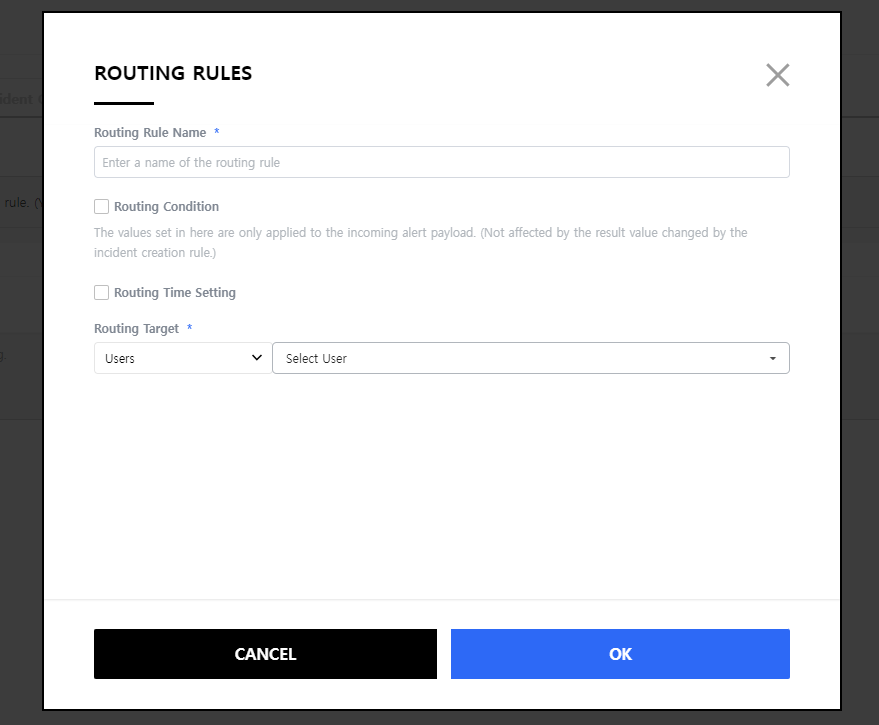
③ Select the [Routing Rule] to set alert conditions to receive notifications. For example, choose Metric Name and Contains as the condition and set CPU as the comparative value, you can receive alerts that match with these conditions.
● Metric Name by Integration
| Integration Name | Metric Name | Note |
|---|---|---|
| Amazon Cloudwatch | trigger.metricName | |
| Azure Alerts | context.condition.metricName | |
| Azure Alerts (Classic) | context.condition.metricName | |
| Datadog | alertMetric | |
| Google Cloud Monitoring | incident.condition_name | |
| Prometheus | None | |
| NewRelic | condition_name | |
| Jennifer5 | metricsName | |
| Grafana | None | |
| Sumo Logic | alertMetric Metric | • For Type Payload, extract metric values from searchQuery fields and use it as the alertMetric value (User must enter a metric value in the query to use it.) • Not used for Log Type Payload. |
| SAMS | ALM_CD_ID | |
| Nagios | alertMetric | • For Service Type Payload, use the serviceDesc field value as the alertMetric value. • For Host Type Payload, use the hostState field value as the alertMetric value. |
| Standard | metric_name | |
| Kapacitor | id | |
| SAMBA | metric_name | |
| Dynatrace | metricNm | • Use metricNm by combining in the form of entityName-ImpactLevel-EventType among the first Index data of problemDetailsJson.rankedEvents. |
| Elasticsearch Watcher | id | • No value to enter as a metric name. |
Create a Service upon Integration
Click [Integration].
![]()
Then, click the [Create Integration] button and select the [Amazon CloudWatch] card.
![]()
![]()
In the Create integration page, enter the required information and then click the [OK] button to create the integration.
![]()
| Item | Description | Note |
|---|---|---|
| Integration Name | Enter a name for the integration. | Required |
| Integration Type | View the integration type that you selected. | Cannot be edited |
| Service | • Create New Service Service is created while creating Integration. |
Required |
| • Select Existing Service The existing Service is mapped while creating Integration. |
No duplicate selection | |
| Service Name | Enter a name for the service that you want to create. | Required |
| Routing Rule | • Default Routing Rule If there are no routing rules created, “Default rule” will be created. |
Required |
| • Add custom criteria The user can select Escalation based on the user-defined priority. The custom criteria will take precedence over the default rule. |
||
| Incident Creation Rule | • Suppression Rule If the conditions like Summary and Metric Name occurred repeatedly, you can add time conditions (Sec, Min, Hour, Day) to suppress repeating alerts. |
Optional |
| • Urgency Settings Set a level of urgency to handling incidents for optimal outcomes. |
Optional | |
| • Delay Creation Rules Set a time and count to delay creating recurring incidents. |
Optional |
- Select the [Create New Service] or [Existing Service], and click the [OK] button.
💡 Service can manage incidents by grouping multiple integrations and designating them as the service.
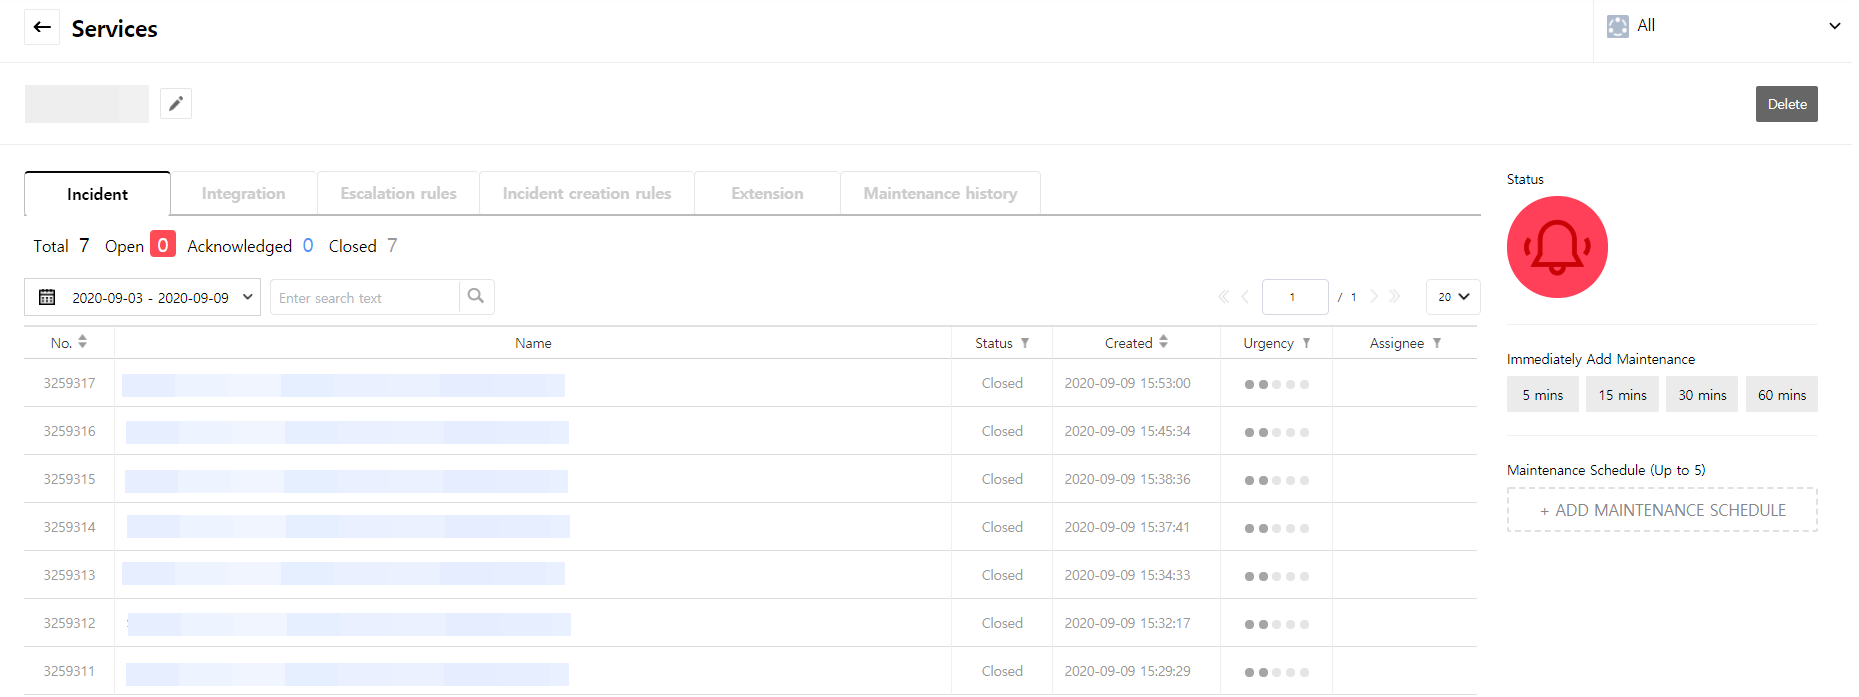
Set maintenance schedule
You can set up maintenance schedules depending on certain cases such as releases, DB, Infra, and Security operations. During the maintenance period, incidents will not be created. Two options are provided below to set up the schedule.
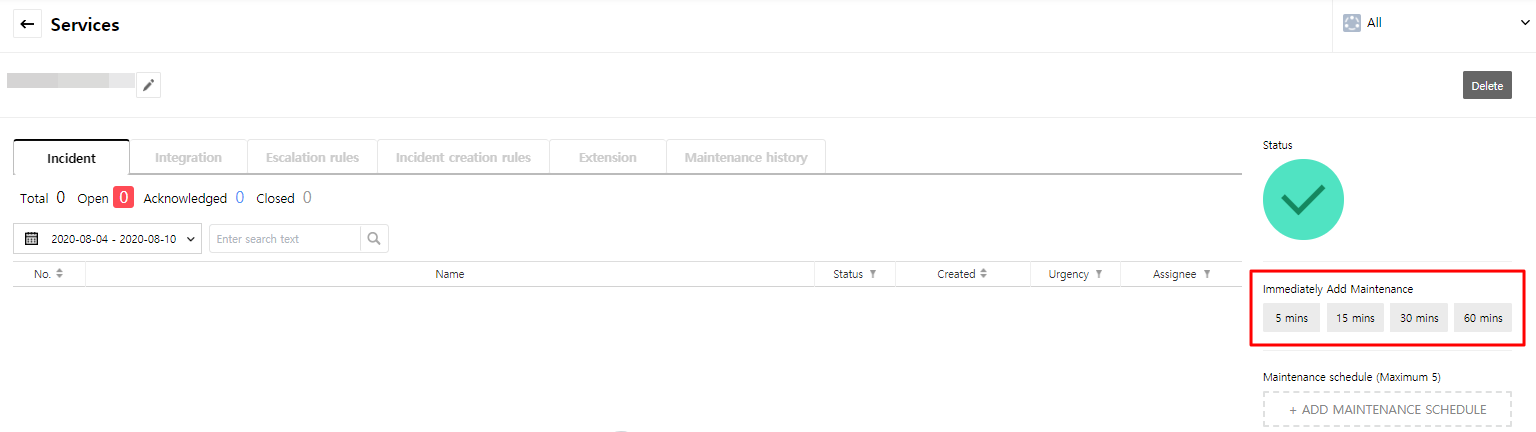
- Immediately Add Maintenance
It allows you to simply add a maintenance schedule immediately. The maintenance schedule will be started immediately by activating this feature.
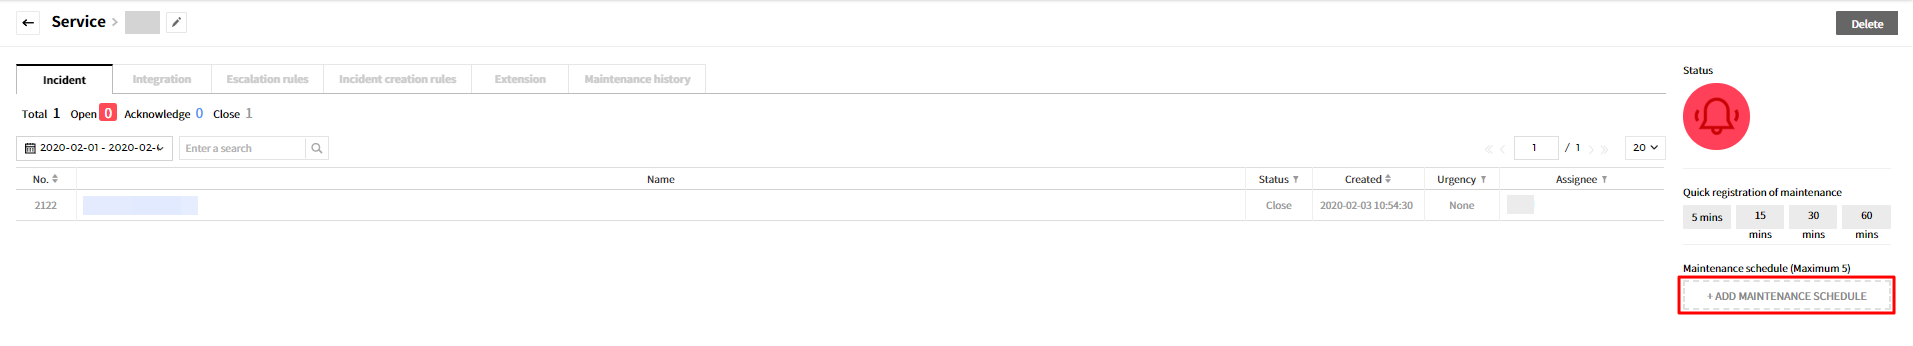
Select the service you want to add the maintenance schedule in the Service menu.
![]()
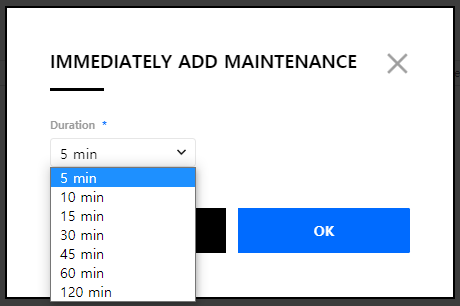
In the Immediately Add Maintenance page, click one of the following: 5 mins, 15 mins, 30 mins, 60 mins.
![]()
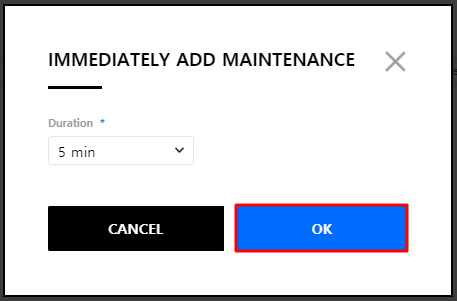
A popup window will be prompted. Use the dropdown menu to change the duration, and available options are 5, 10, 30, 45, 60, and 120 mins.
![]()
Click the [OK] button to immediately add maintenance schedule.
![]()
- Add Maintenance Schedule
It allows you to set a maintenance schedule manually. With this feature, the maintenance schedule will be started at the times you set.
Select the service you want to add a maintenance schedule in the Service menu.
![]()
In the Maintenance schedule, click [+ Add Maintenance Schedule].
![]()
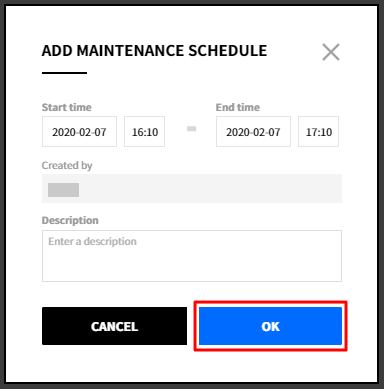
Set the start time and end time, and enter the description if necessary, and click [OK] to add a maintenance schedule.
![]()
You can add up to 5 maintenance schedules for each service.
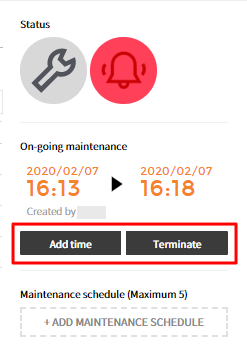
When you add the maintenance schedule, the schedule will be added to the service and you can check the status. Click [Add time] to change the time to close the maintenance in a different time, and click the [Terminate] to close.
![]()
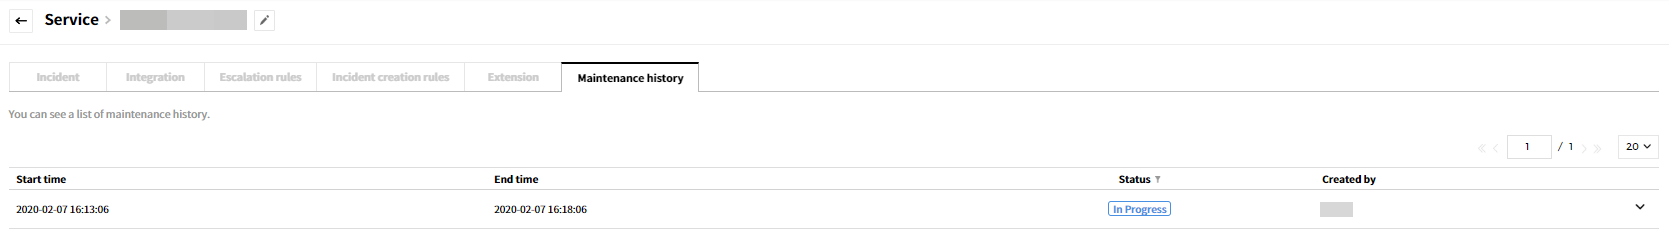
You can find the history of maintenance schedules at the Maintenance history tab.
![]()
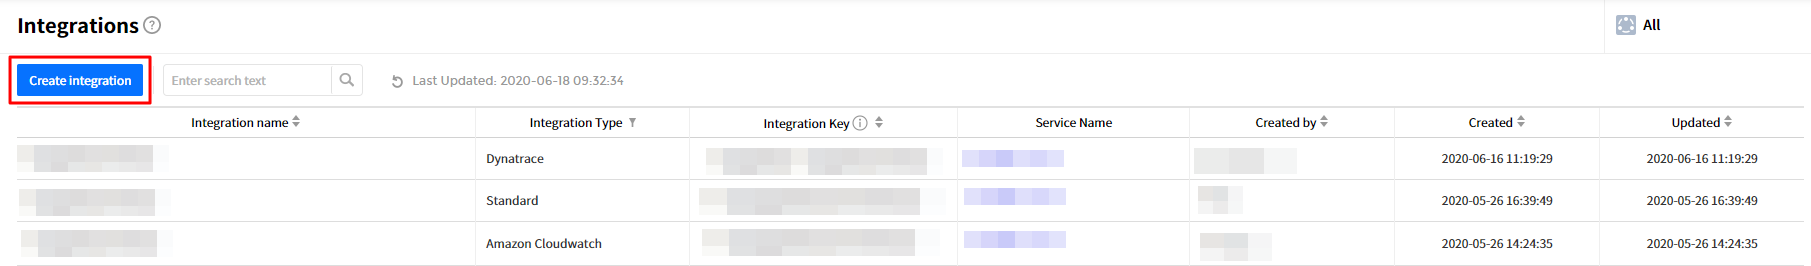
Integrations
You can forward and manage notifications occurring in the tool with AlertNow by selecting the tools or services you are using from the list of integrations provided by AlertNow.
Configure Integrations
Click [Integrations] from the navigation bar.
![]()
Click the [Create Integration] button.
![]()
Select an integration type you want to use.
![]()
Fill out all required fields to create an integration.
![]()
The input items for the Integration settings are shown below.
| Item | Description | Note |
|---|---|---|
| Integration Name | Users can set a name of an Integration. | Required |
| Integration Type | The logo of the selected target is shown. | Cannot enter or edit |
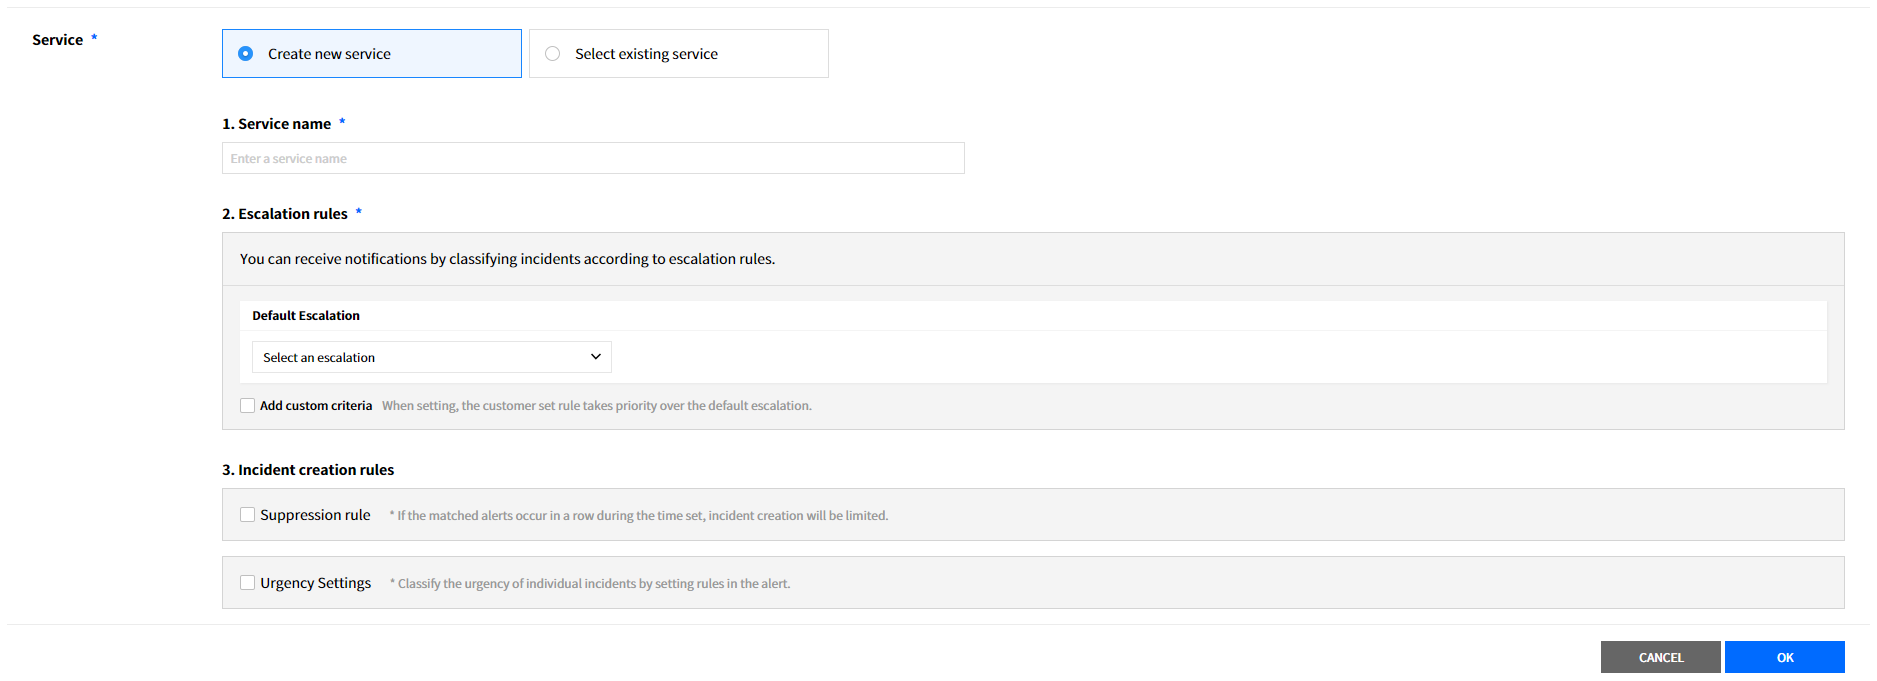
| Service | • Create New Service When creating an integration, a service is also created. |
Required |
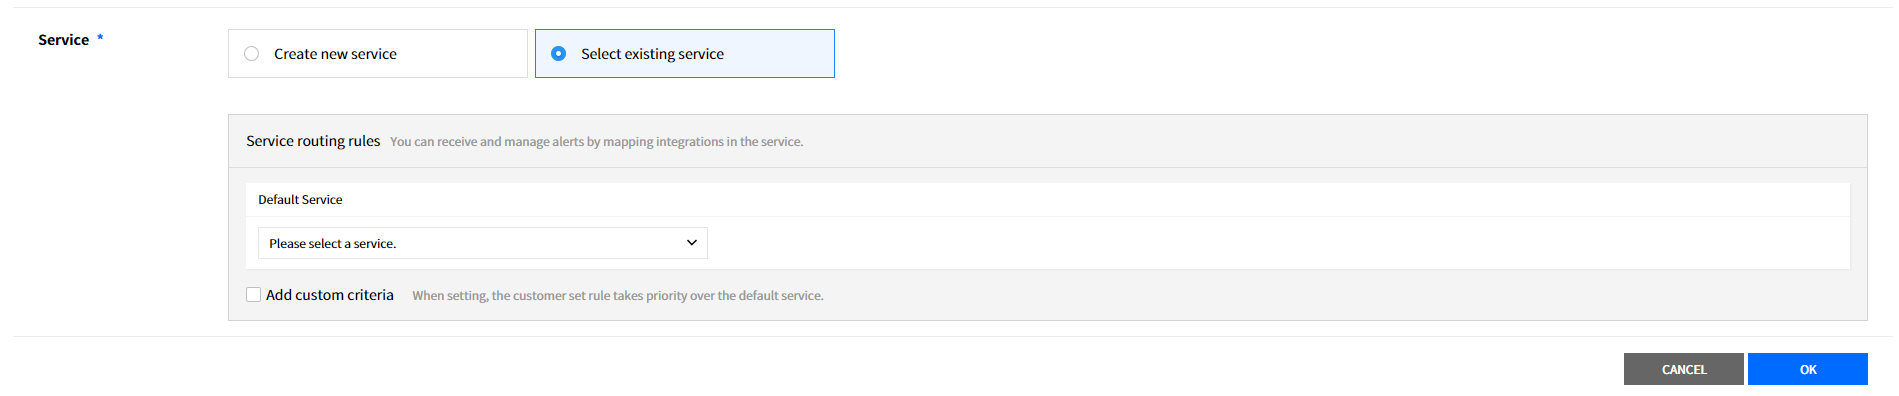
| • Select Existing Service When creating an integration, the existing service is mapped. |
No multiple selection |
- The Create New Service page is shown below.
![]()
| Case | Description | Remark |
|---|---|---|
| Service name | Randomly enter a service name that the customer wants to create. | Required |
| Escalation Rules | • Default escalation rule: If there are no created escalation rules, “Escalation basic rule” is created. • Add custom criteria: The user can determine the priority and select escalation according to the conditions. If selected, the rule of the condition set by the user takes precedence over the default rule. |
Required |
| Incident creation rules | • Suppression Rule If the condition items (Alert Summary, Alert Metric Name) occur consecutively, you can set the period (seconds, minutes, hours, or days) to prevent the creation of duplicate incidents. |
Optional |
| • Urgency Settings You can set the urgency of Incident. |
Optional |
- Select Existing Service page is shown below.
![]()
| Case | Description | Remark |
|---|---|---|
| Service routing rules | Select basic routing rules for the service. | Required |
| Set the service routing rules by choosing conditions like Summary and Metric Name in the Add custom criteria. | Optional |
Click the [OK] button at the bottom right to complete the addition.
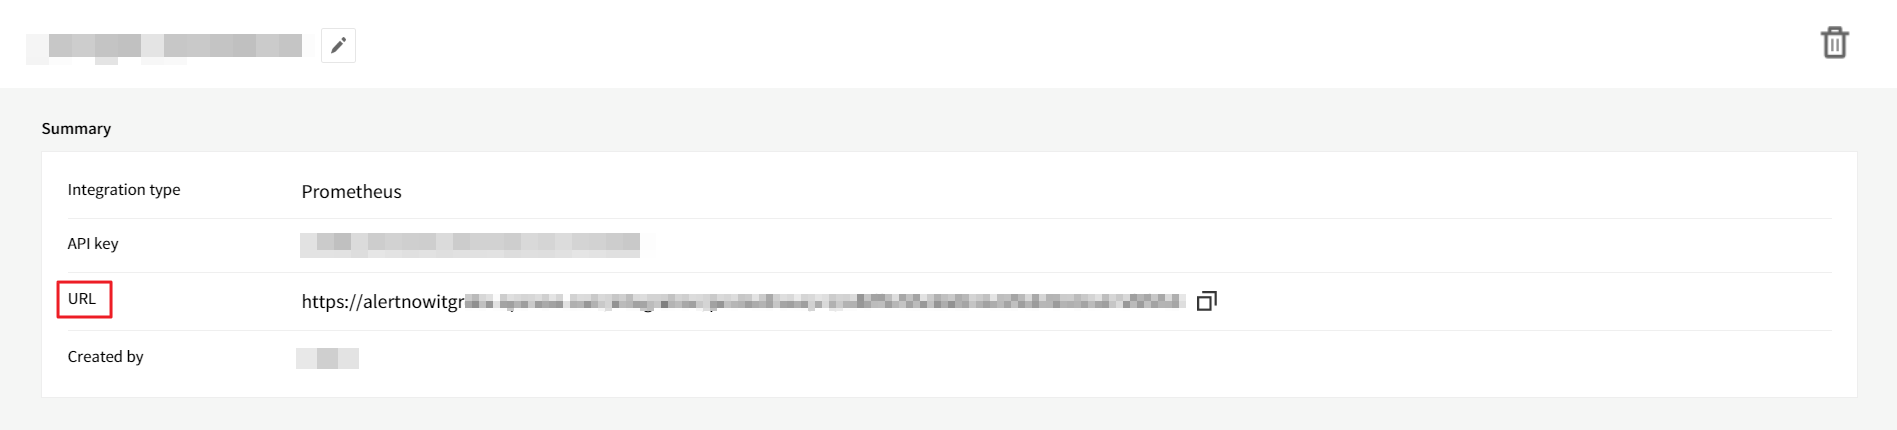
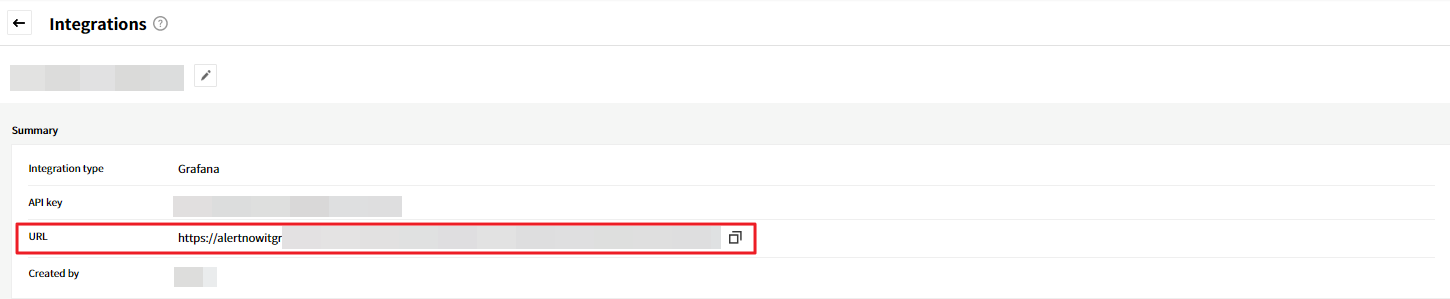
Click the created integration to check the details. The URL refers to SNS Webhook URL information to connect with AlertNow in Amazon SNS on the AWS Console.
![]()
If you create an integration in AlertNow and complete the required settings in each cloud service console accordingly, you will receive notifications when incidents occur.
Amazon CloudWatch
To connect AWS CloudWatch with AlertNow, you need to create an SNS topic in the AWS Console.
Click the [Create Integration] button located on the top-left side, and select the [Amazon CloudWatch] card.
![]()
In the Create Integration page, enter the required information and then click the [OK] button.
![]()
Access AWS Console
From the AWS Console, type SNS, and then select Simple Notification Service.
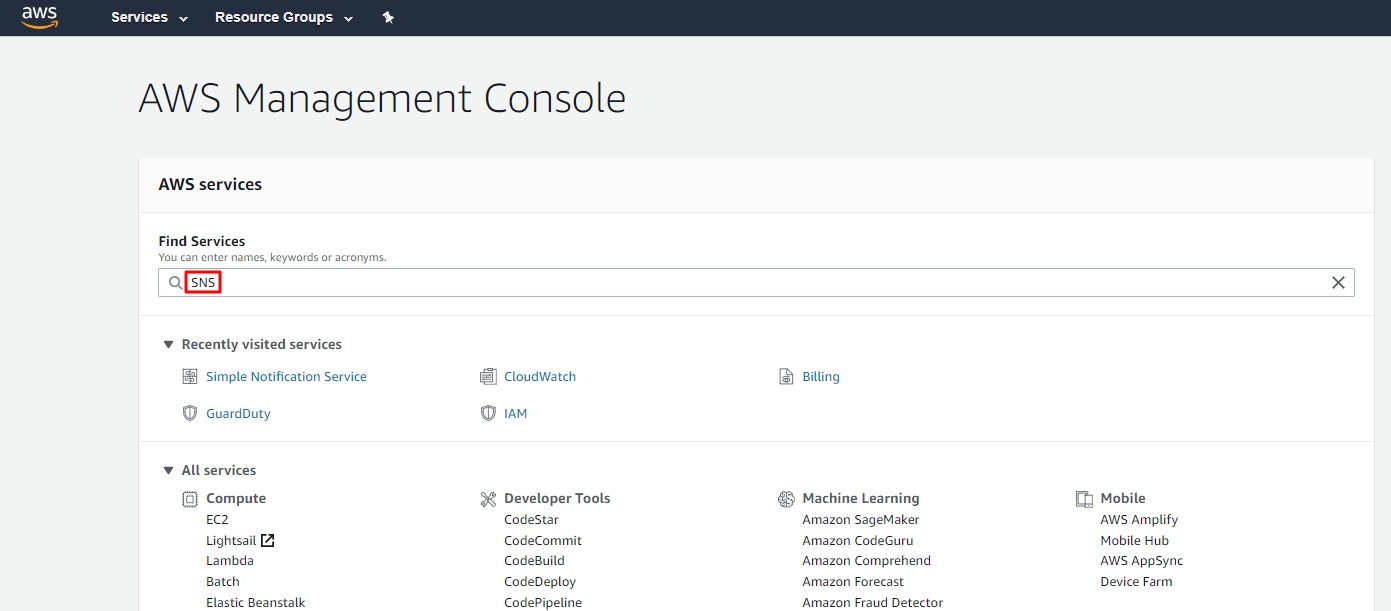
Create Amazon SNS and Subscription
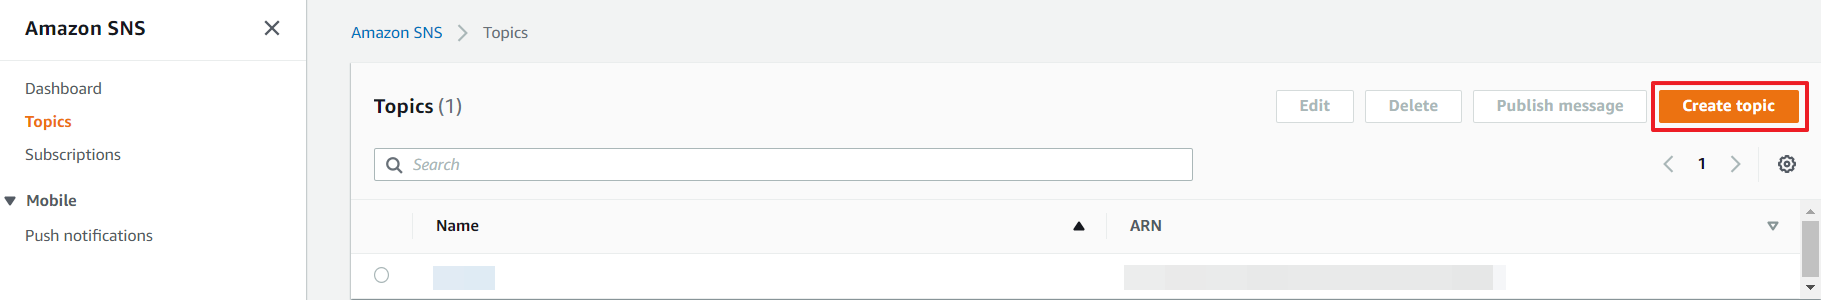
Select the [Topics] in the Amazon SNS dashboard.
⑴ Create New Topic
Select [Create topic] located on the top-right of the page. The Create topic page will be appeared.
The table below provides descriptions for each item.
| Item | Description | Remark |
|---|---|---|
| Topic Name | It is a communication channel to send messages and subscribe notifications and used to create an ARN for later created Topics. Maximum 256 characters. Can include alphanumeric characters, hyphens (-) and underscores (_). |
Required |
| - For example, CreateSNSTopicTest: ‘arn:aws:sns:us-west-2:111122223333:CreateSNSTopicTest’ | ||
| Display Name | It is the name displayed for your topic when subscribing to SNS. | Optional |
Click the [Create topic] button.
⑵ Create Subscription
Select the [Create subscription] located on the top-right of the page.
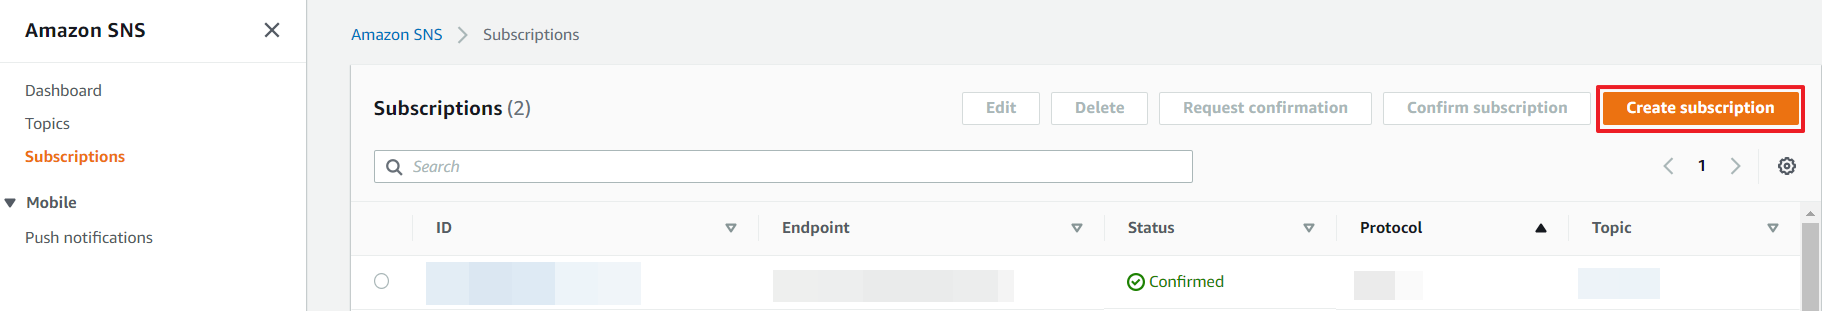
Fill in the required input fields and click the [Create Subscription] button.
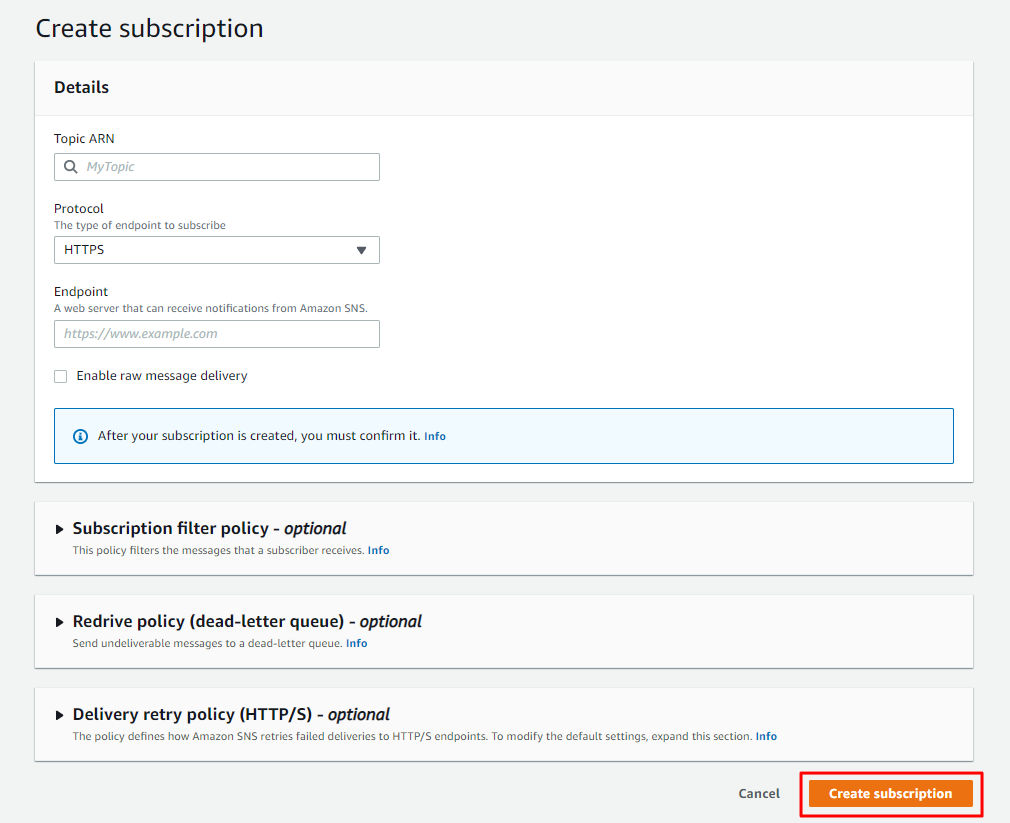
The table below provides descriptions for each item.
| Item | Description | Remark |
|---|---|---|
| Topic ARN | The name of Topic ARN is automatically reflected based on your Topic Name. | Can be edited |
| Protocol | Choose HTTPS for your topic to receive messages. | |
| Endpoint | Copy and paste the URL from AlertNow. | Can be edited |
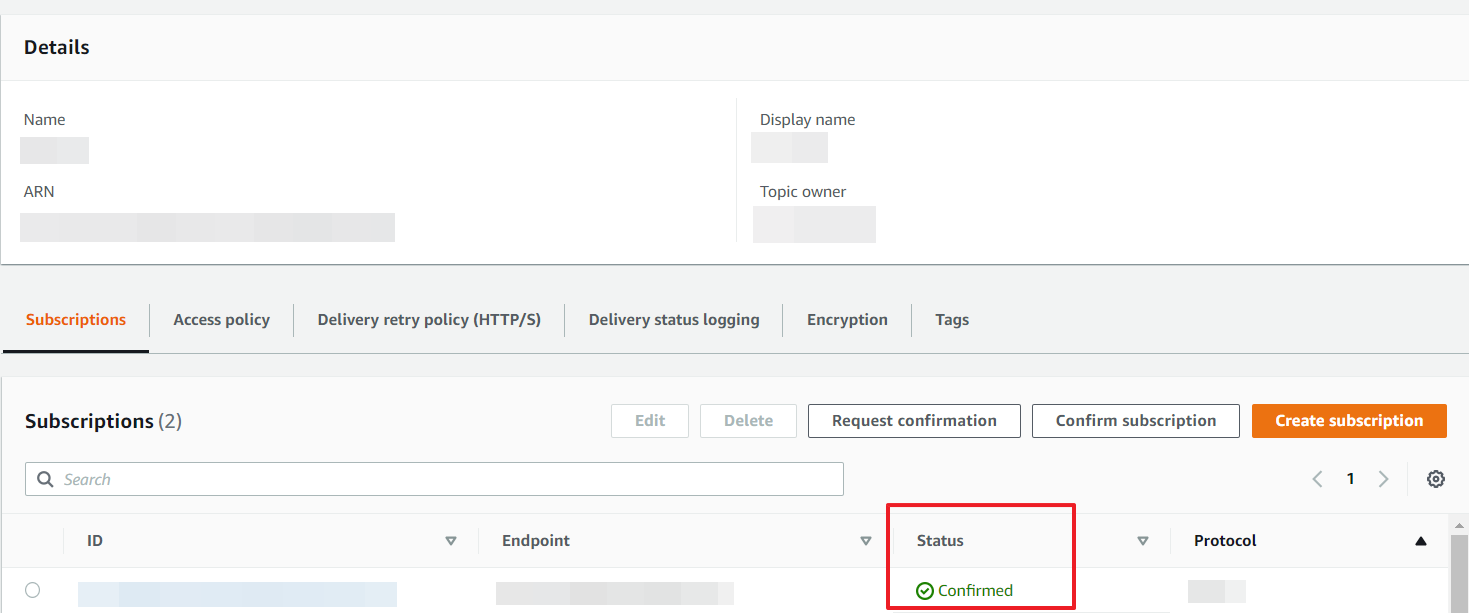
⑶ Confirm Subscription
The subscription is being created.
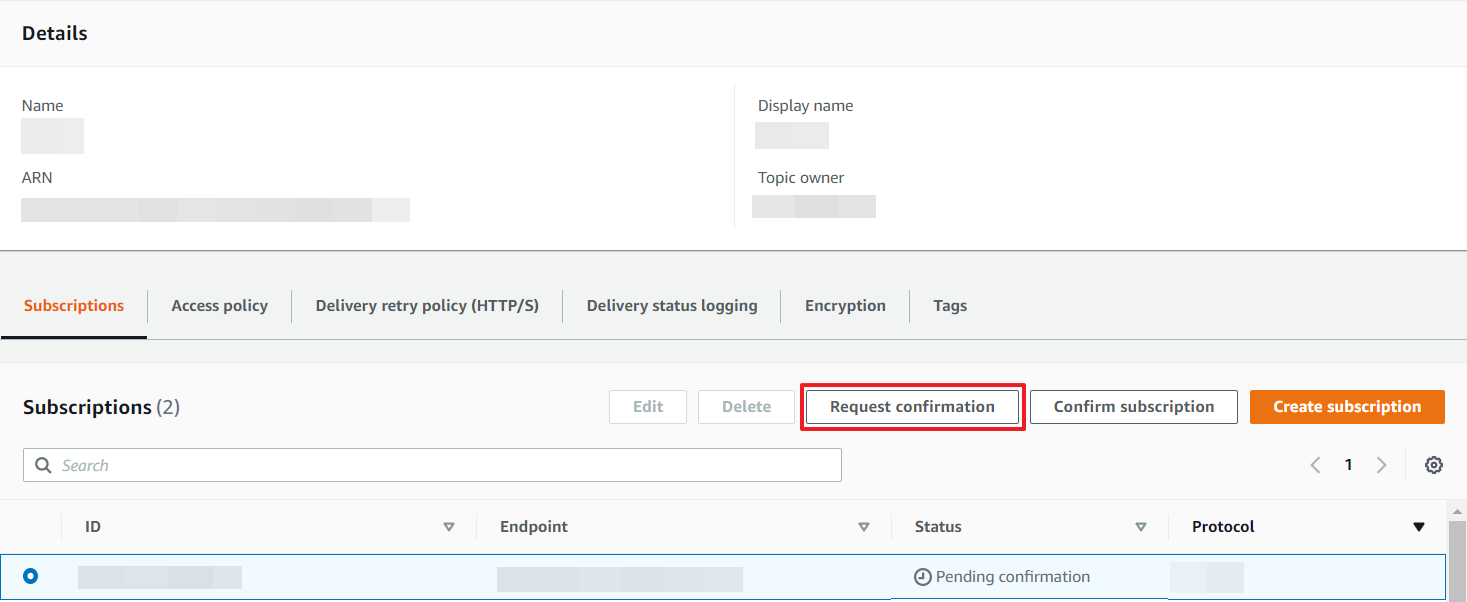
Click the [Request confirmation] button on at the upper right. Approval confirmation is made for the Subscription ID.
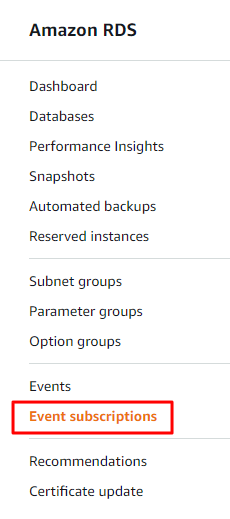
Move to RDS Console
① In the AWS console, enter RDS in the search field to go to Amazon RDS Console.
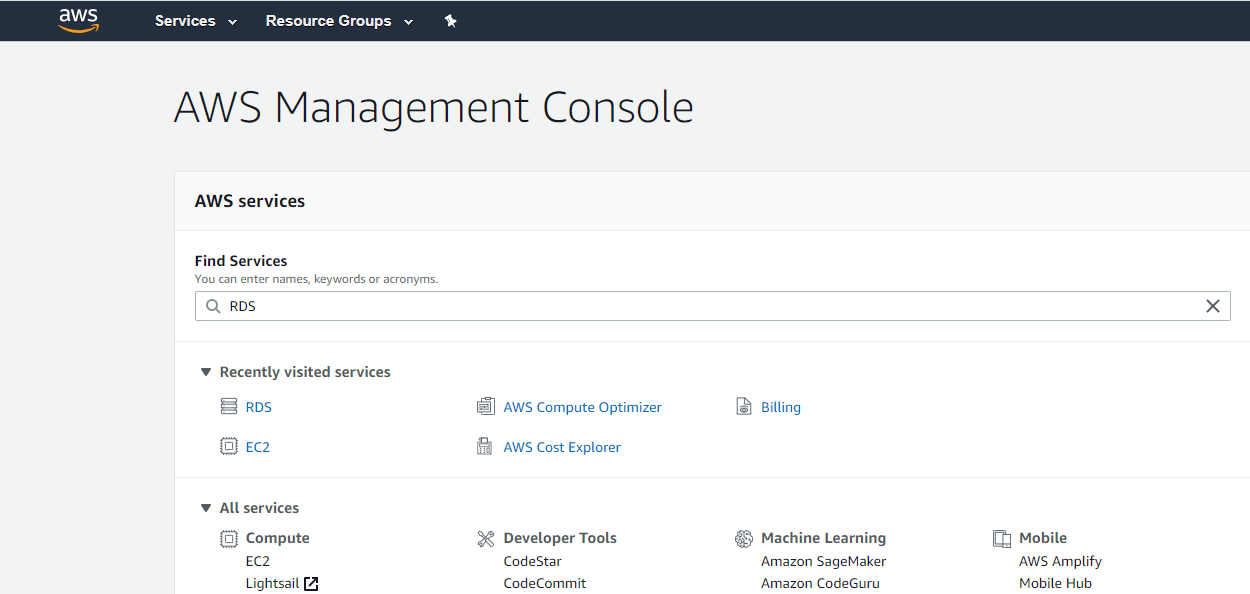
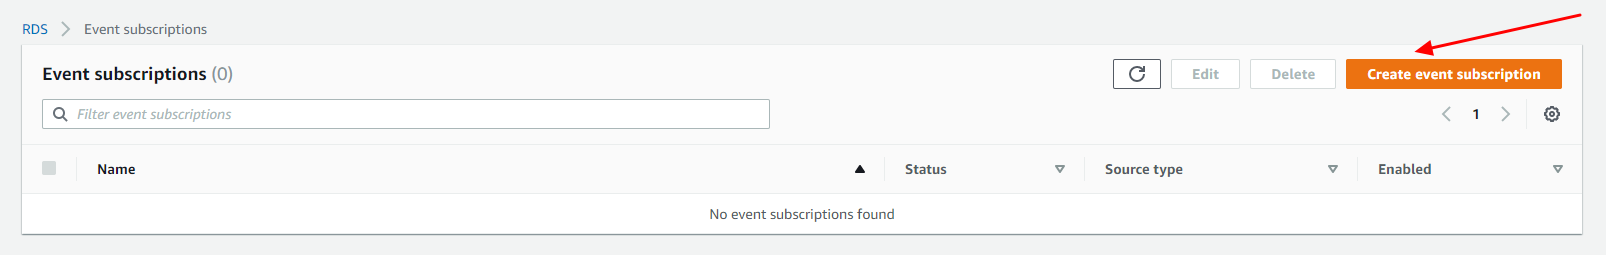
② Select the [Event subscriptions] at the left side of the page.
③ In the Event subscriptions pane, select the [Create event subscription].
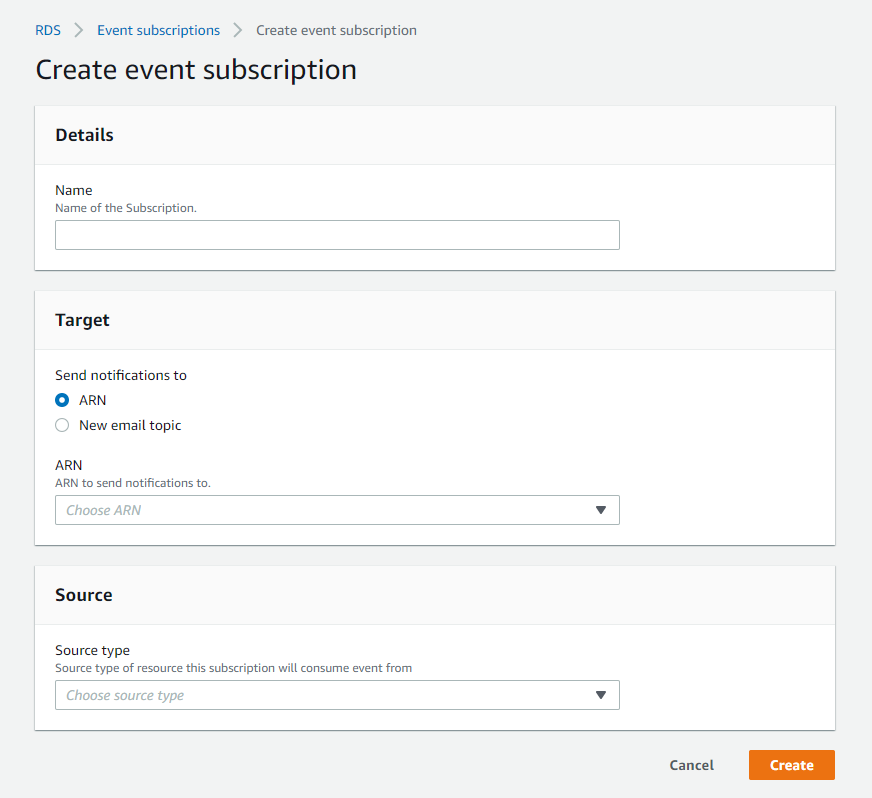
④ In the Create event subscription page, enter a name for the event notification subscription. For Send notifications to, select an existing SNS ARN for a SNS topic, or select New email topic to enter a topic name and a recipient. Depending on the source type you selected, choose the event categories and sources that you want to receive event notifications for.
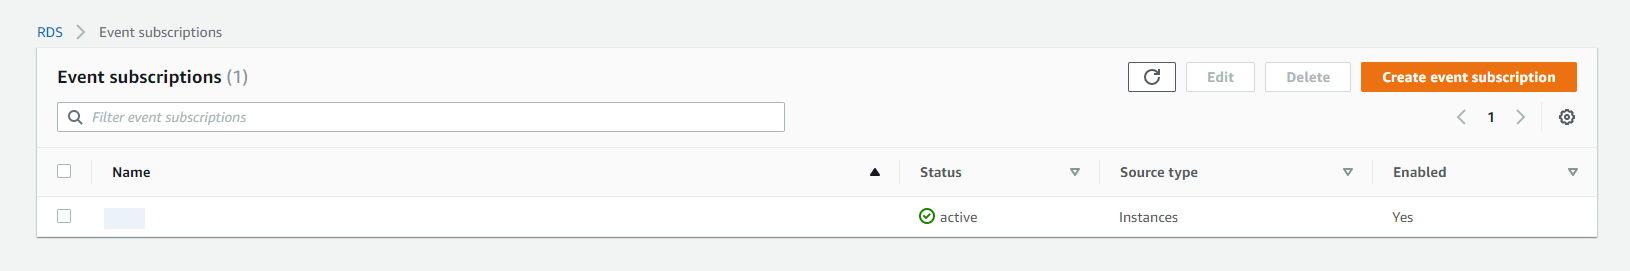
⑤ Select the [Create]. Then, you can find that the subscription has been created.
Move to EC2 Console
Go to the EC2 Console to create alerts for connecting to the AlertNow.
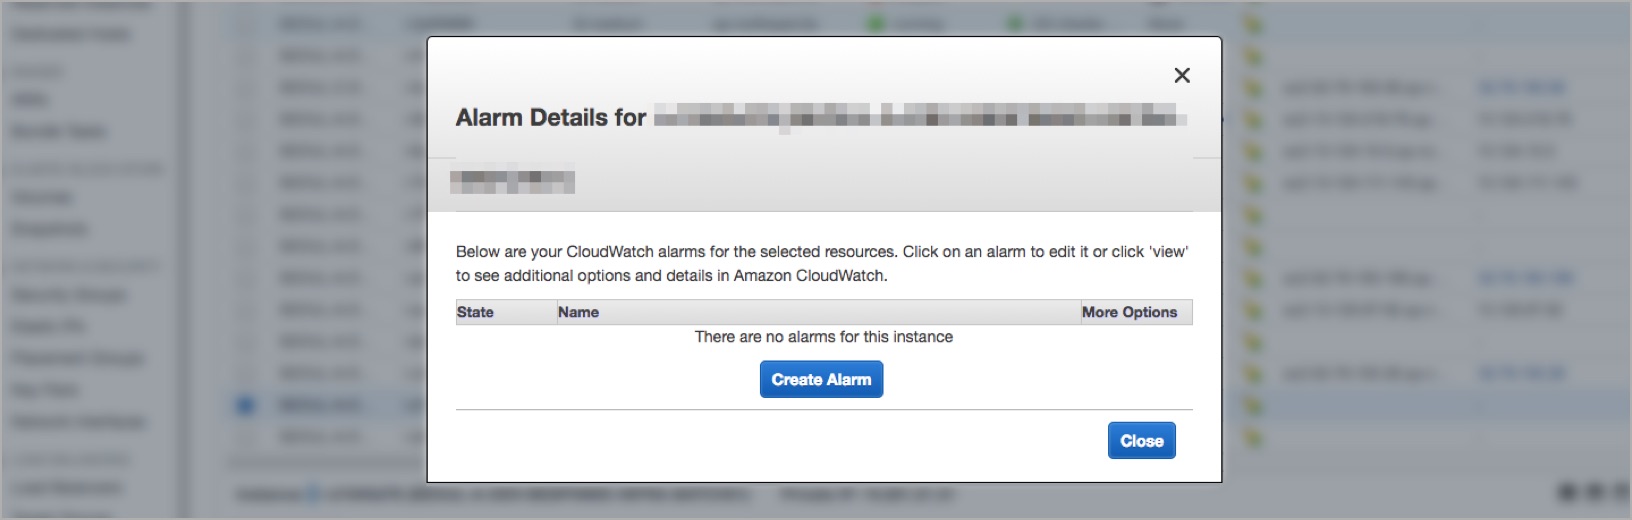
① Chooho the EC2 and select Action > CloudWatch Monitoring > Add/Edit Alarms in sequential order.
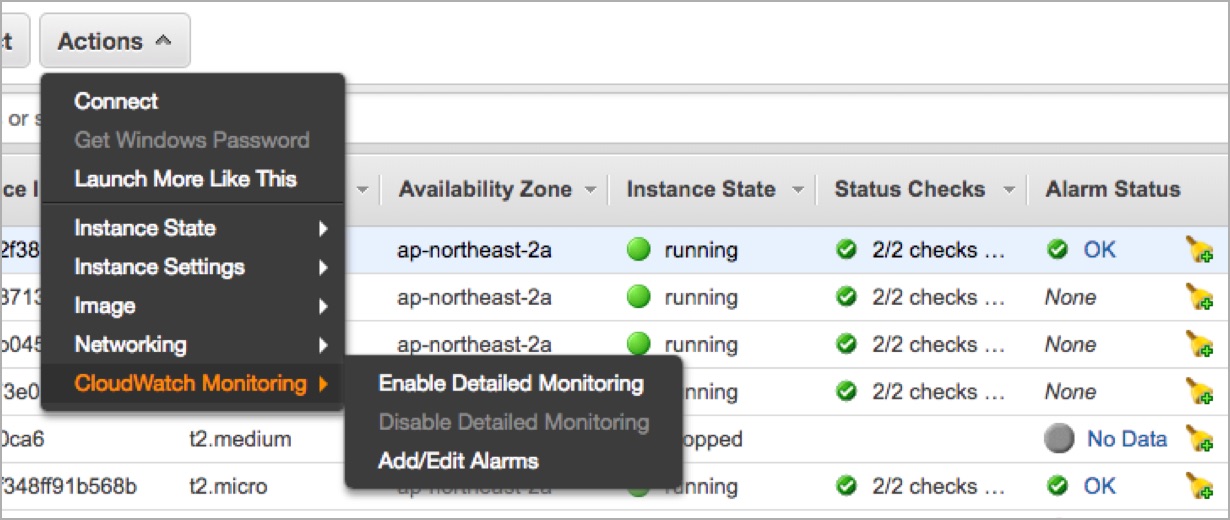
② Click the [Create Alarm] button.
The input items are shown below
![][integration_ec2_03]| Item | Description | Remark |
|---|---|---|
| Send a notification to | Find and select the created topic. | Optional |
| Whenever | Set the threshold value. | Required |
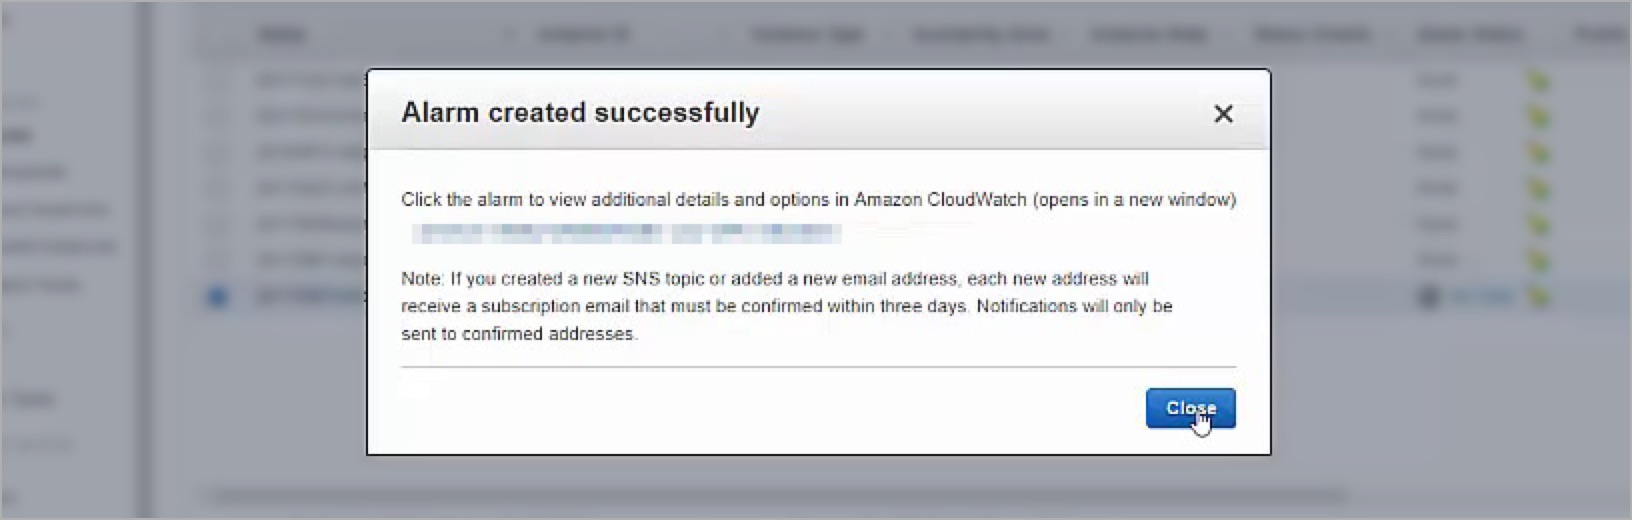
③ If you press the [Save] button, the following message will be shown.
Add Return to Normal Notification
⑴ Receiving Return to Normal Notification
If incidents are created based on the threshold settings and the instance status is changed back to normal, the incidents are automatically closed.
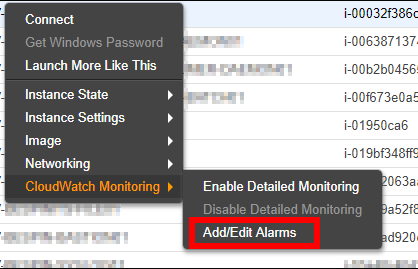
① Chooho the EC2 and select Action > CloudWatch Monitoring > Add/Edit Alarms in sequential order.
② Click [View] for alerts to set Return to Normal Notifications.
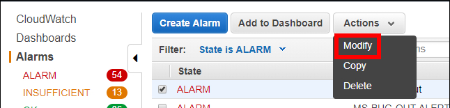
③ Click [Actions] and then [Modify] button.
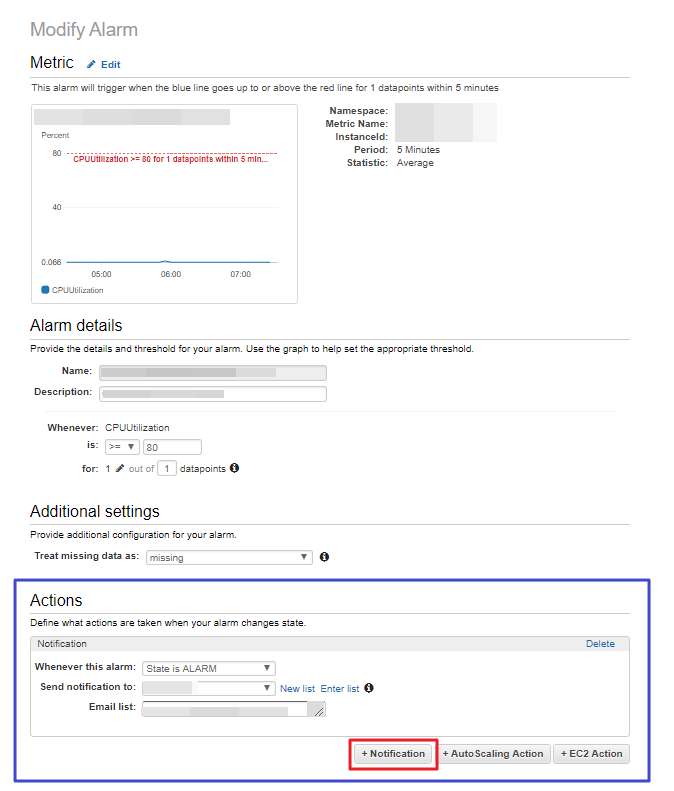
④ Click [+Notifications] under the Actions of Edit Alert page.
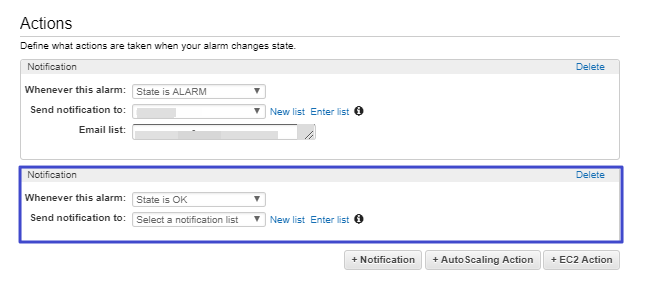
⑤ After adding notifications, set the condition to State is OK and save the changes.
⑥ Review the changed settings.
Microsoft Azure
To connect Azure Alert with AlertNow, you need to create the metric alert in the Azure Portal.
Click the [Create Integration] button located on the top-left side, and select the [Azure Alerts] or [Azure Alerts (Classic)] card for your needs.
![]()
![]()
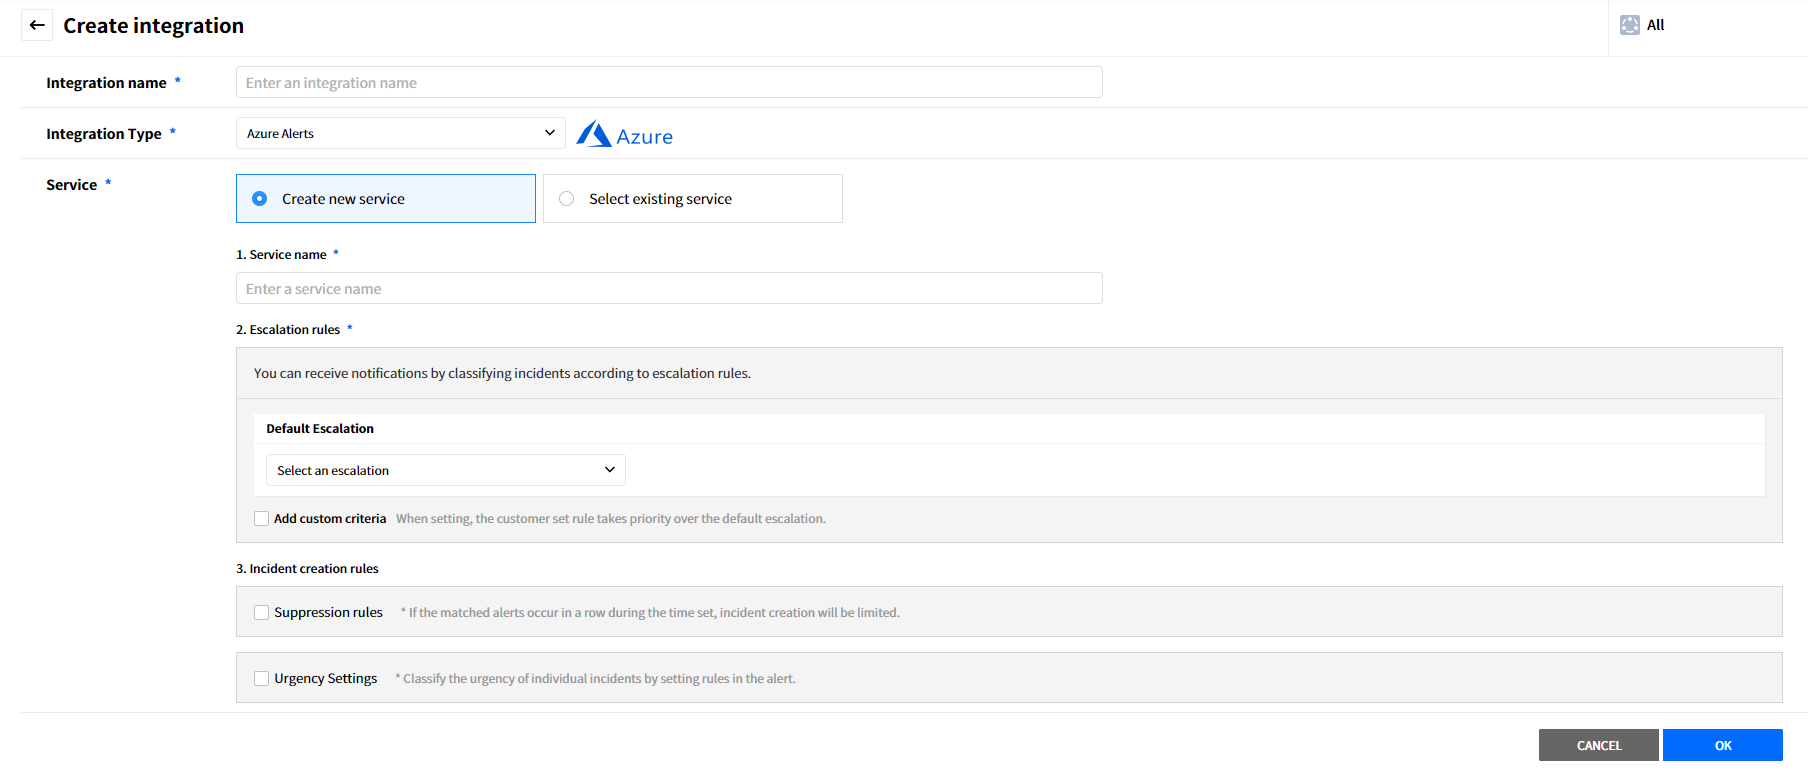
In the [Create integration] page, enter the required information and then click the [OK] button to create the integration.
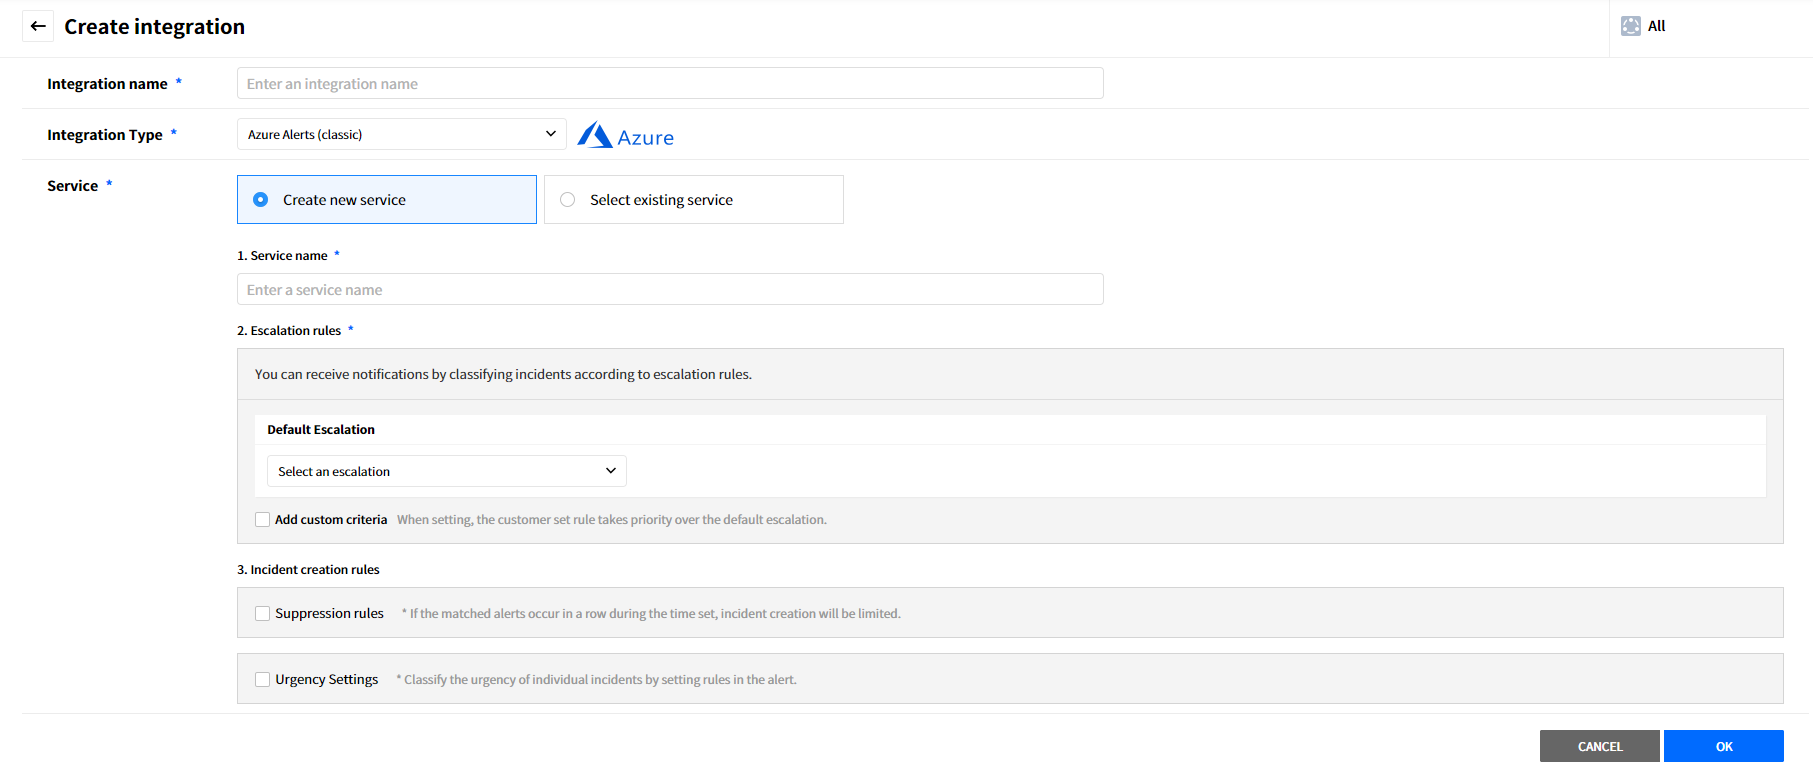
Adding Metric alert in Alert (Classic)
① Go to Azure Portal. After logging in, click Monitor > Alert (Classic) as below.
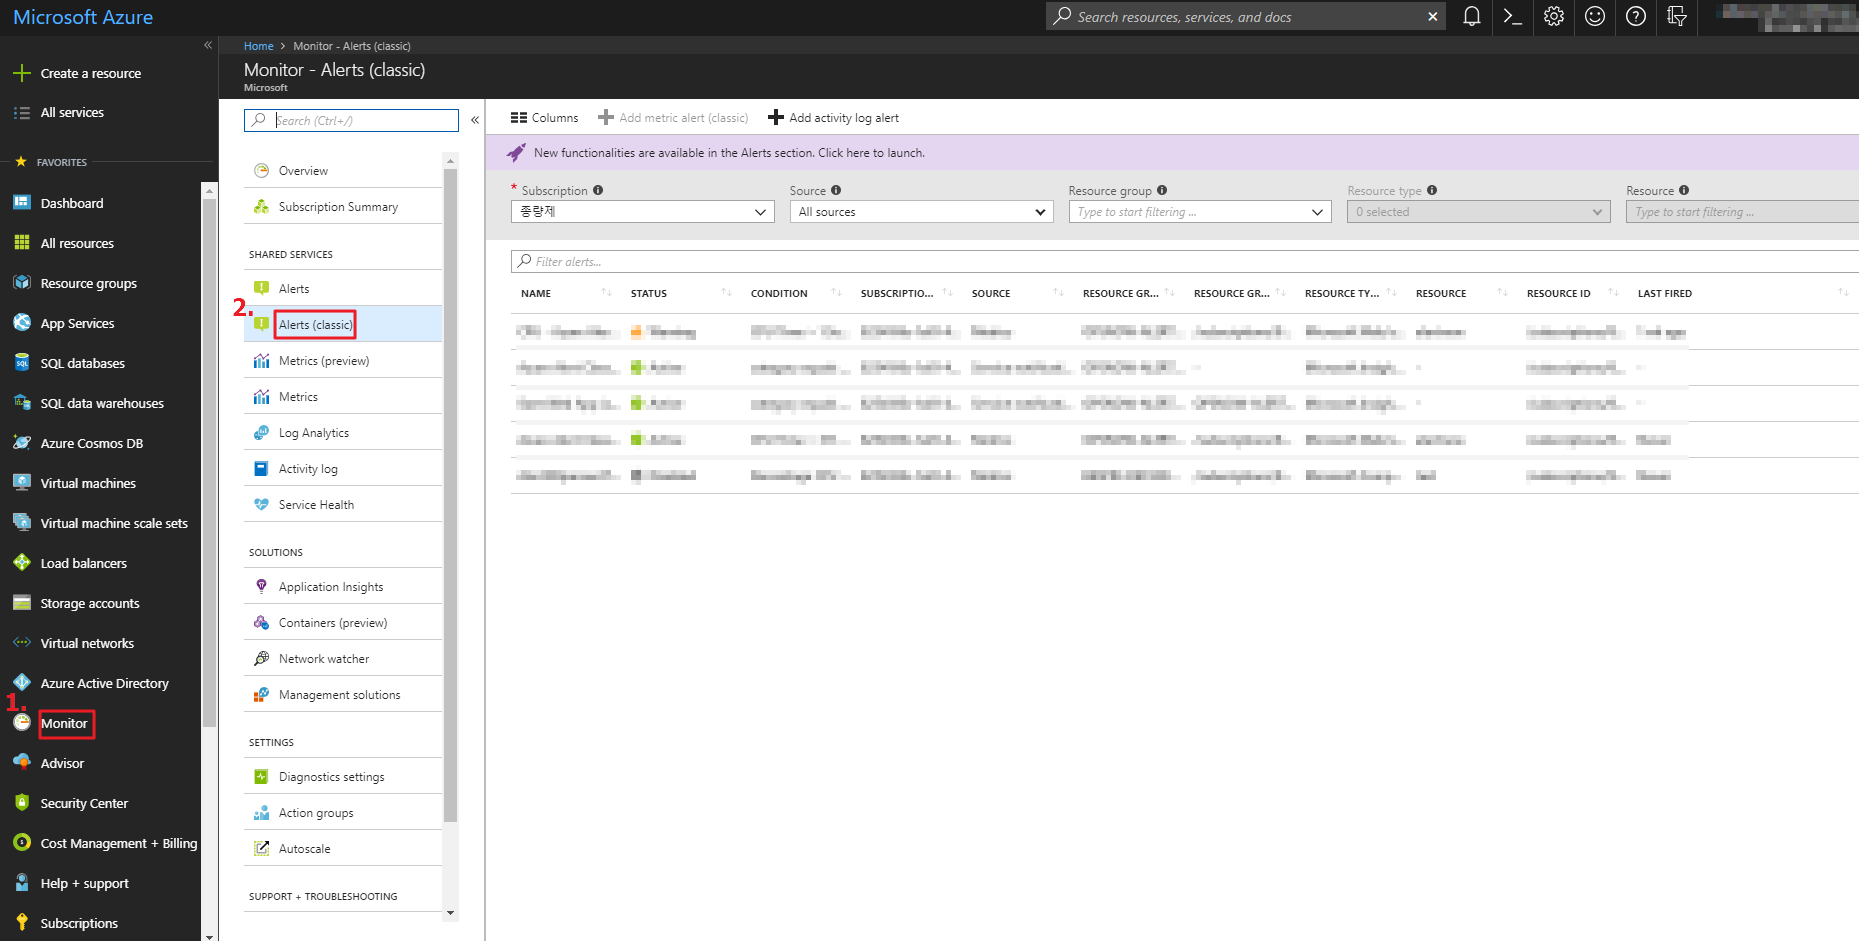
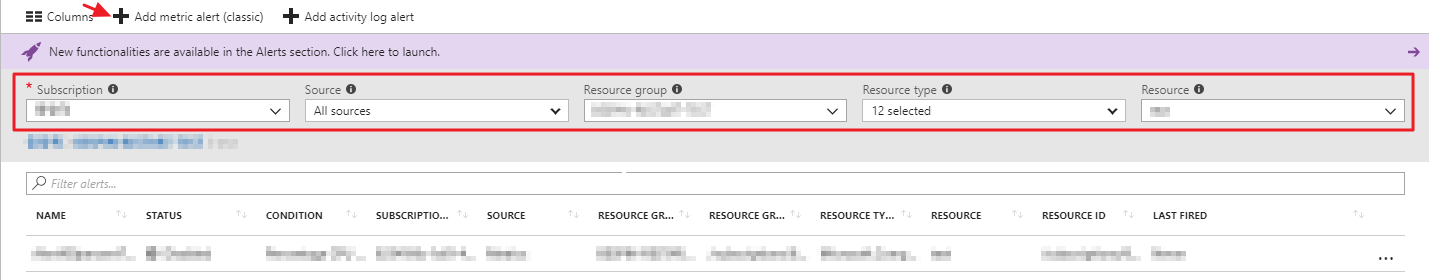
② Set Subscription, Source, Resource group, Resource type, and Resource. Then, click [+ Add metric alert (classic)].
③ Check the required input fields and click [OK] to create the metric alert.
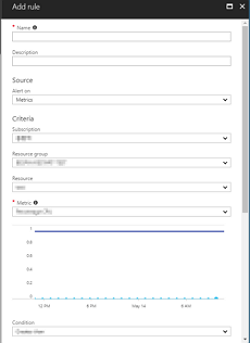
| Item | Description | Remark |
|---|---|---|
| Name | Enter the name. | Required |
| Description | Enter the description about a rule. | Optional |
| Source | Alert on: It is set to “Metrics” as default. | |
| Criteria | Subscription: The subscription set in the previous step is automatically selected. Resource group: The resource group set in the previous step is automatically selected. Resource: The resource set in the previous step is automatically selected. Metric: Select a metric. Condition: Set a condition about a rule. Threshold: Set a threshold about a rule. Period: Select the metric that you want this alert rule to monitor. |
Required |
| Notify via | Email owners, contributors, and readers: Select the checkbox if you want to send notifications via email. Additional administrator email(s): Enter the email address to send notifications. Webhook: Paste the Webhook URL information copied from Integration |
Required for Webhook |
For Microsoft Azure, Receiving Return to Normal Notification is enabled automatically, so no additional setting is needed.
Adding Alert rule in Alert
In Azure Portal, you can also connect Azure Alert with AlertNow by adding alert rules.
① Sign in to Azure Portal and click Monitor > Alert as below.
② Click [+ New Alert Rule] after setting Subscription, Resource group, and Time range.
③ Then, click Define action group > + New action group in the Add Alert page.
④ Set the action type as Webhook in the Add action group page, and enter the copied Webhook URL from Alertnow in the the URI field. Then, click the [OK] button to create alert rules.
| Item | Description | Remark |
|---|---|---|
| Action group name | Enter the Azure Resource name. | Required |
| Short name | Enter the short name included in email and SNS notifications. | Required |
| Subscription | Select the subscription in which the group will be saved. | Required |
| Resource group | Select the resource group the group will be associated with. | Required |
For Microsoft Azure, additional settings are not required because receiving Return to Normal Notification is enabled automatically.
CA UIM
💡 Depending on your country or region, this feature may not be available.
If you want to create CA UIM integration, you need to additionally set monitoring groups.
Click the [Create integration] button. Then, select the [CA UIM] card.
![]()
Enter an integration name.
![]()
After entering the monitoring group name, click monitoring groups to add. The groups will be added to Linked Monitoring Groups. If you click the [X] button next to the group name, that group will be deleted from the list.
![]()
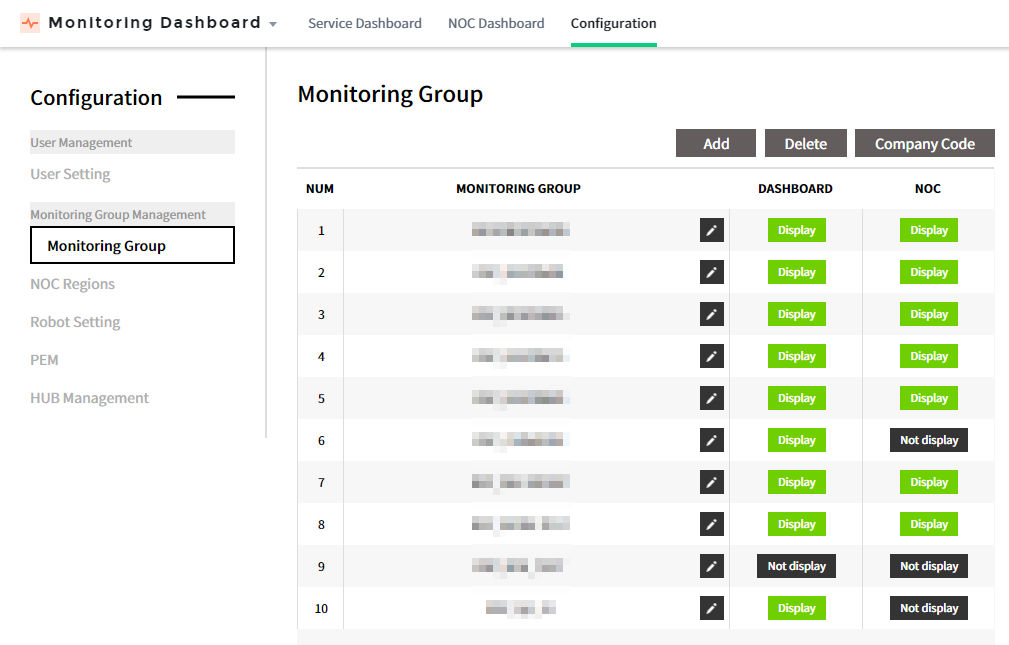
You can either add or delete only the monitoring groups added in the Monitoring Dashboard > Configuration > Monitoring Group list.
![]()
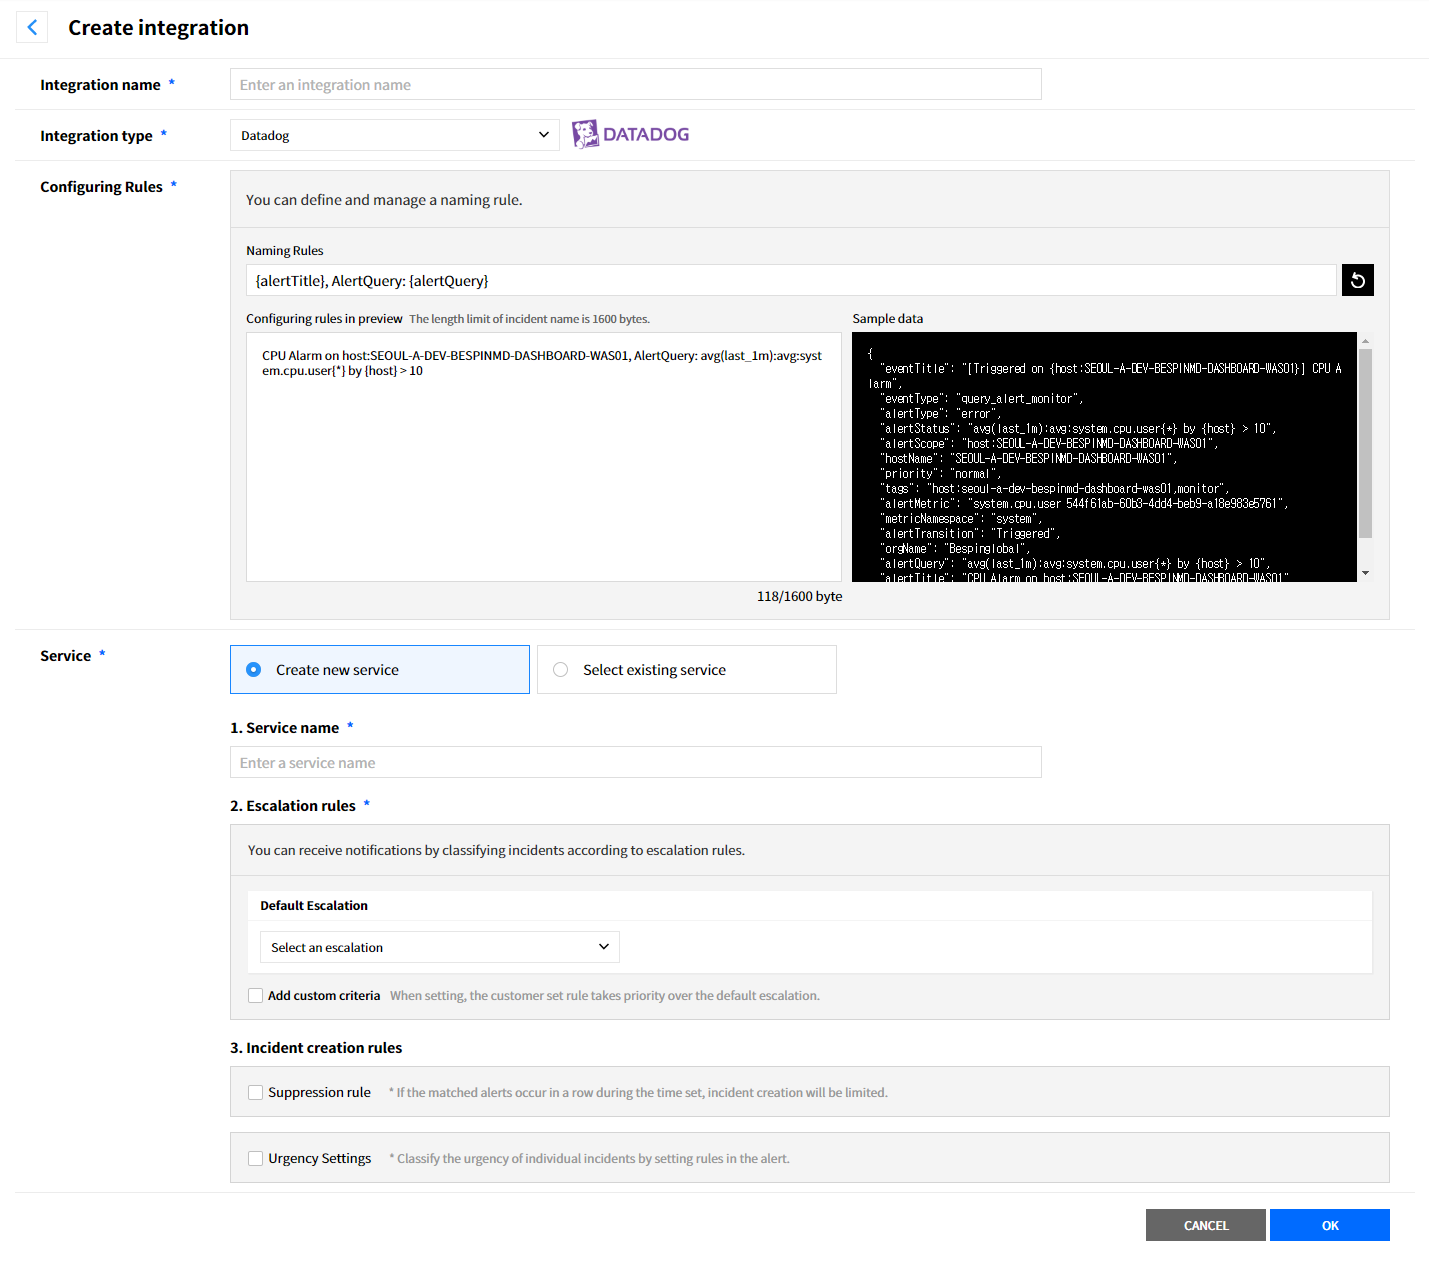
Datadog
To connect Datadog with AlertNow, you must create a webhook and add a monitor in Datadog.
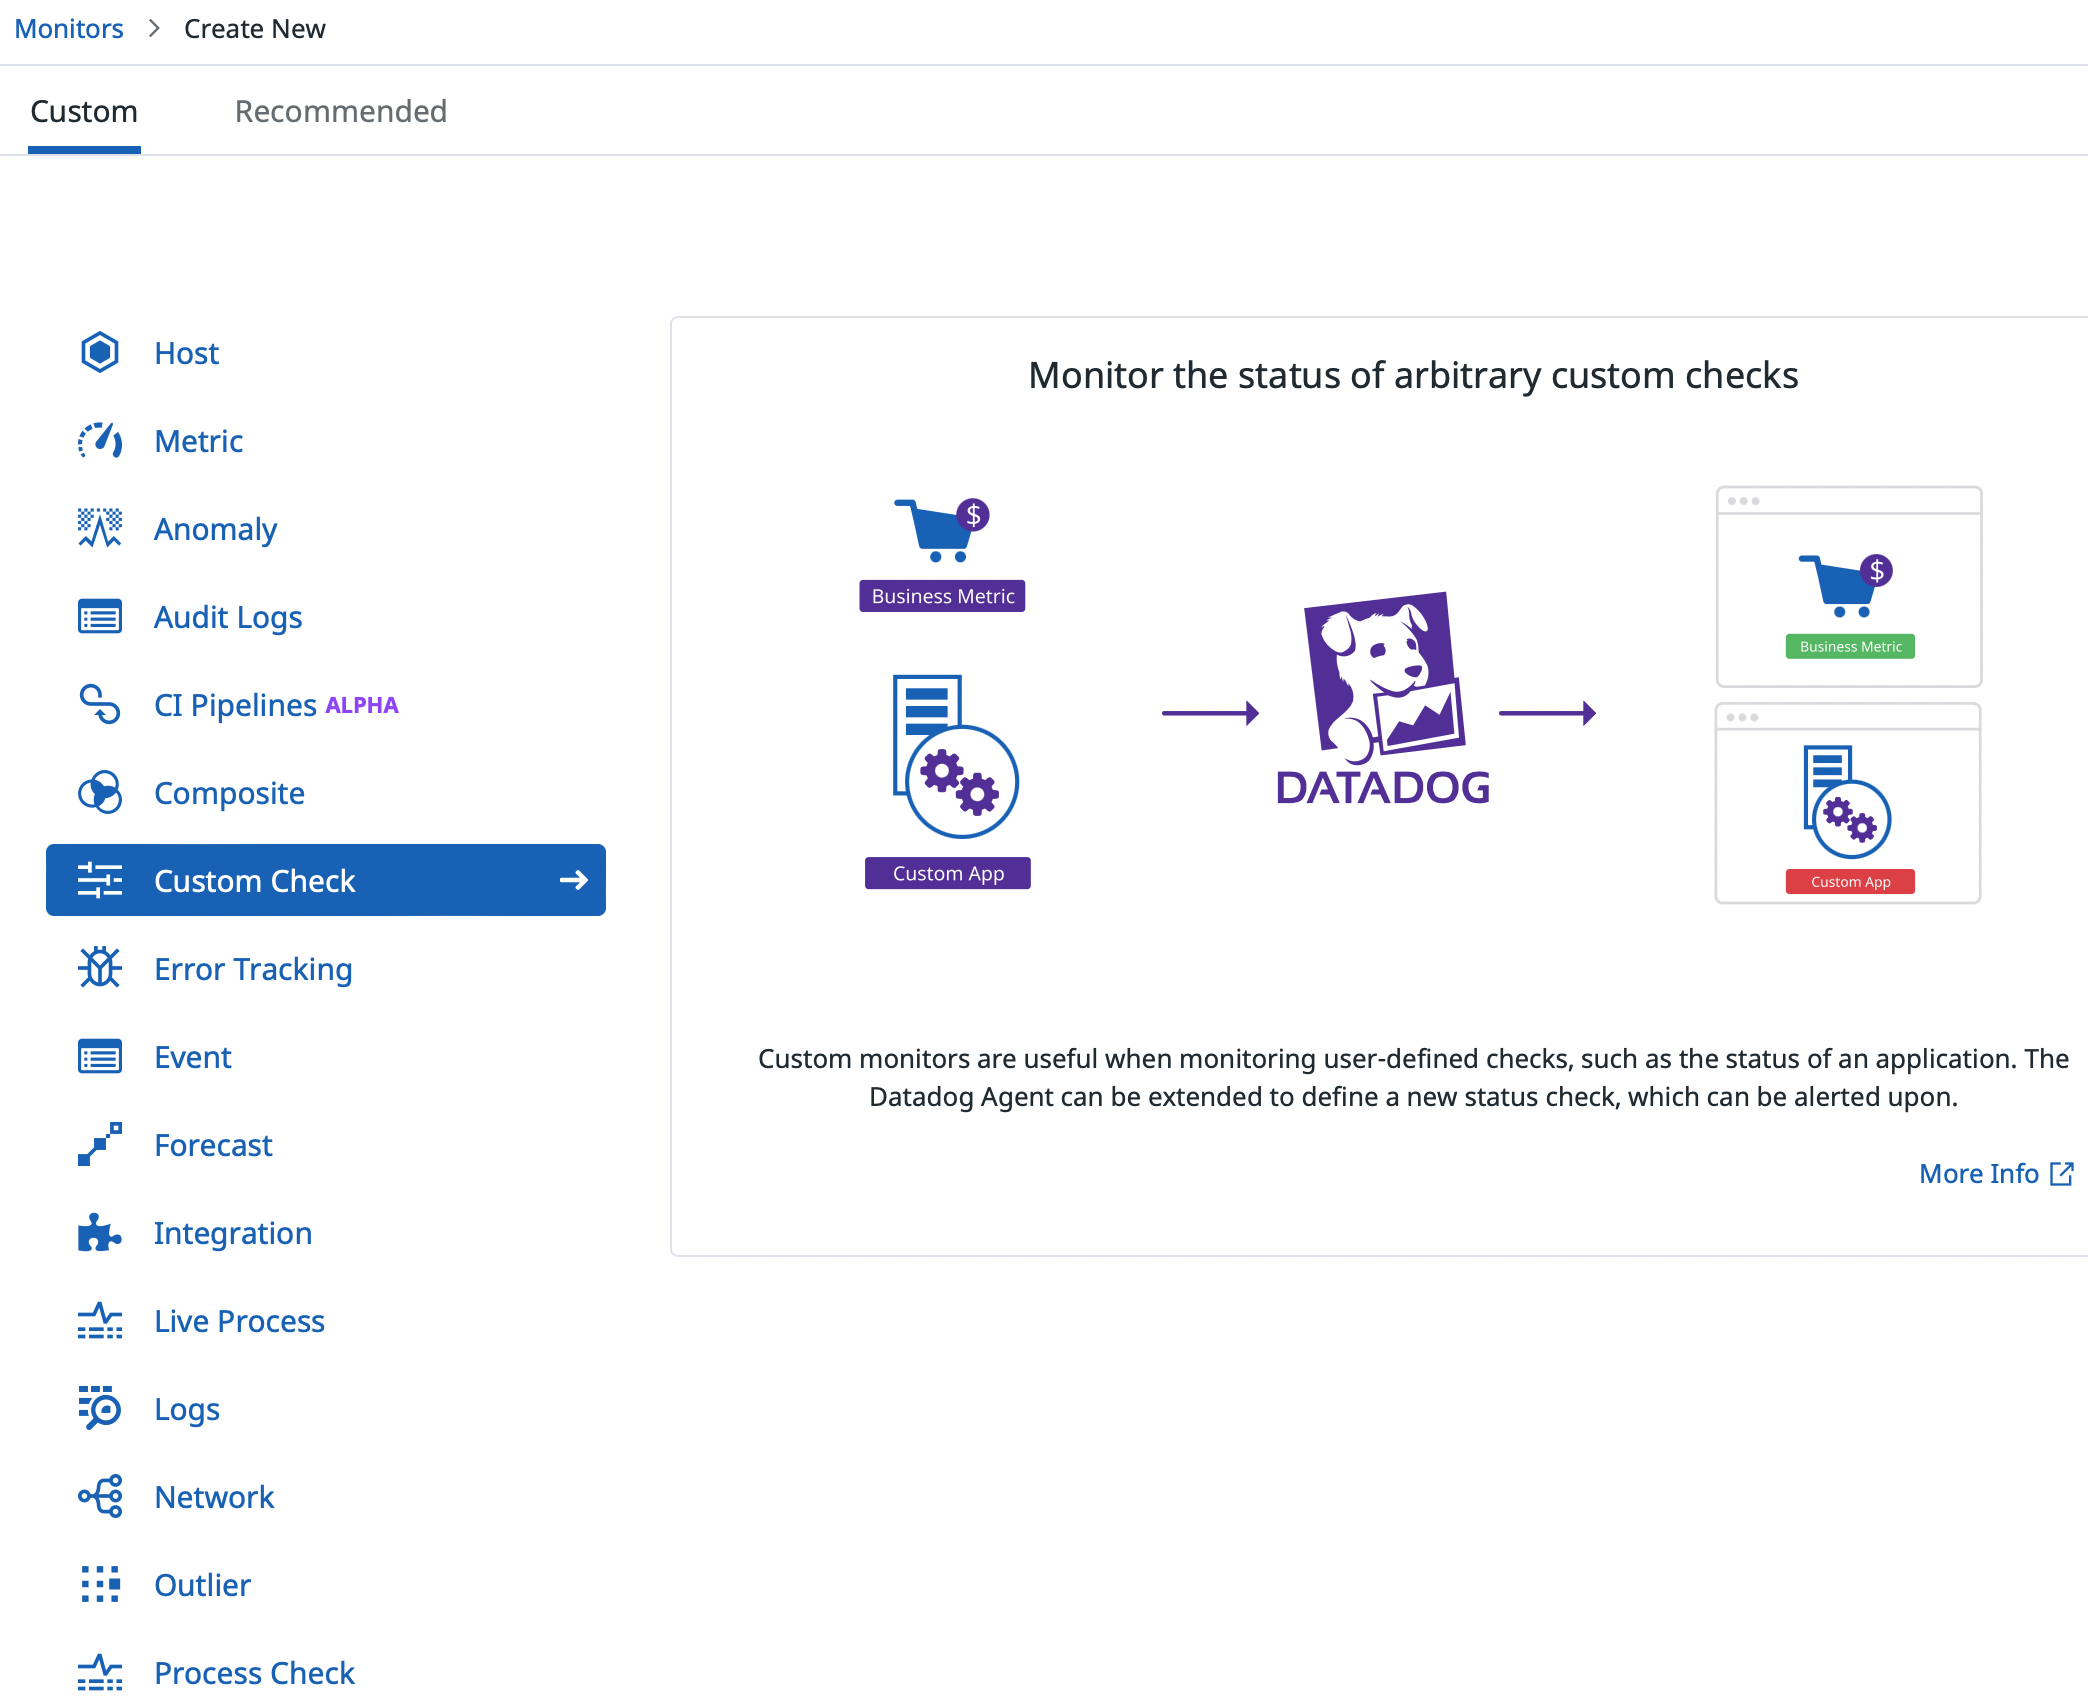
Click the [Create Integration] button and then select the [Datadog] card.
![]()
In the [Create integration] page, enter the required information and then click the [OK] button to create the integration.
![]()
Adding Webhook
① Sign in to the Datadog console.
② Click Integrations > Integrations in the navigation bar.
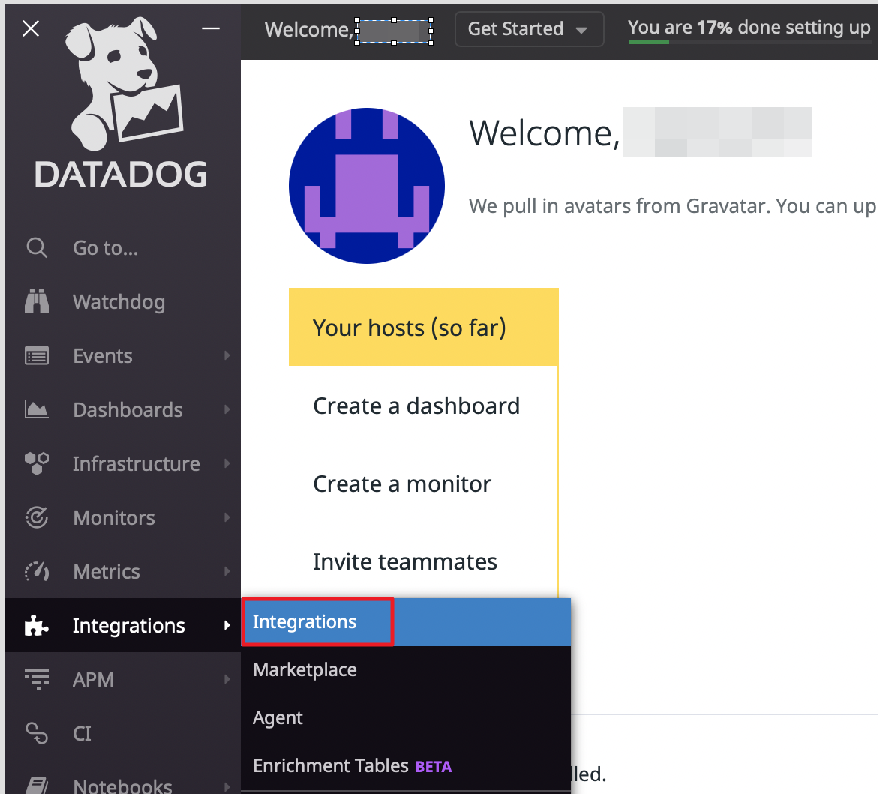
③ A list of integrations supported in Datadog will be displayed. Click [Webhooks] integration.
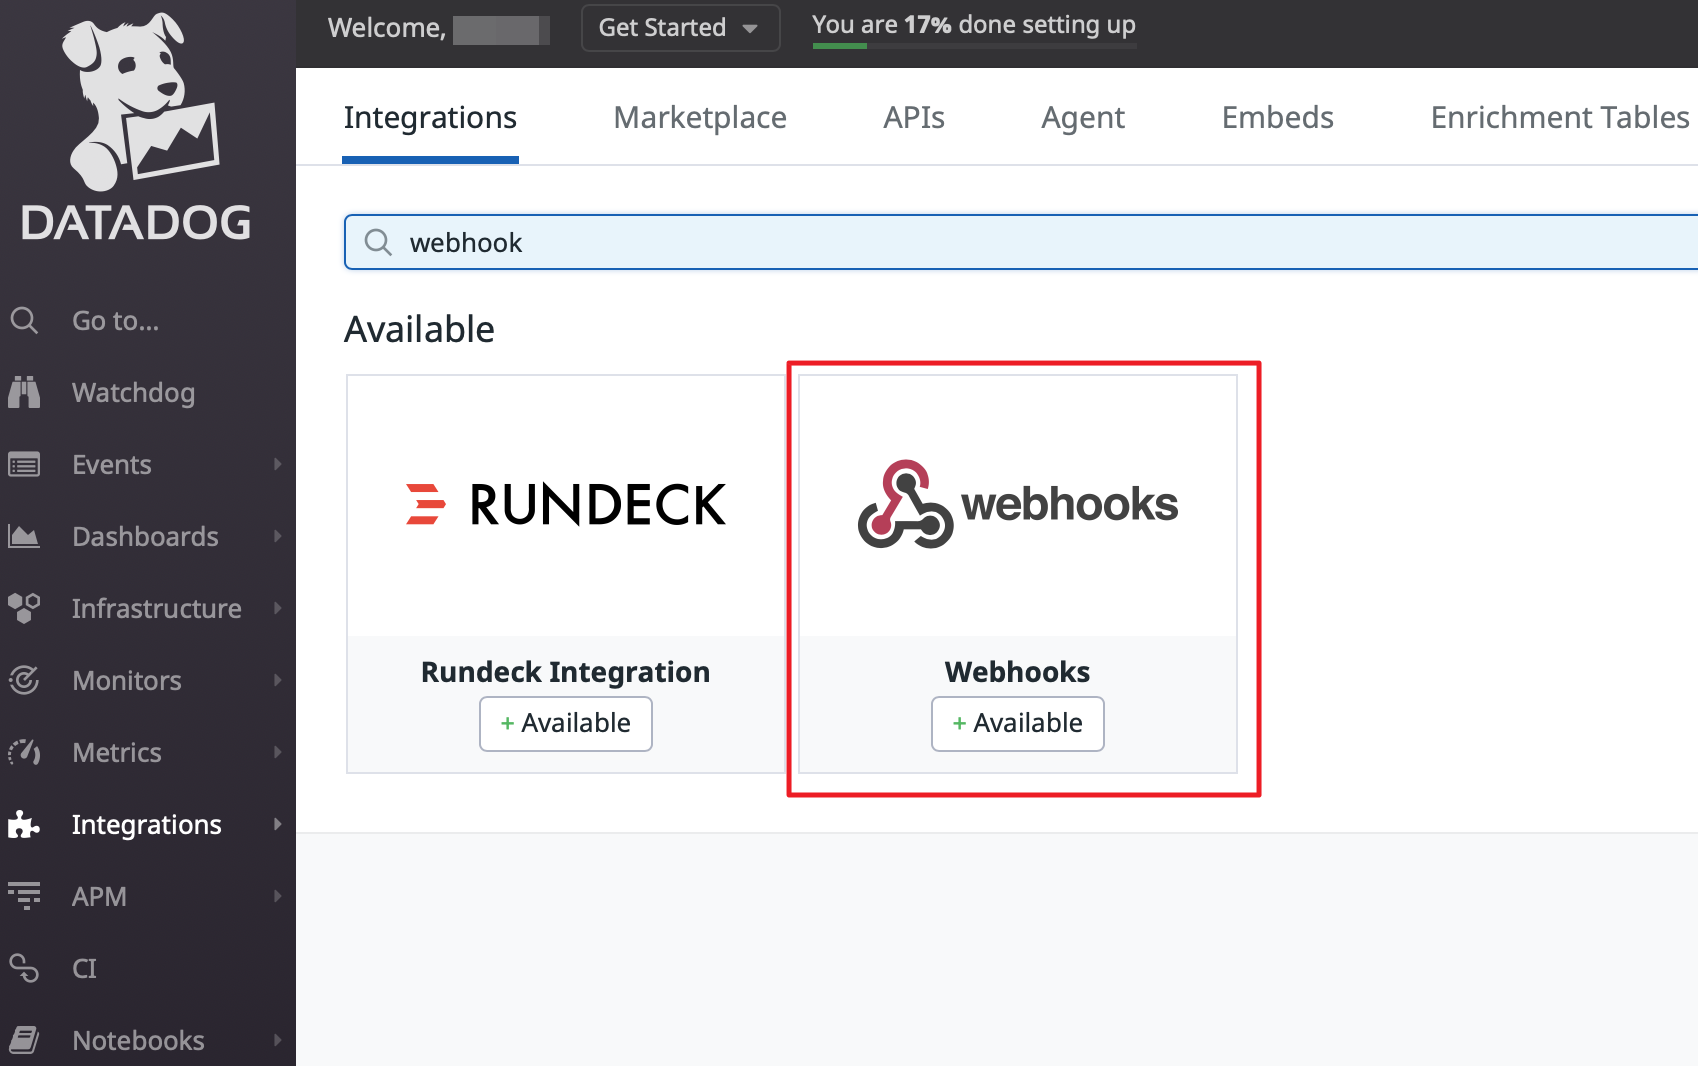
④ In the Webhooks Integration page, click the [New Webhook] button.
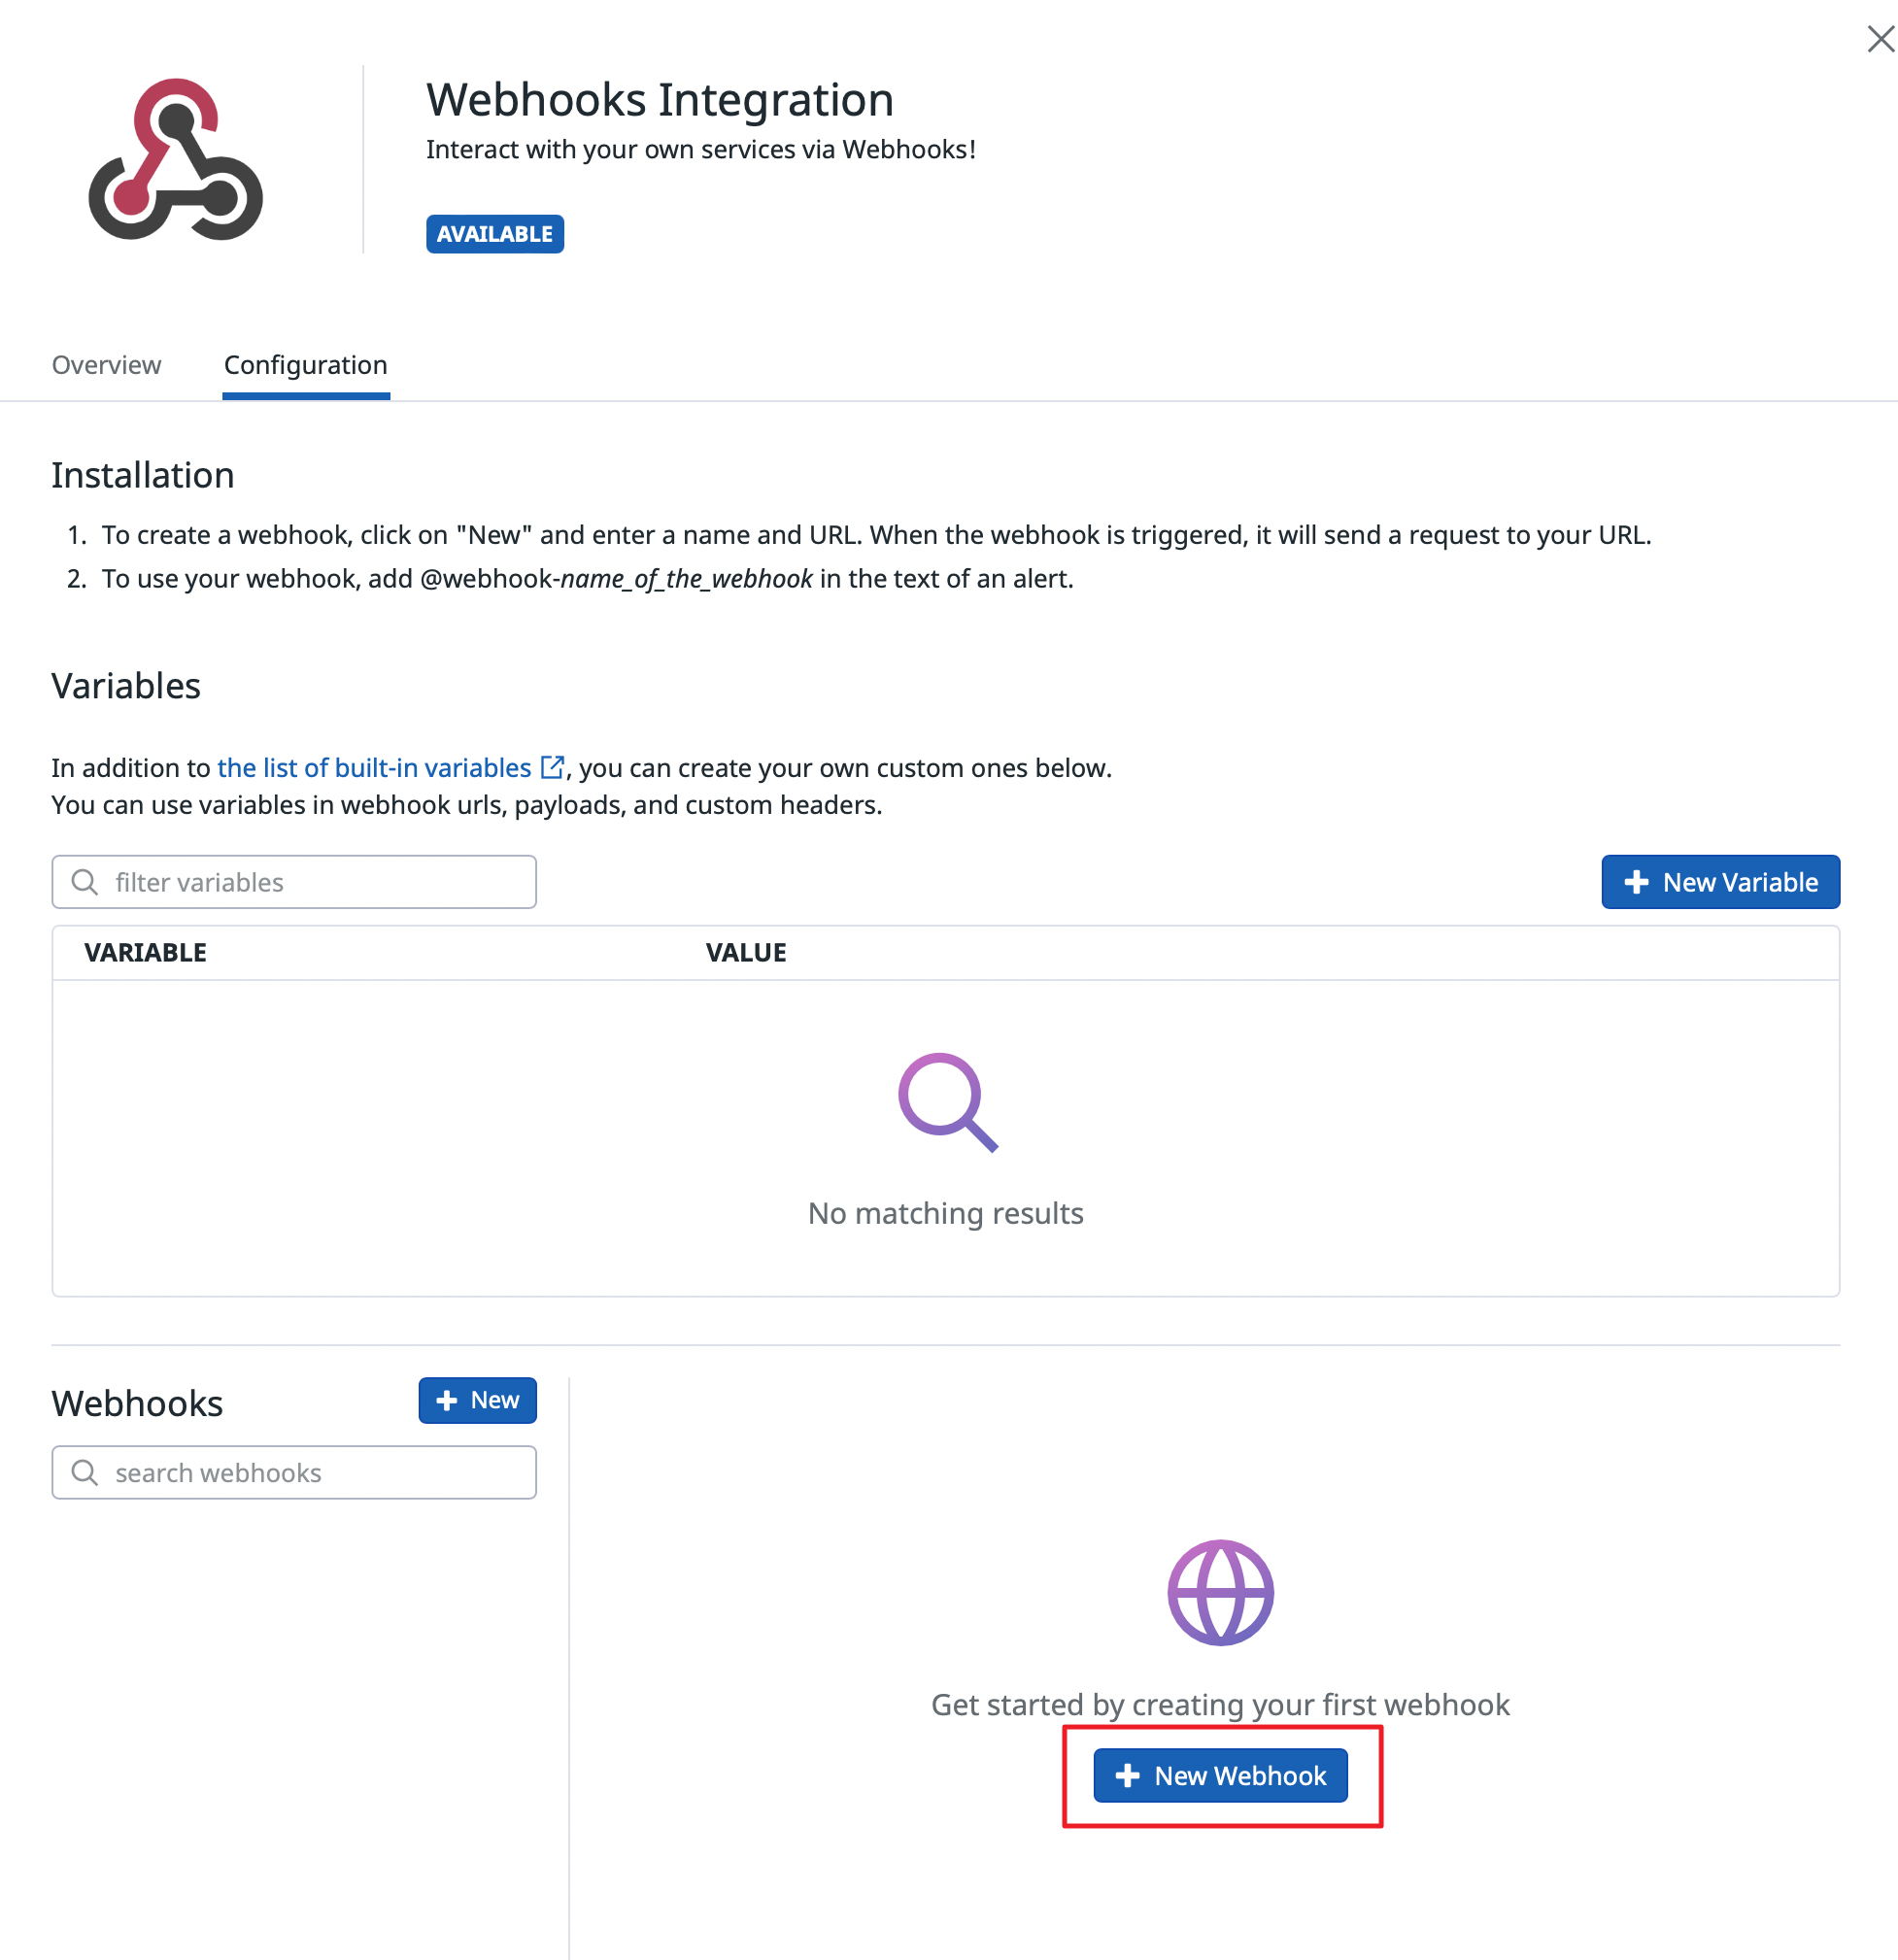
⑤ Enter Name and URL. The URL information can be found in the AlertNow console.
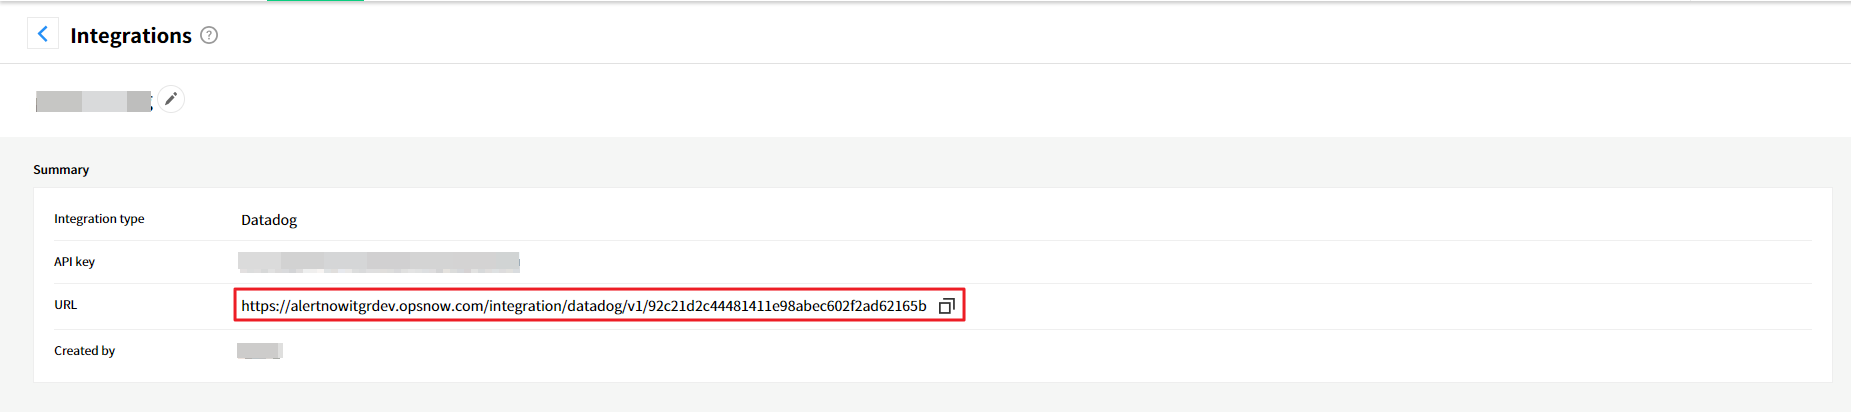
⑥ In the Payload field, enter the custom payload information provided in AlertNow.
                    {
                        "id":"$ID",
                        "email":"$EMAIL",
                        "eventTitle":"$EVENT_TITLE",
                        "eventMsg":"$EVENT_MSG",
                        "textOnlyMsg":"$TEXT_ONLY_MSG",
                        "eventType":"$EVENT_TYPE",
                        "date":"$DATE",
                        "datePosix":"$DATE_POSIX",
                        "alertId":"$ALERT_ID",
                        "alertType":"$ALERT_TYPE",
                        "aggregKey":"$AGGREG_KEY",
                        "orgId":"$ORG_ID",
                        "alertStatus":"$ALERT_STATUS",
                        "alertScope":"$ALERT_SCOPE",
                        "hostname":"$HOSTNAME",
                        "user":"$USER",
                        "username":"$USERNAME",
                        "snapshot":"$SNAPSHOT",
                        "link":"$LINK",
                        "priority":"$PRIORITY",
                        "tags":"$TAGS",
                        "lastUpdated":"$LAST_UPDATED",
                        "lastUpdatedPosix":"$LAST_UPDATED_POSIX",
                        "alertMetric":"$ALERT_METRIC",
                        "metricNamespace":"$METRIC_NAMESPACE",
                        "alertTransition":"$ALERT_TRANSITION",
                        "orgName":"$ORG_NAME",
                        "alertQuery":"$ALERT_QUERY",
                        "alertTitle":"$ALERT_TITLE",
                        "alertCycleKey":"$ALERT_CYCLE_KEY"
                      }
⑦ Click the [Save] button.
Adding Monitor
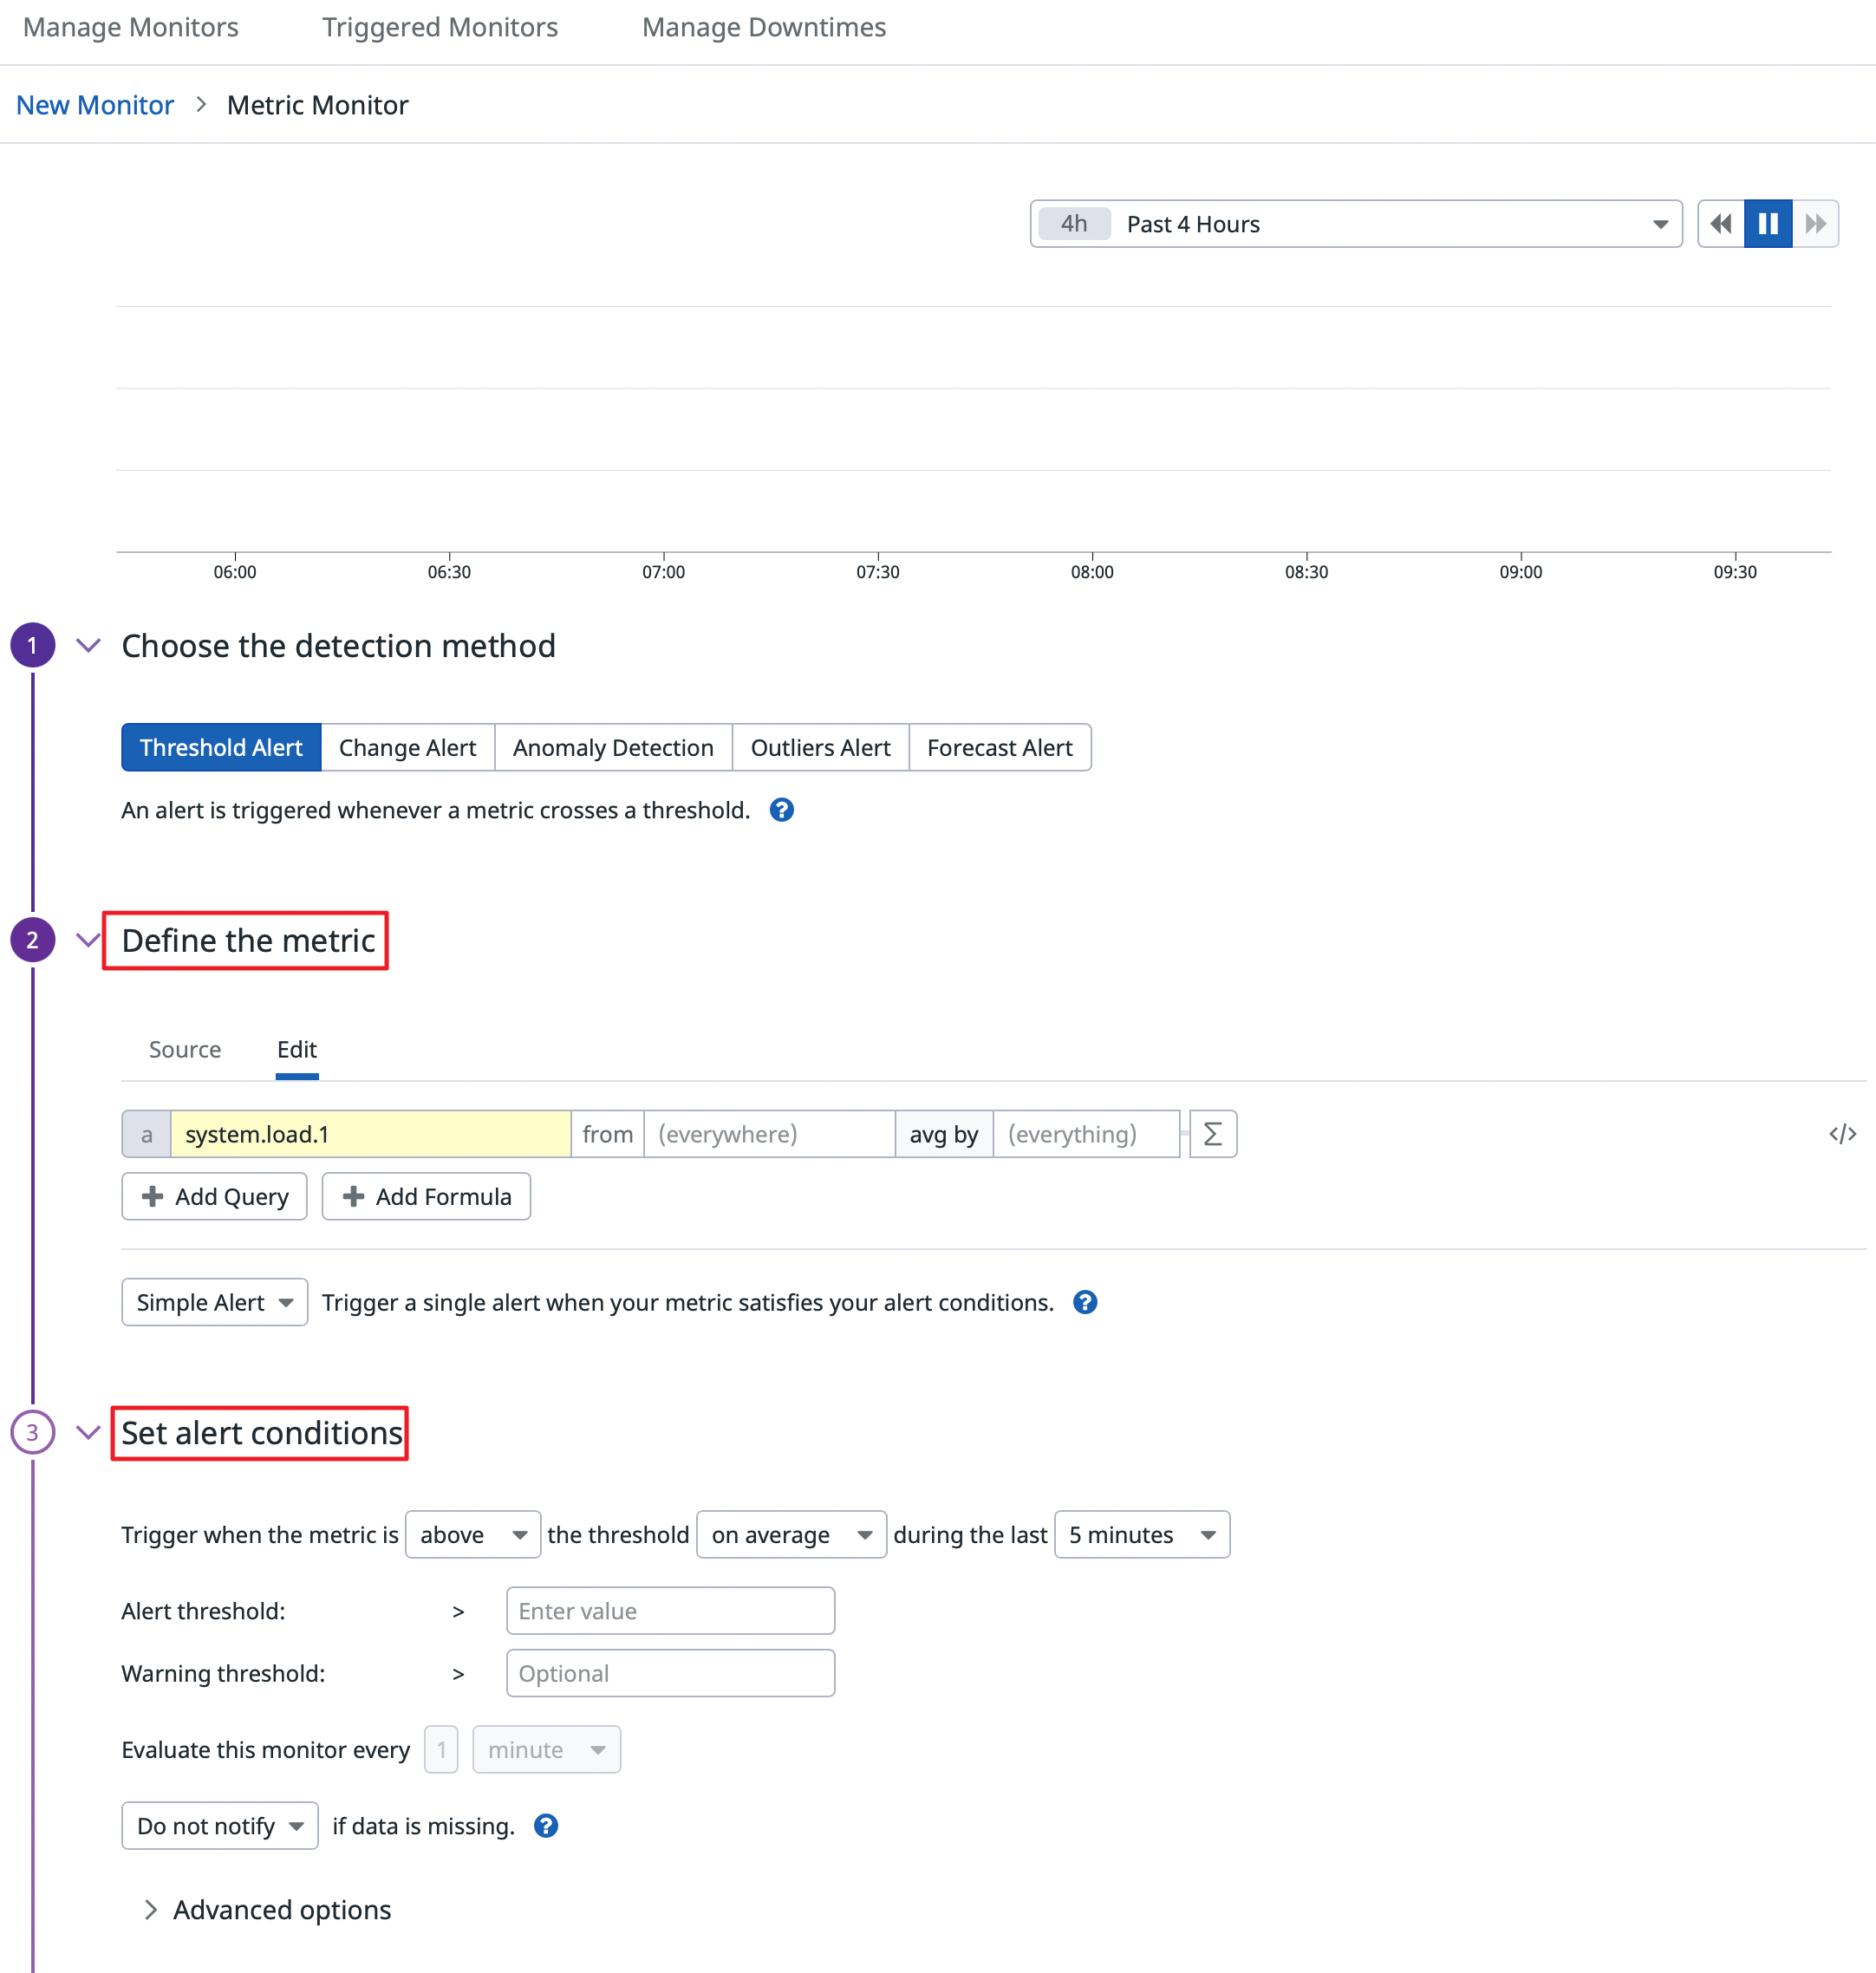
① Click Monitors > New Monitor in the navigation bar.
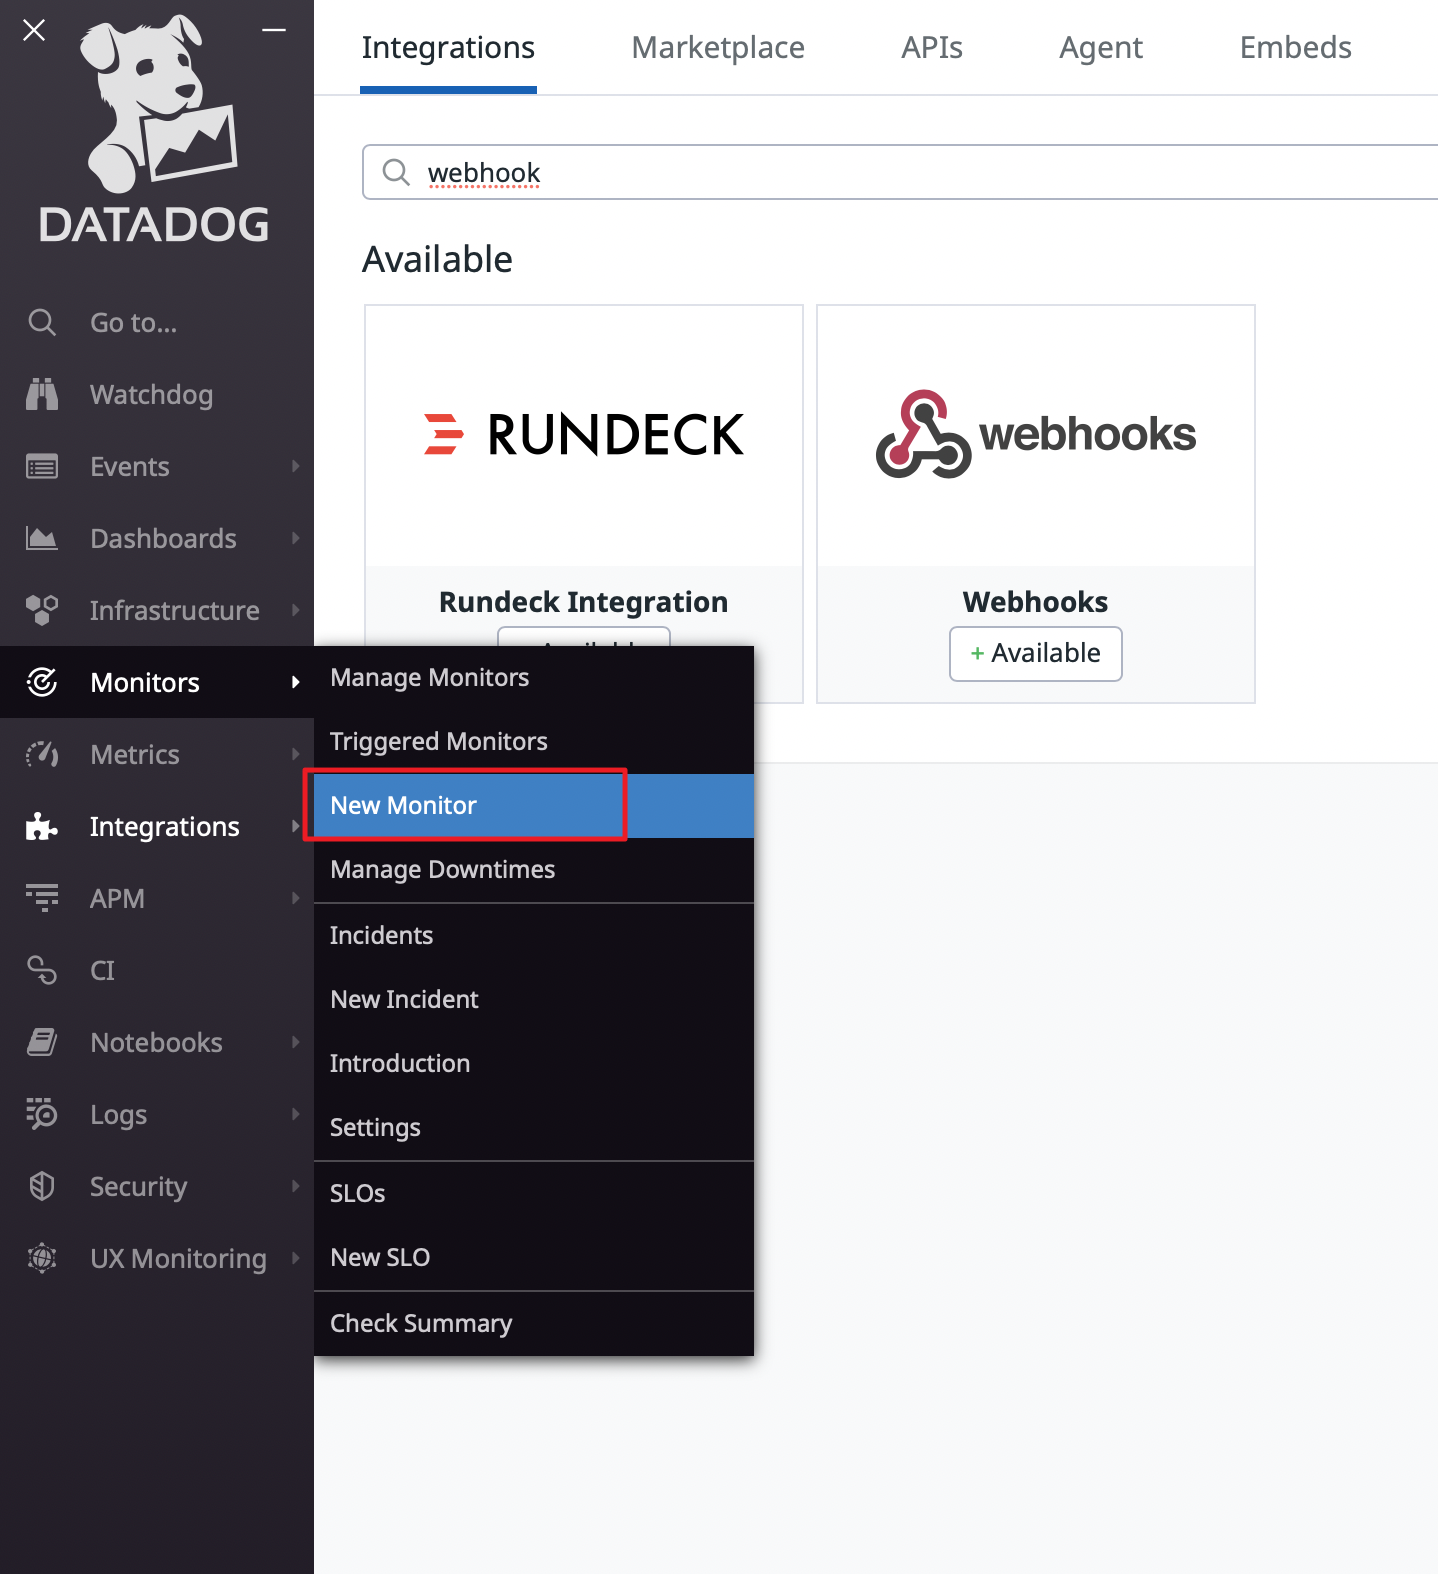
② Select the monitor type.
③ Set Metrics and Conditions required for monitoring.
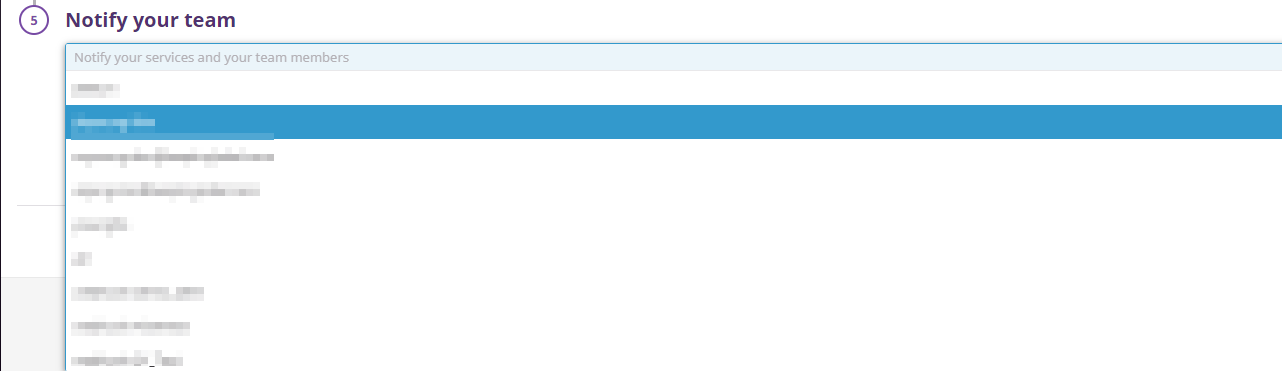
④ Select the Webhook created in the Notify your team step and click the [Create] button.
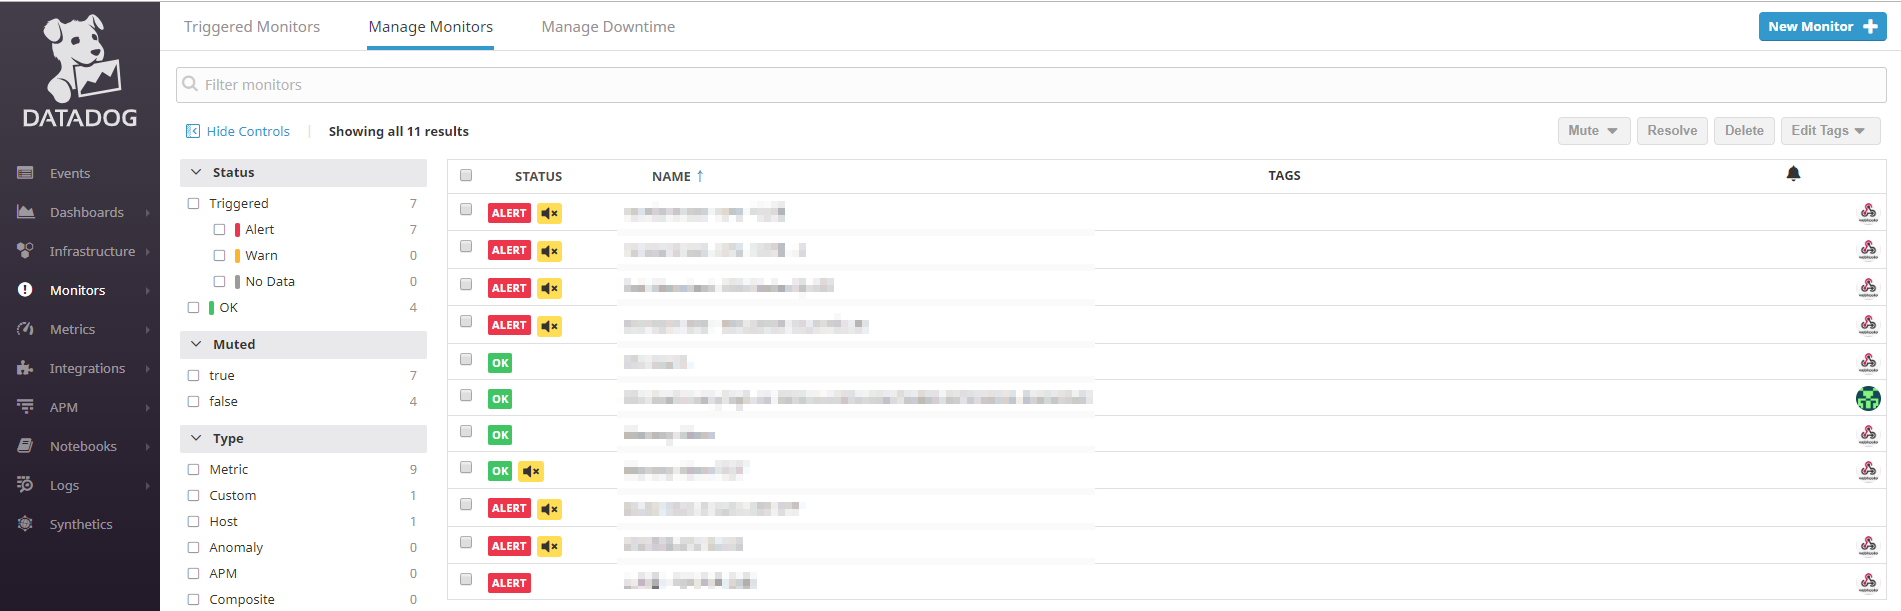
⑤ A list of created monitors will be displayed under the Manage Monitors tab.
New Relic
To connect New Relic with AlertNow, you must set Alert Condition and Webhook in New Relic.
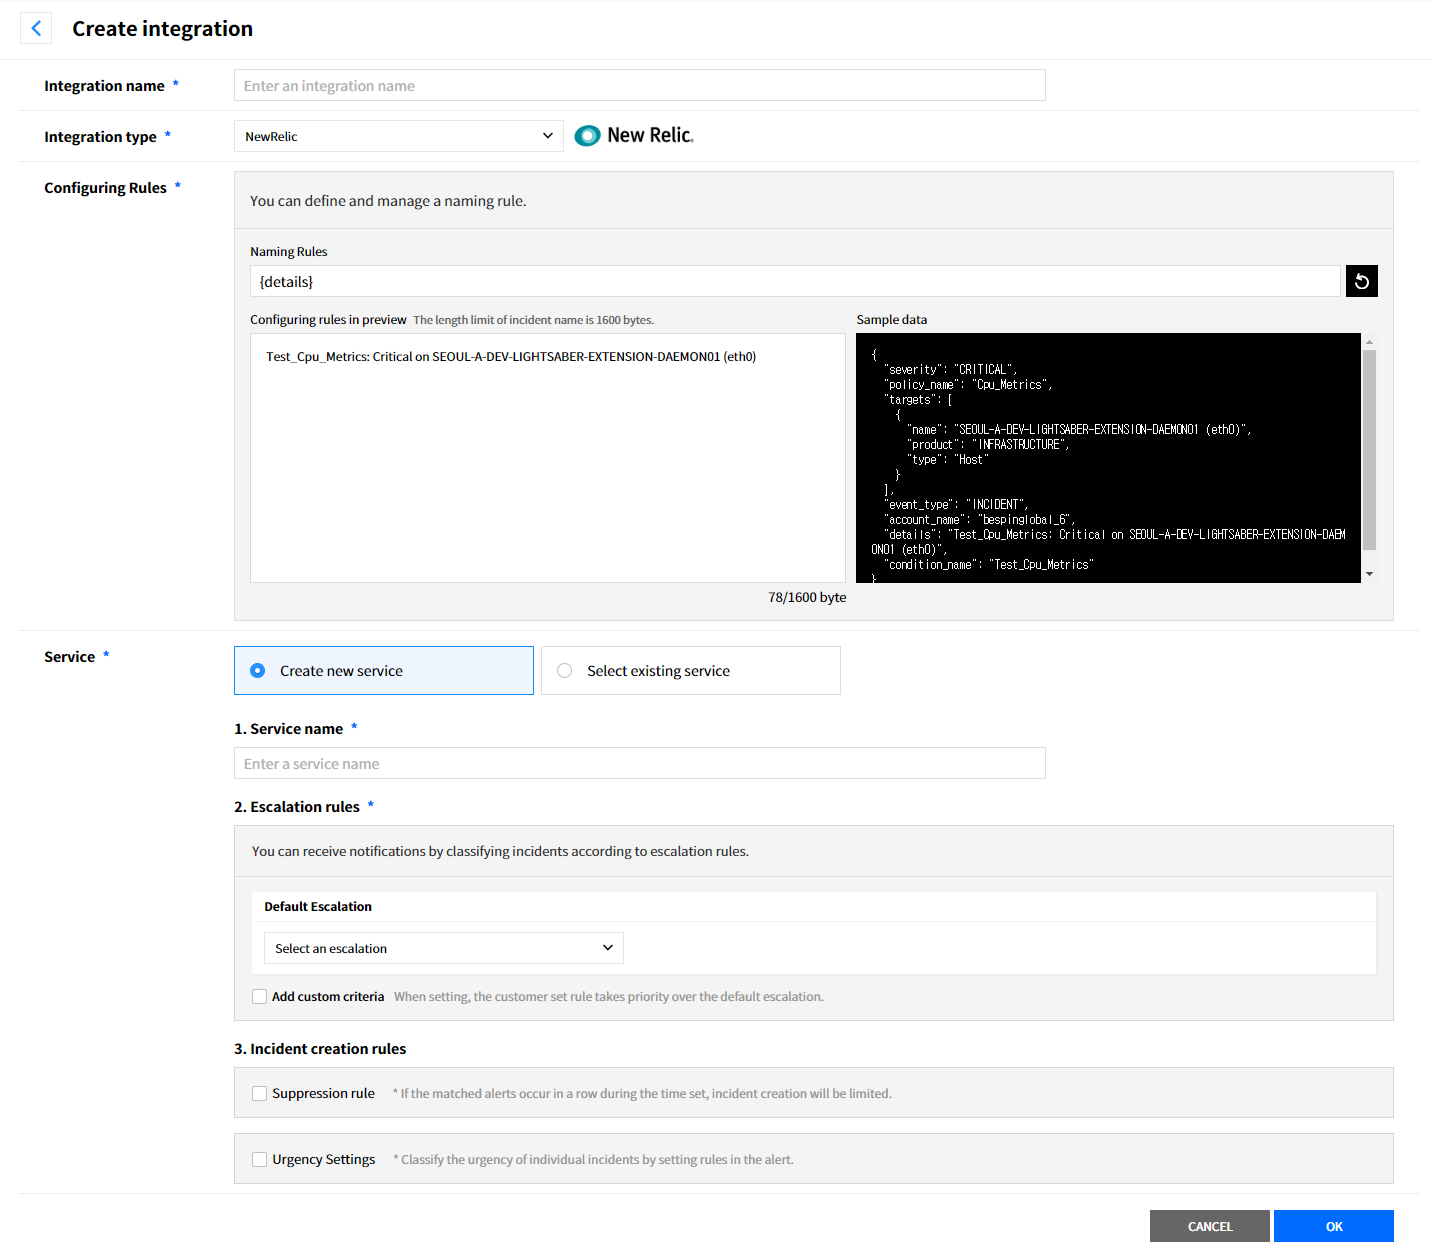
Click the [Create Integration] button and then select the [New Relic] card.
![]()
In the Create integration page, enter the required information and then click the [OK] button to create the integration.
![]()
Setting Webhook
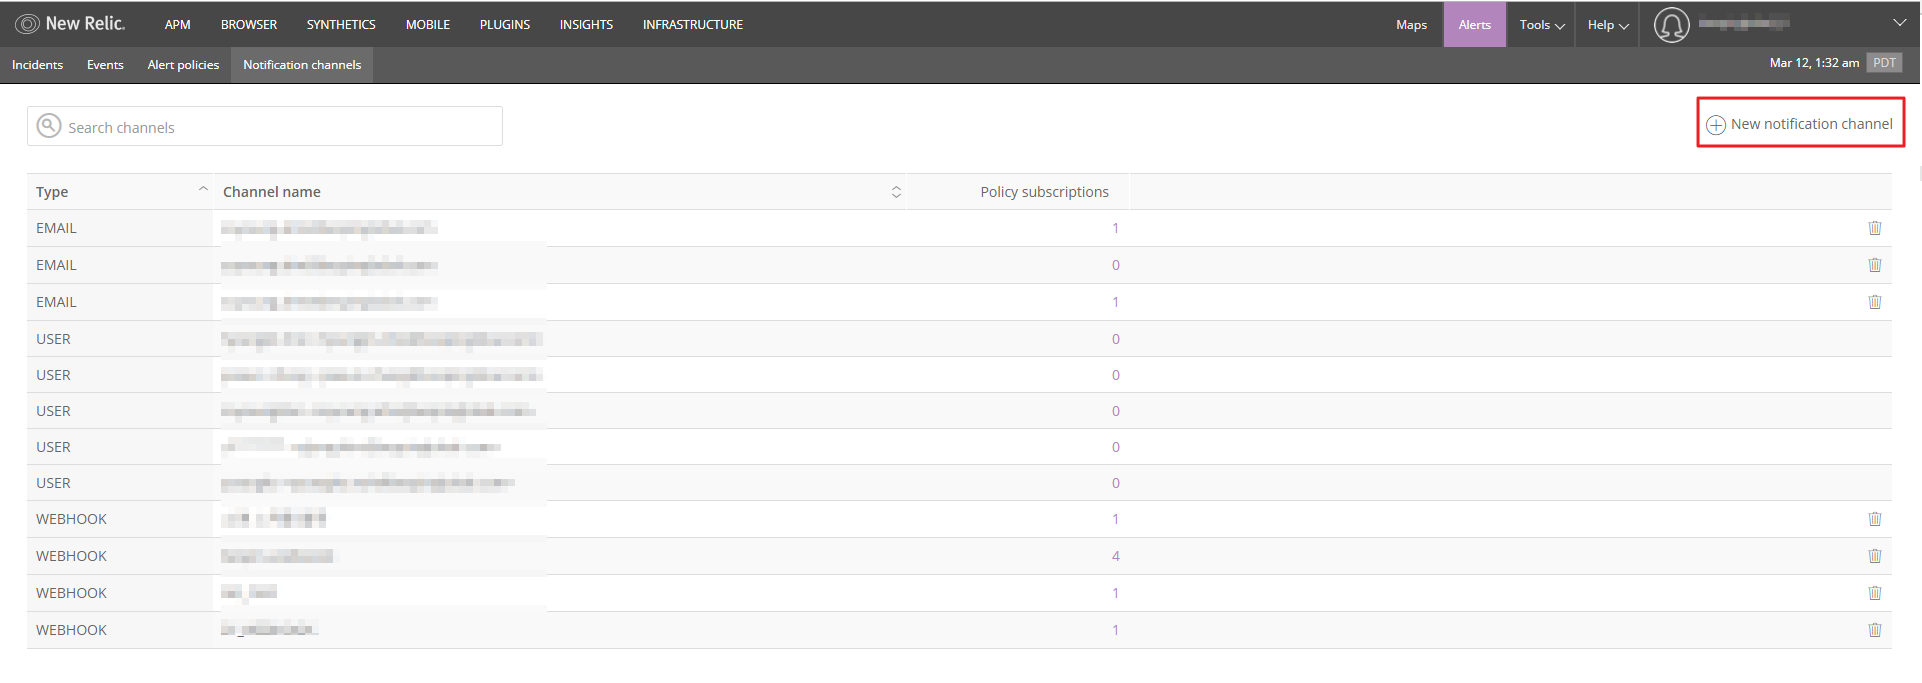
① Click Alerts > Notification channels > + New notification channel at the top of the page.
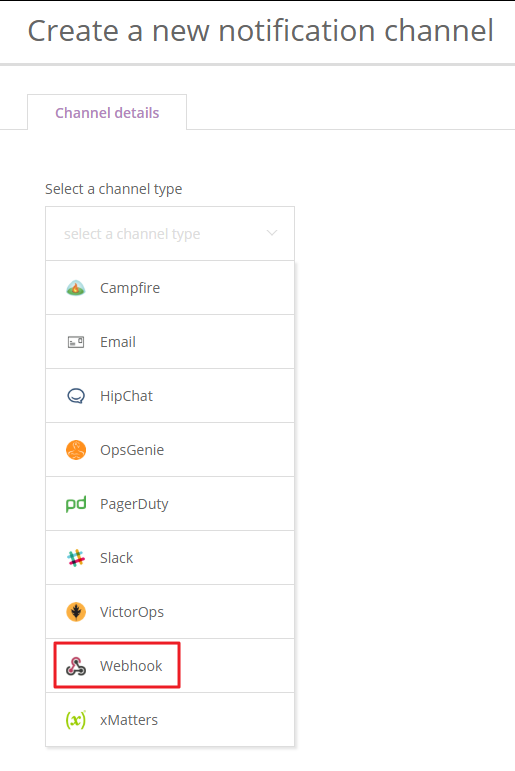
② Select [Webhook] as a channel type.
③ Enter the following for creating a notification channel.
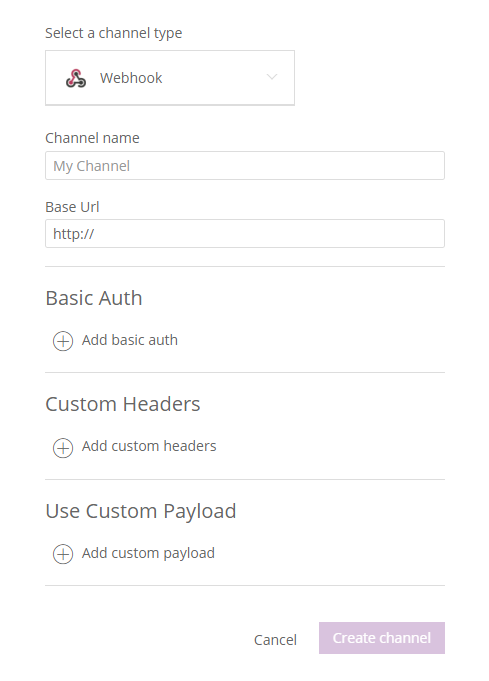
④ Click the [Create channel] button to create a channel.
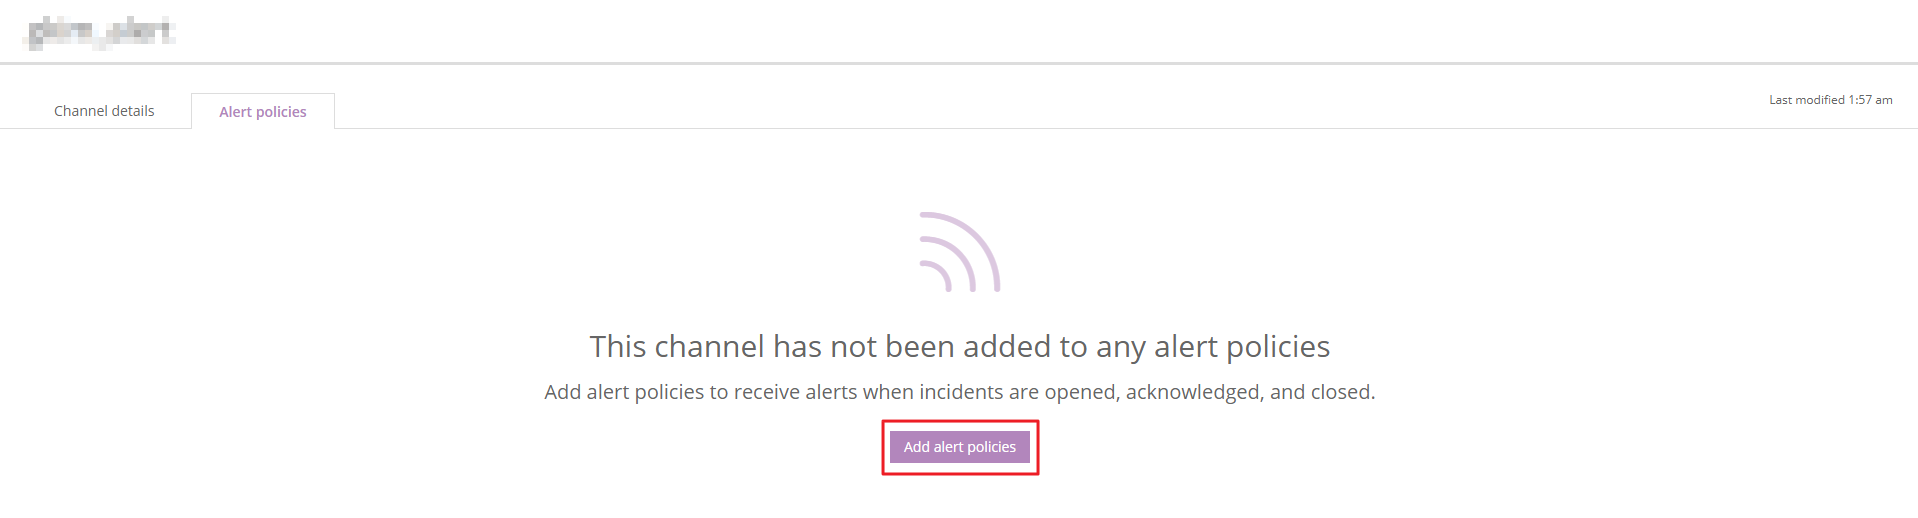
⑤ Choose the created webhook and click the [Add alert policies] button in the Alert policies tab.
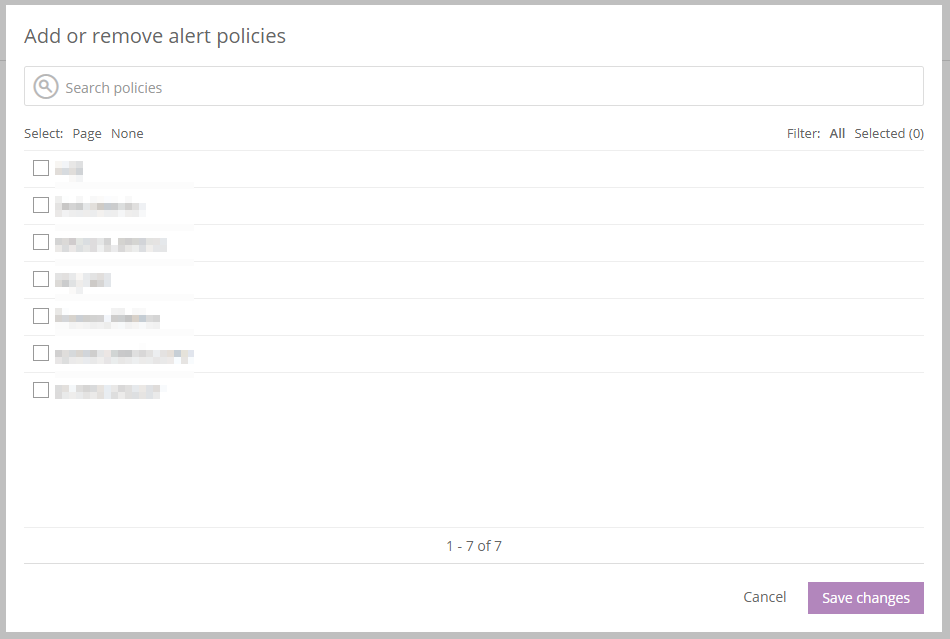
⑥ Select alert policies to add and click the [Save changes] button. The alert policies will be mapped to created webhook.
Setting Alert Condition
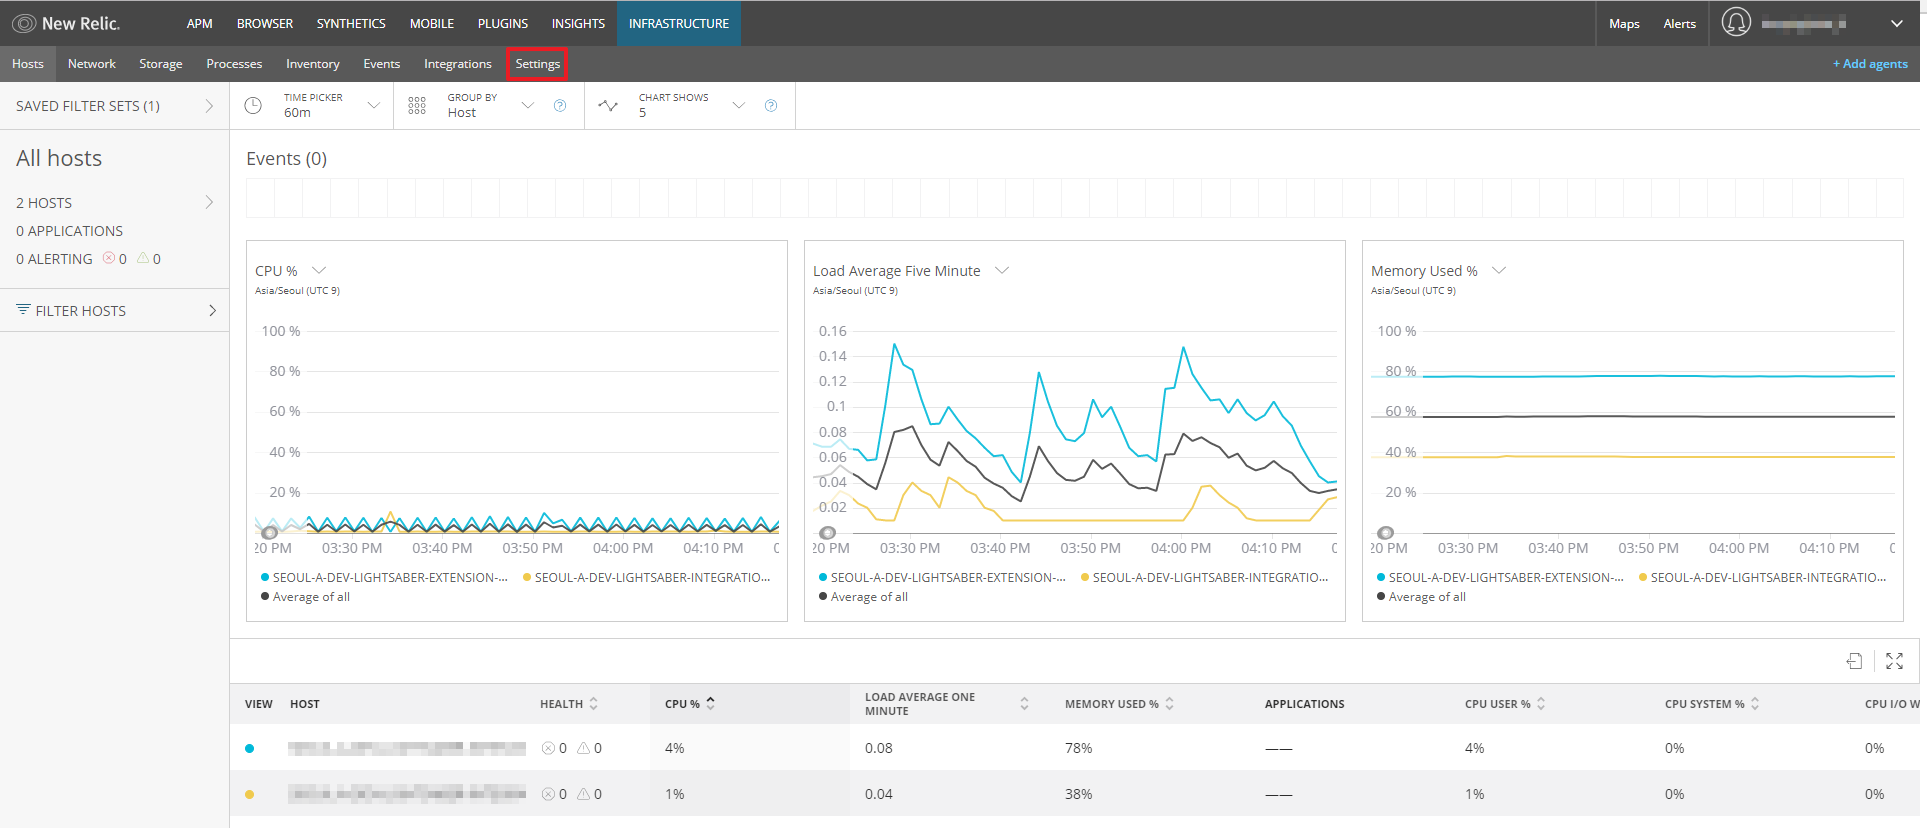
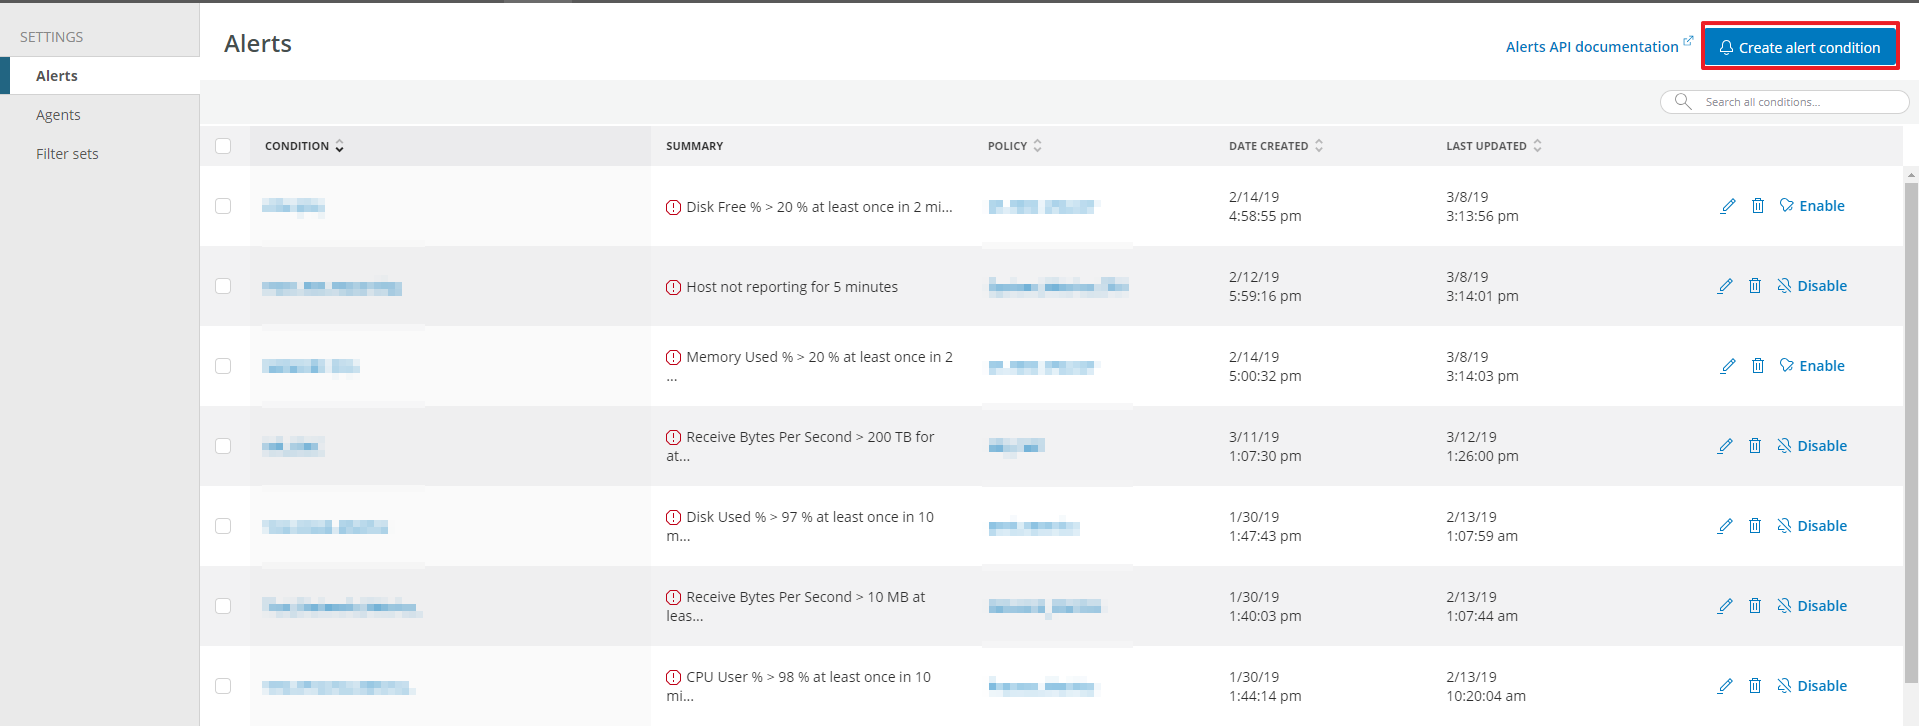
① Sign in to New Relic and click the[INFRASTRUCTURE] at the top of the page. You can find the metrics generated from the integrated hosts in the Instrastructure dashboard.
② Click [Settings] in the dashboard.
③ In the Alerts page, click the [Create alert condition] button.
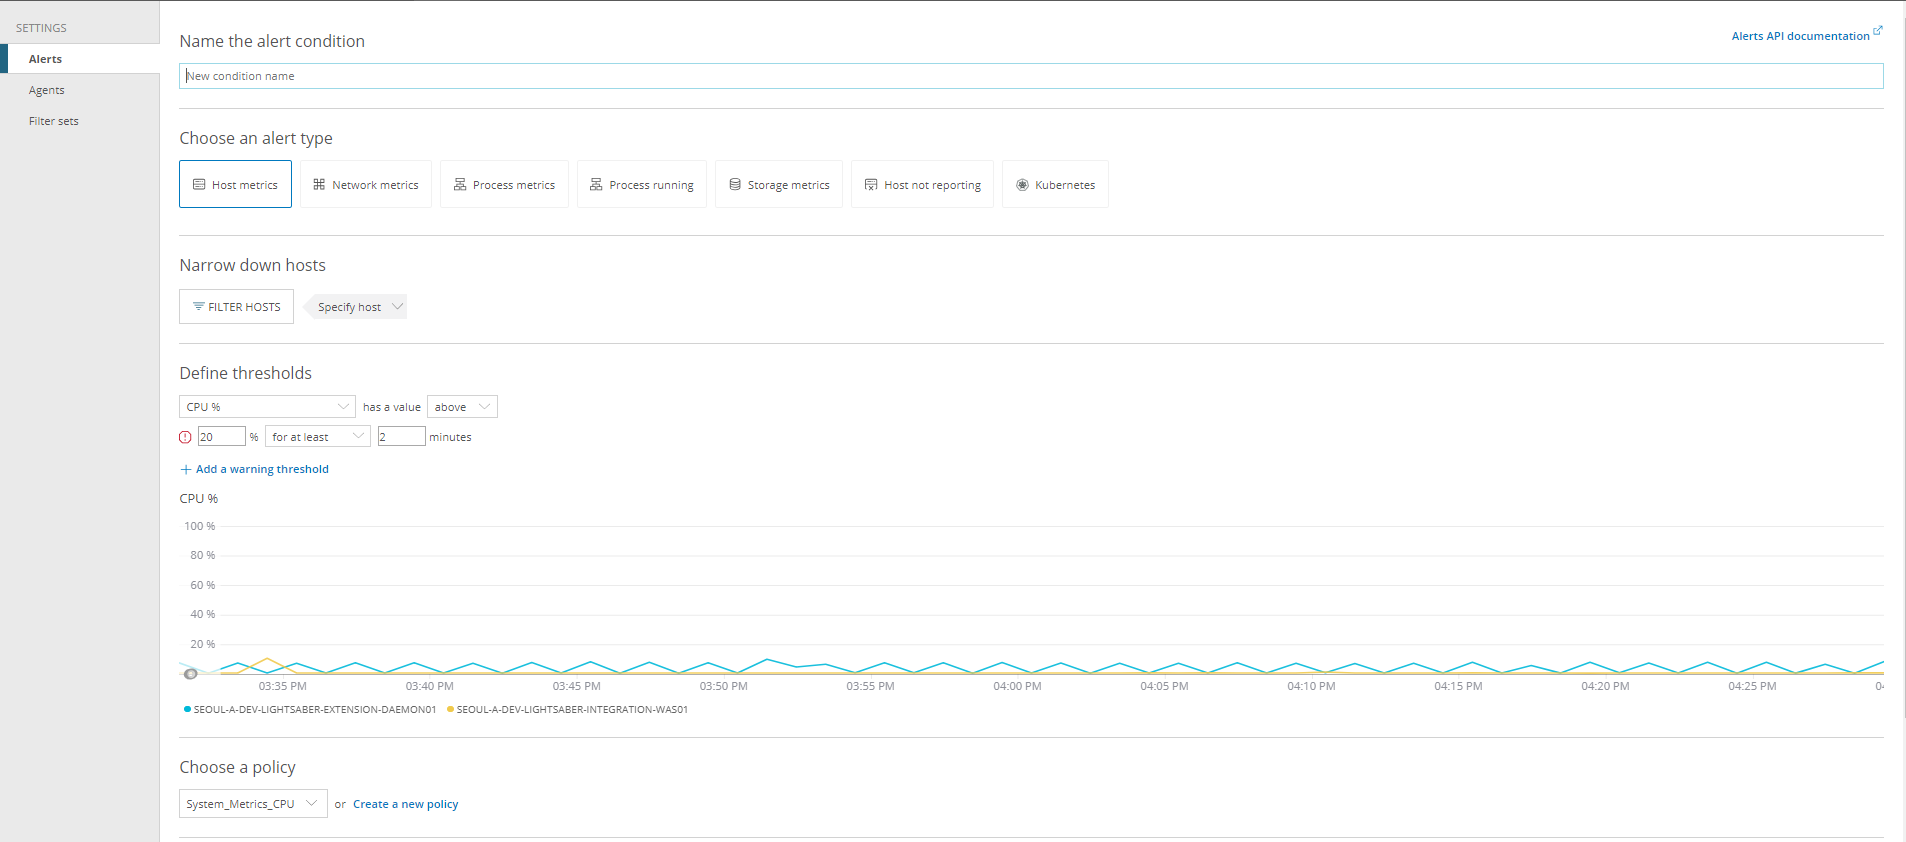
④ Creating alerts page will be displayed as below.
⑤ Click the [Create] button after completing the settings.
Adding Condition
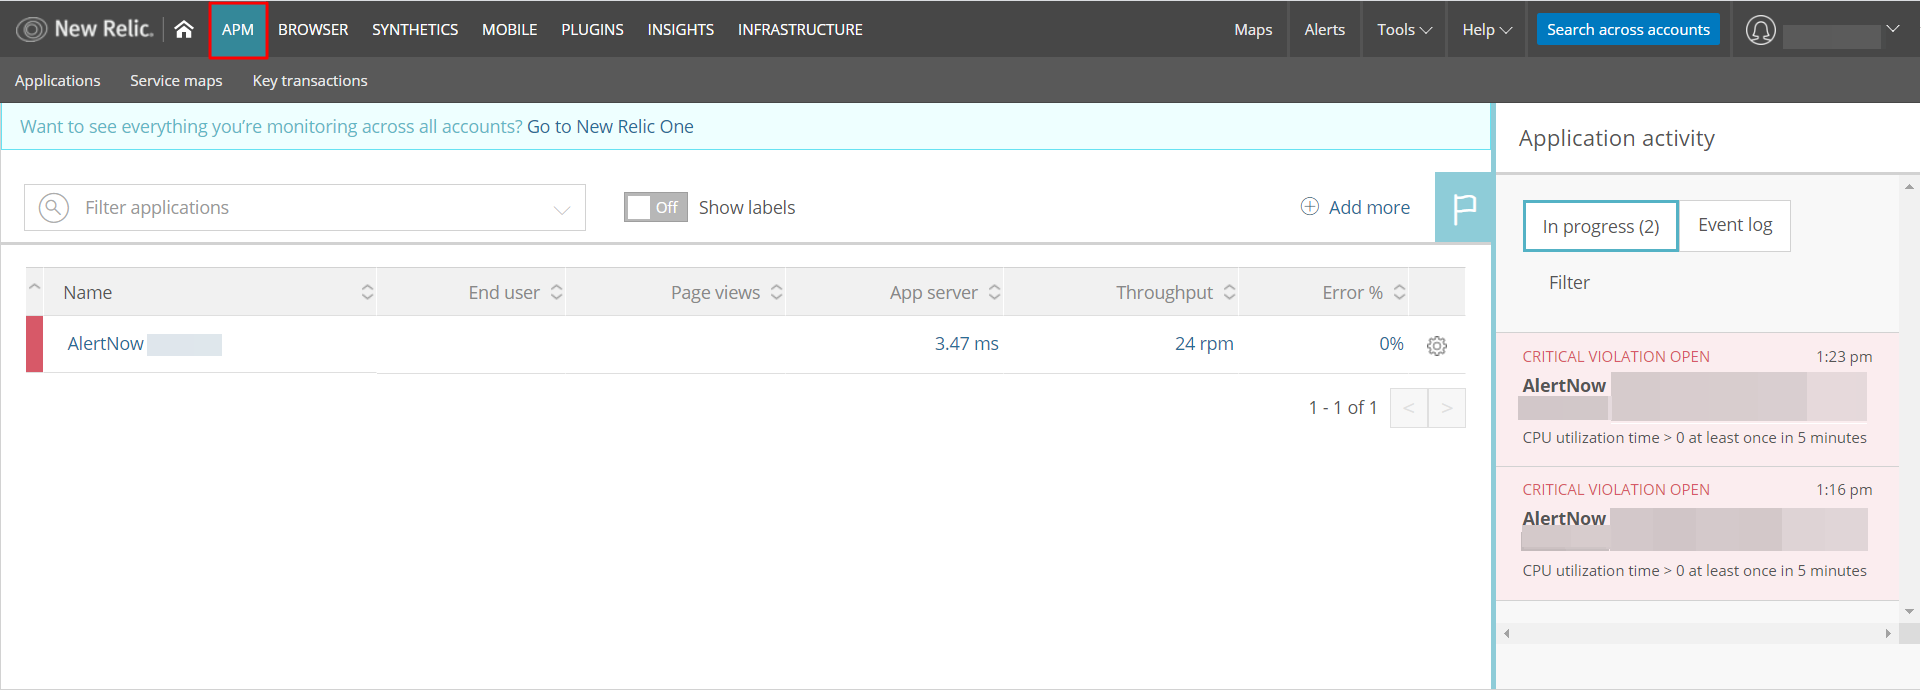
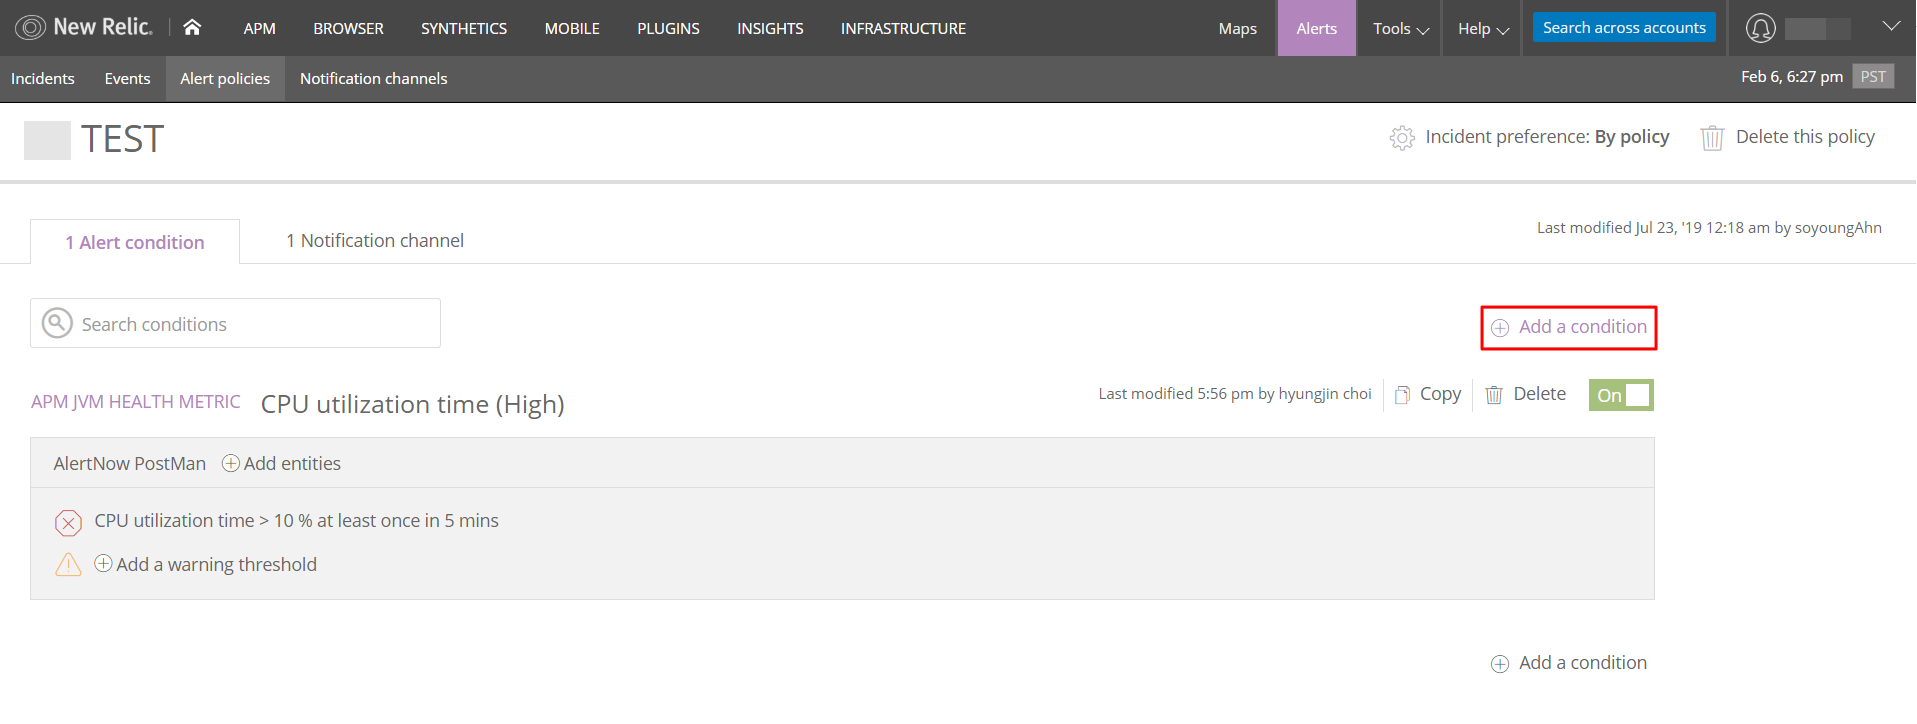
① Sign in to New Relic and click [APM] at the top of the page. In the dashboard, you can check the applications that are currently running.
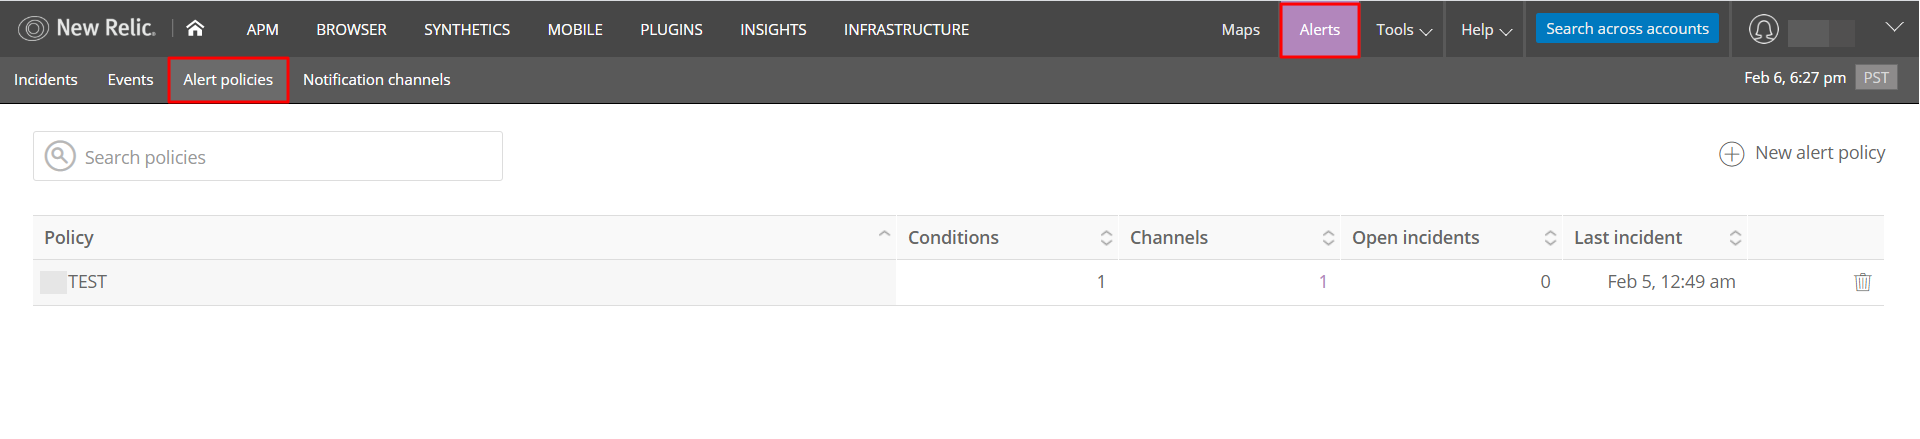
② Click [Alerts] at the top of the page. In the Alert policies page, select a policy to add a condition.
③ Click the [Add a condition] button.
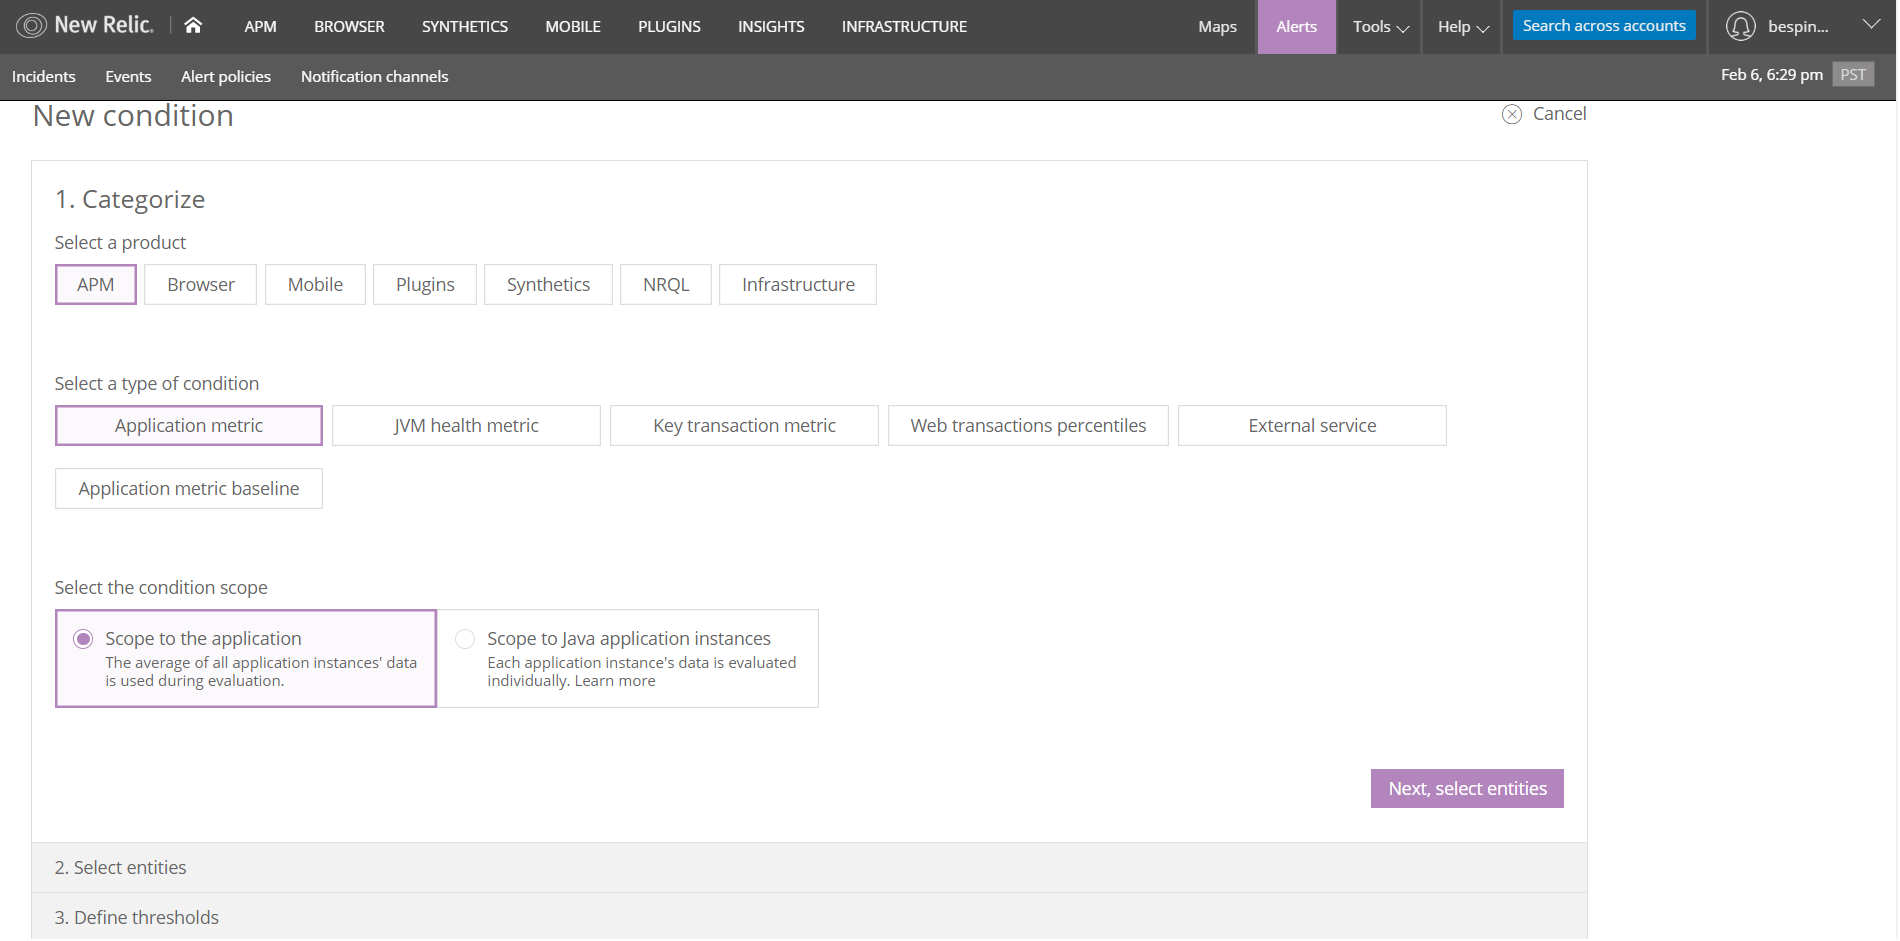
④ New Condition page will be displayed.
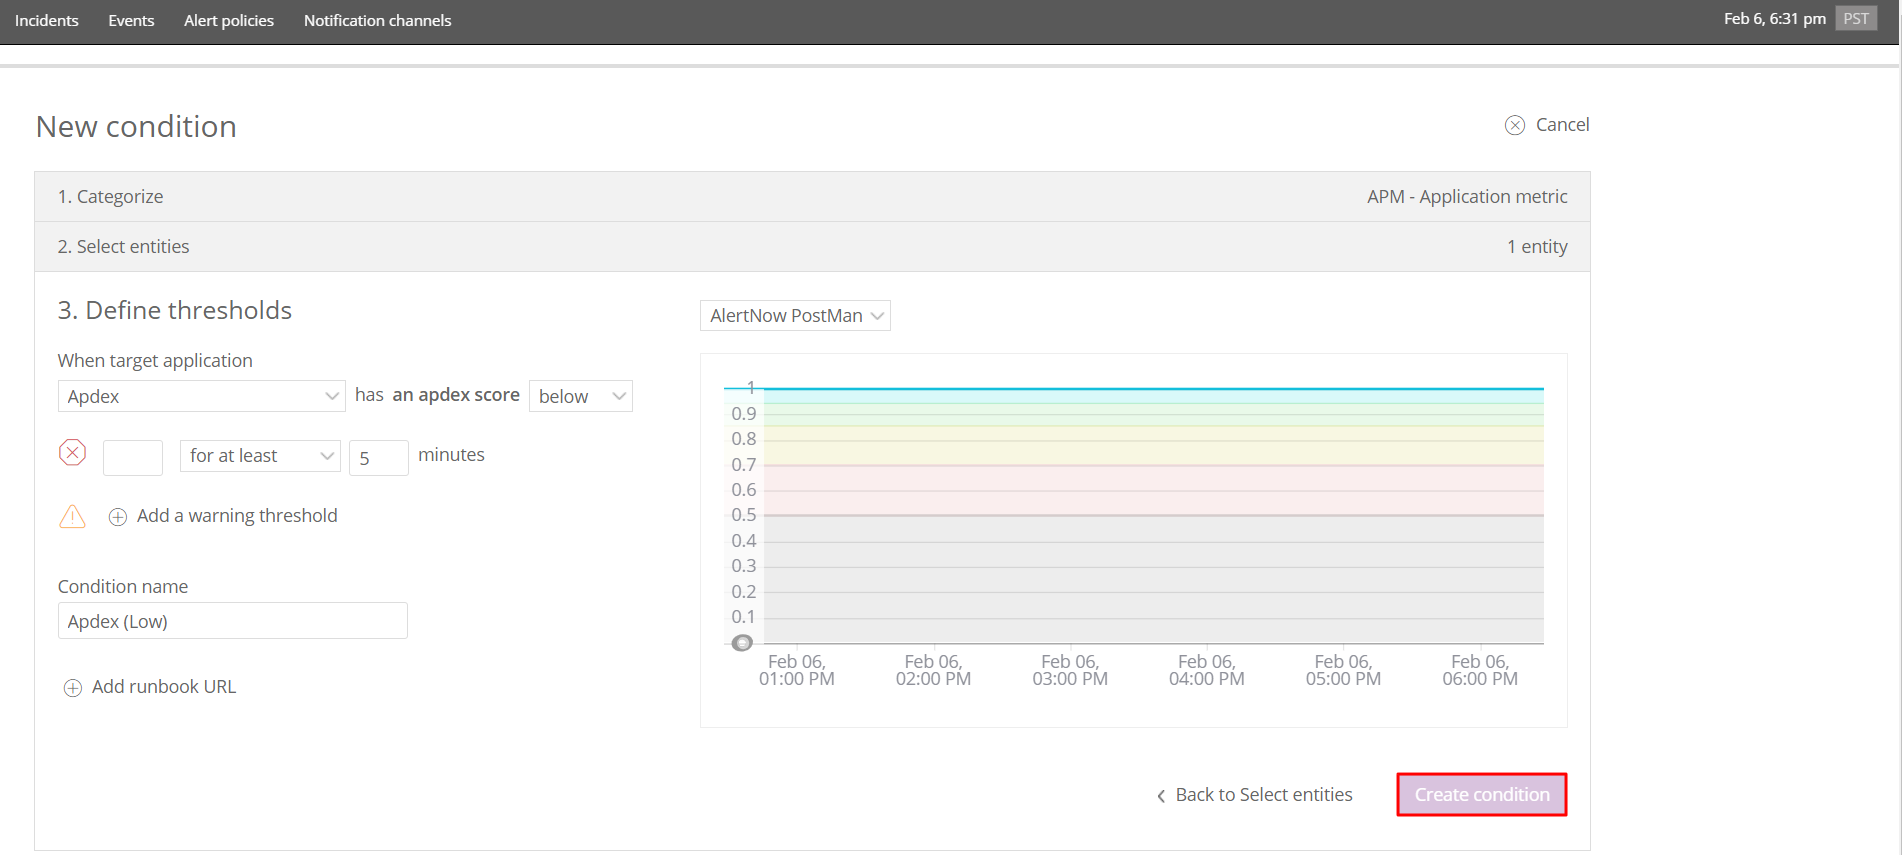
⑤ Click the [Create condition] button after completing the settings.
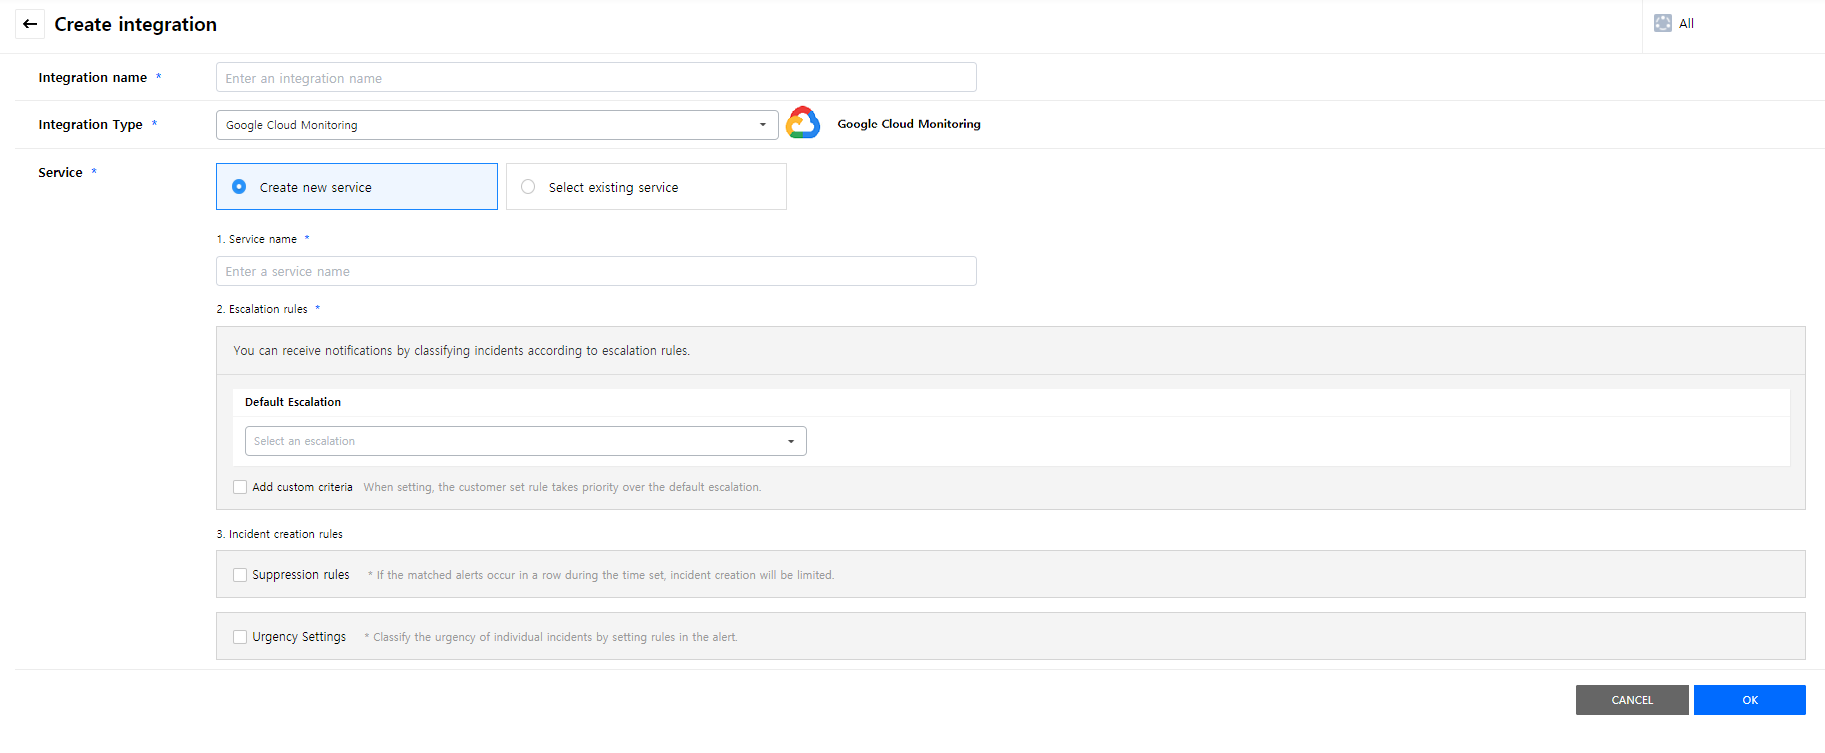
Google Cloud Monitoring
To connect Google Cloud Monitoring (GCP) with AlertNow, you must add Webhook and Alert Policy in the GCP console.
Click [Create Integration] button and then select the [Google Cloud Monitoring] card.
![]()
In the [Create integration] page, enter the required information and then click [OK] button to create the integration.
![]()
Adding Webhook
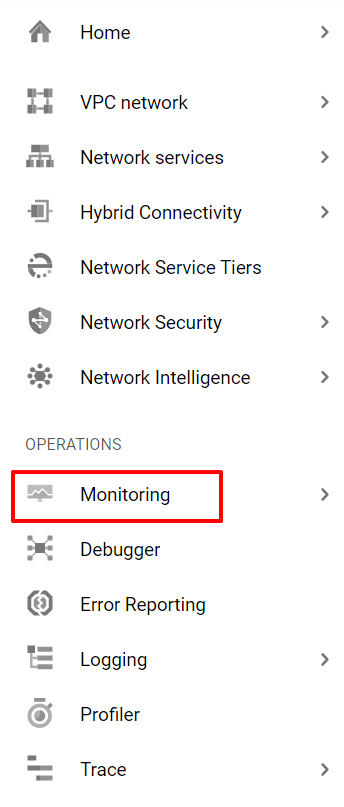
① Sign in to the Google Cloud Console.
② Click [Monitoring] on the left side of the page.
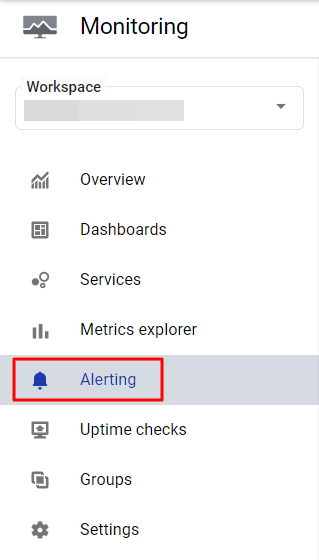
③ Select [Alerting] in the Monitoring menu.
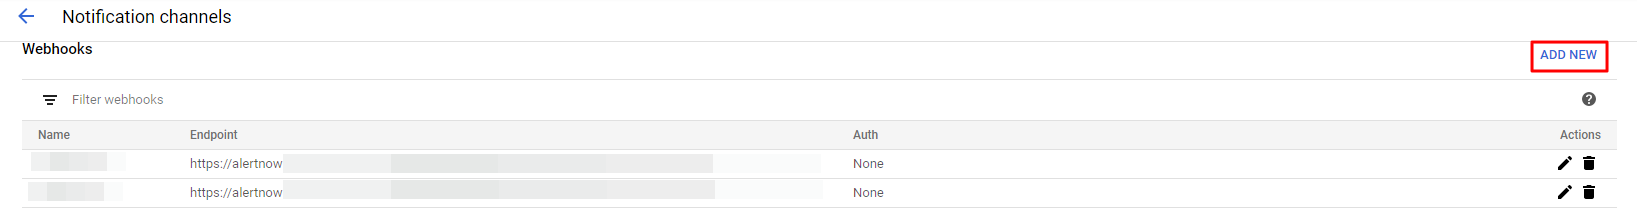
④ Click the [EDIT NOTIFICATION CHANNELS] button in the Alerting page.
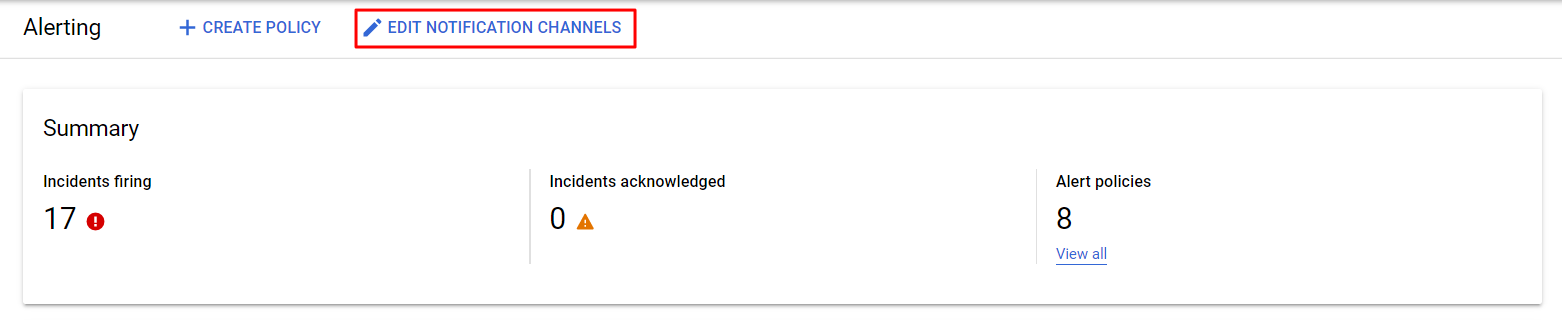
⑤ Click the [ADD NEW] button from the Webhooks.
⑥ Enter Endpoint URL and Webhook name. For the Endpoint URL, you can copy and paste the URL created in AlertNow.
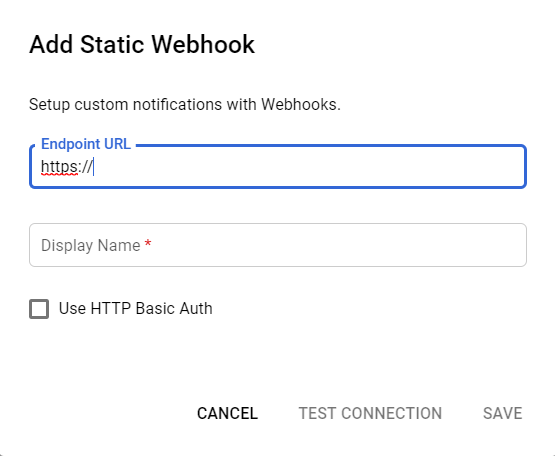
Do not select Use HTTP Basic Auth as AlertNow does not use it.
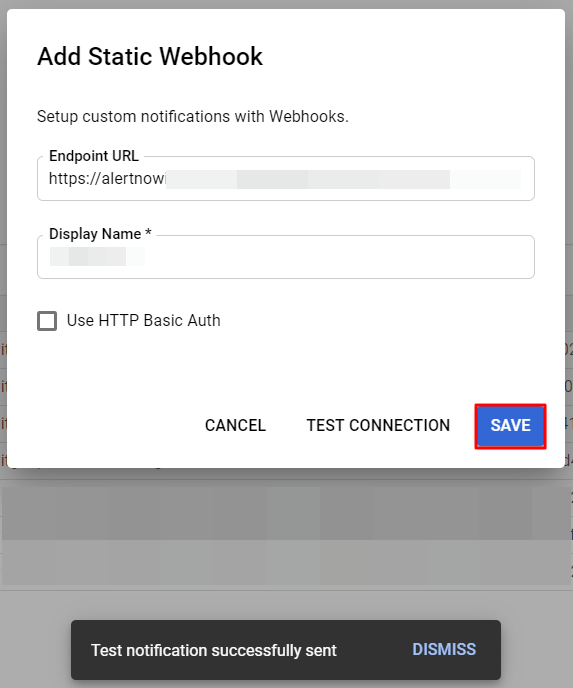
⑦ If you click the [TEST CONNECTION] button, Google Cloud Monitoring will check your URL. Once the verification is completed, “Test notification successfully sent” message will be displayed below and the [SAVE] button will be activated. Click the [SAVE] button to add a webhook.
Adding Alert Policy
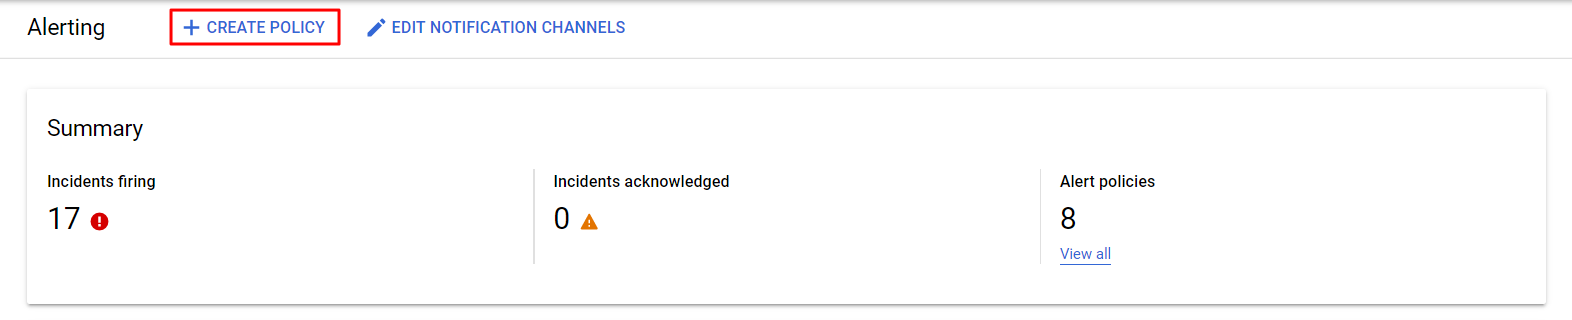
① Click the [CREATE POLICY] button in the Alerting page.
② Click the [ADD CONDITION] button to set the condition for creating alerts.
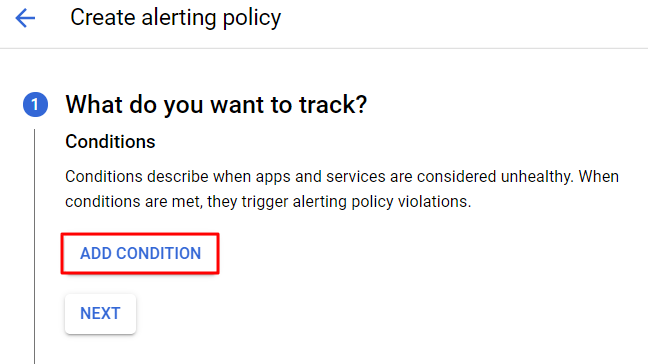
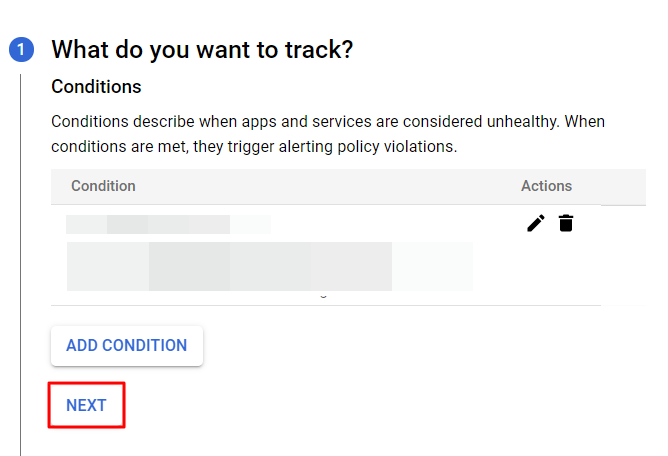
③ Click the [NEXT] button after adding the condition.
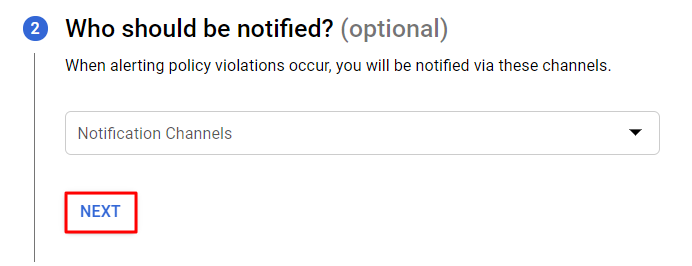
④ Select a notification channel and click the [NEXT] button.
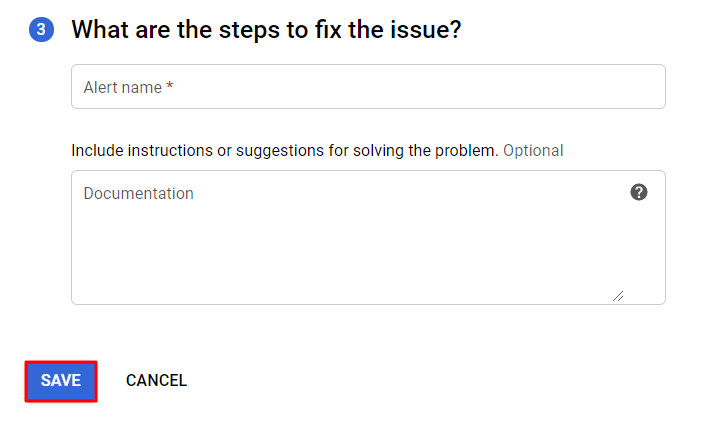
⑤ Enter the policy name and click the [SAVE] button to add an alert policy.
Jennifer5
To connect Jennifer5 with AlertNow, you need to configure Event Rule and Adapter in the Jennifer console.
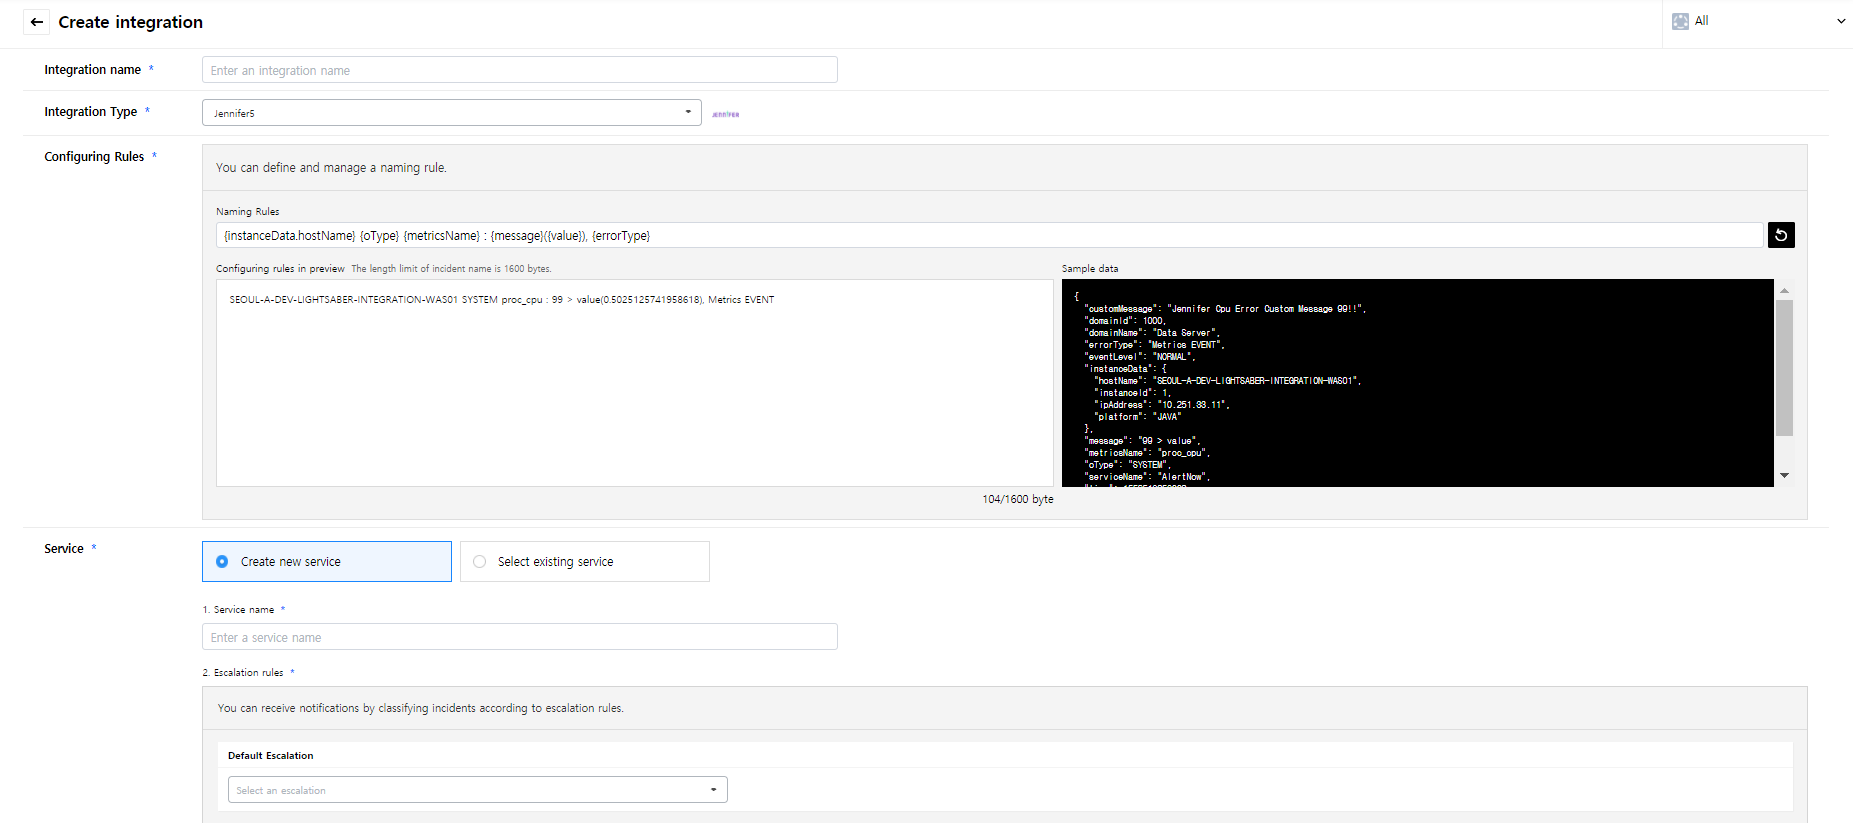
Click the [Create Integration] button located on the top-left side, and select the [Jennifer5] card.
![]()
In the [Create integration] page, enter the required information and then click the [OK] button to create the integration.
![]()
Download Jennifer5 Adapter for AlertNow
To integrate Jennifer, click [Download Jennifer5 Adapter for AlertNow] to download. Jennifer 5 is not compatible with the Jennifer 4.5 version.
Event Rule Configuration
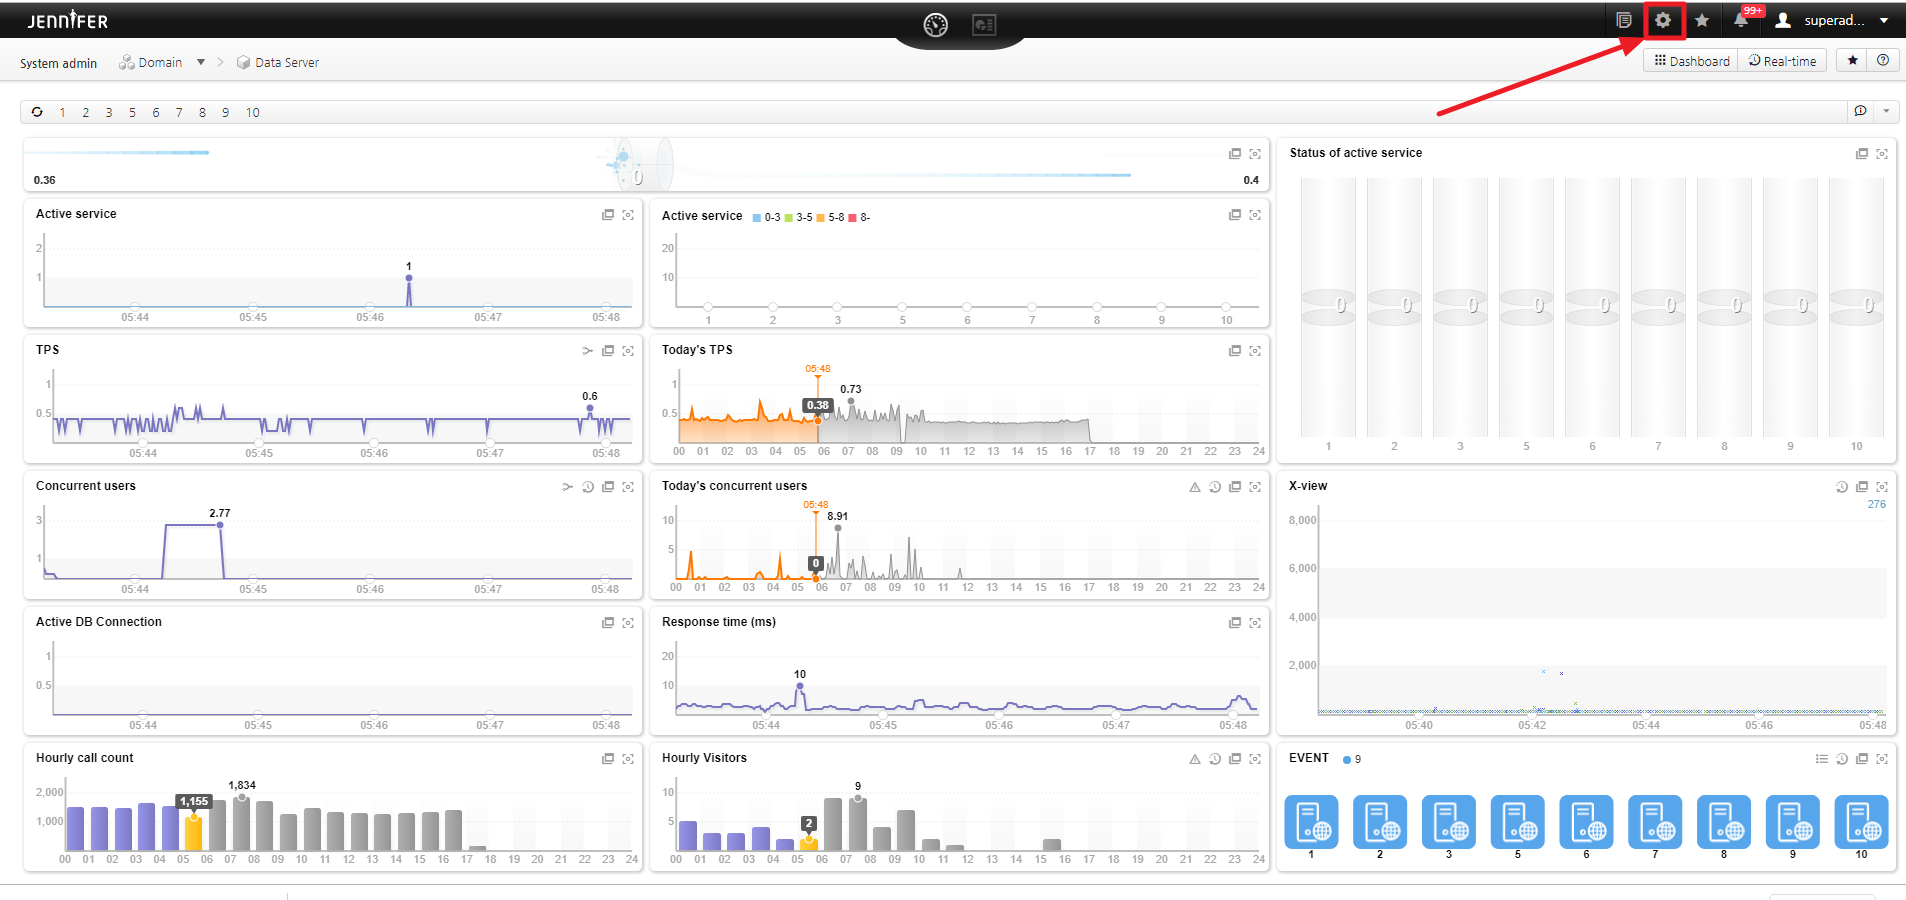
① Sign in with Jennifer, and click the [Management] button located on the top-right of the page.
② Select the [EVENT Rule] in the popup window.
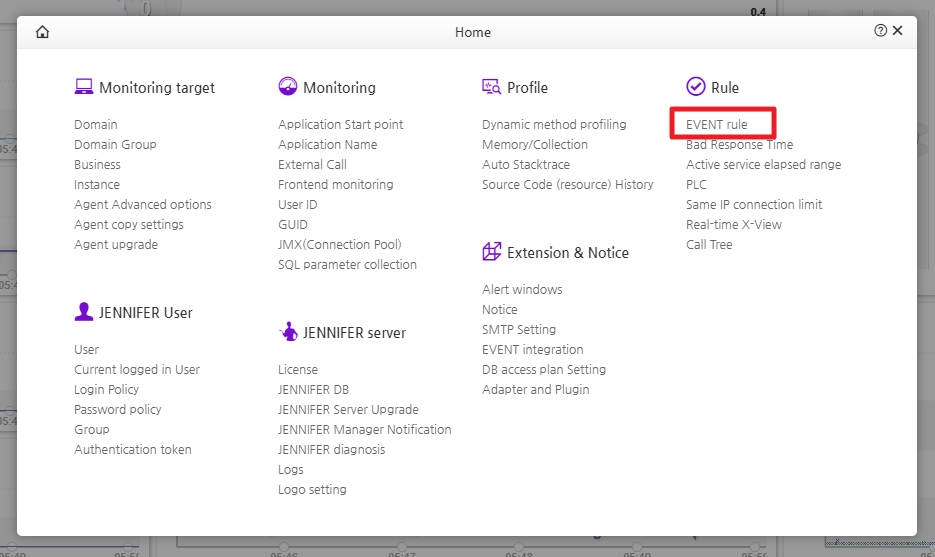
③ Select the [Metrics EVENT] in the EVENT Rule window, and click the [+ Add] button.
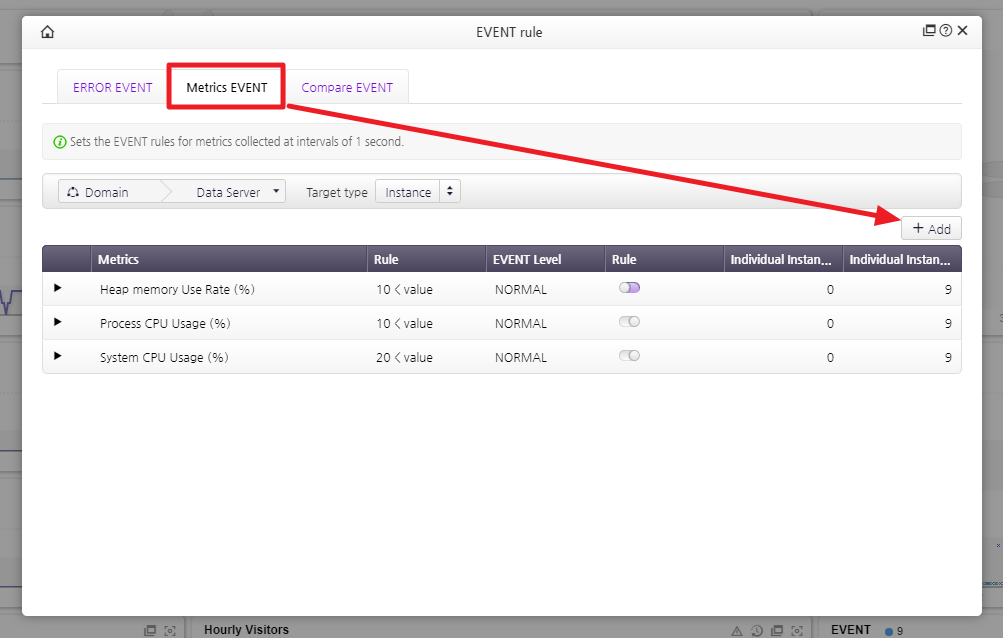
The table below provides descriptions for each event.
| Item | Description |
|---|---|
| Error Event | Configure error events for agents and applications. |
| Metrics Event | To create metrics events, configure metrics values such as CPU and Memory of applications. |
| Compare Event | Create events by comparing past metric data. |
| e.g.) Issue an alarm if the memory usage exceeds 50% compared with the same time last week. |
④ Select Target Type for rule settings.
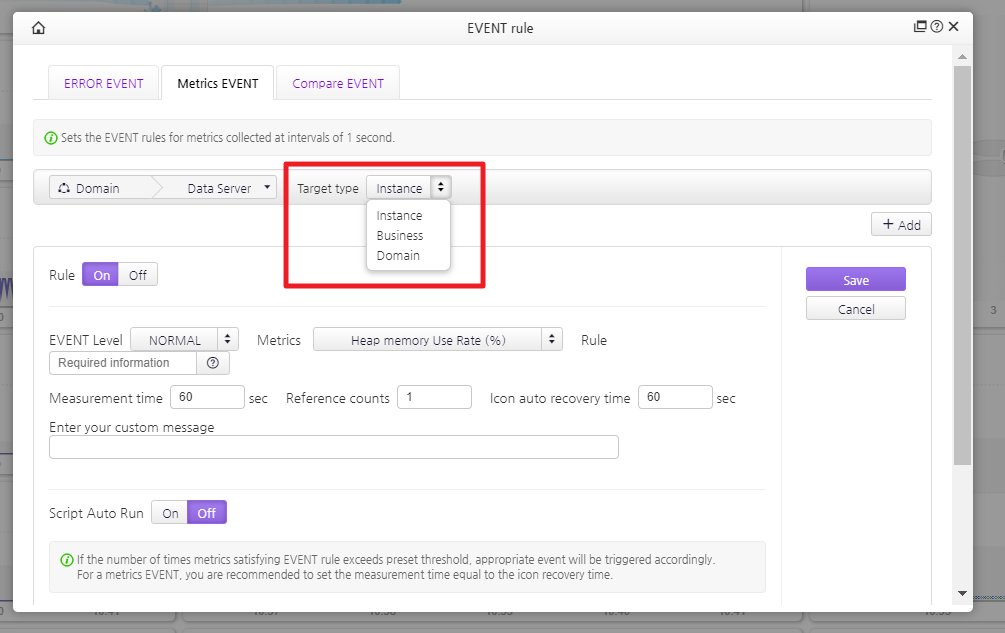
The table below provides descriptions of target types.
- Each target type has different configuration metrics, and target items available for settings are listed below.
| Item | Description |
|---|---|
| Instance | Provide resources metrics such as Memory, CPU, and Network |
| Business | Provide metrics data such as TPS and Response time per Business Group |
| Domain | Provide metrics data such as Bad Response, Visitors, and Instance per Domain Group |
⑤ Select items required for rule settings and click the [Save] button.
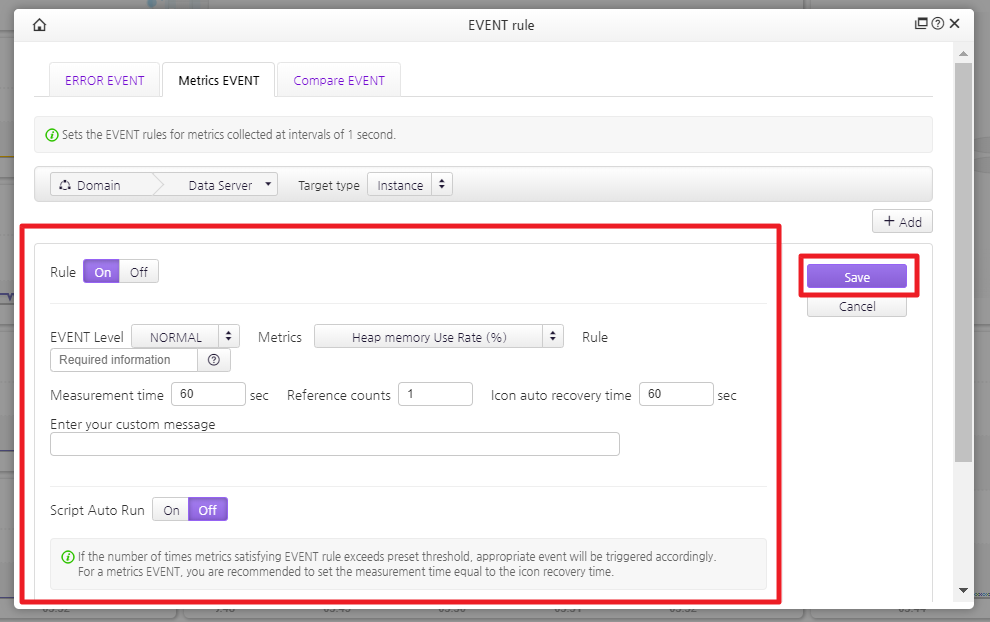
The table below provides detailed descriptions for metrics.
| Item | Description |
|---|---|
| Rule | Enable or Disable an event by selecting On or Off button |
| Severity | Set severity for an event as NORMAL, WARING, or FATAL. It can adjust frequencies of occurrence of events based on the severity. |
| Comparison target | To create an event rule, input value (constant) by using integers and comparison operators, for example, “90 > value” |
| Measurement time (sec)/Reference count | Issue events after comparison target created events that exceed the predetermined measurement time and reference count. |
| Icon Auto Recovery Time (sec) | Time to recover the status from failure to normal automatically |
| Enter Your Customer Message | Enter user-defined messages for issued events. This is not a required input field, but this message will be displayed along with other events that will occur in the future. |
| Script Auto Run | Automatically run user-defined script in the instance where target applications are running when events are issued. |
Configure Adapter
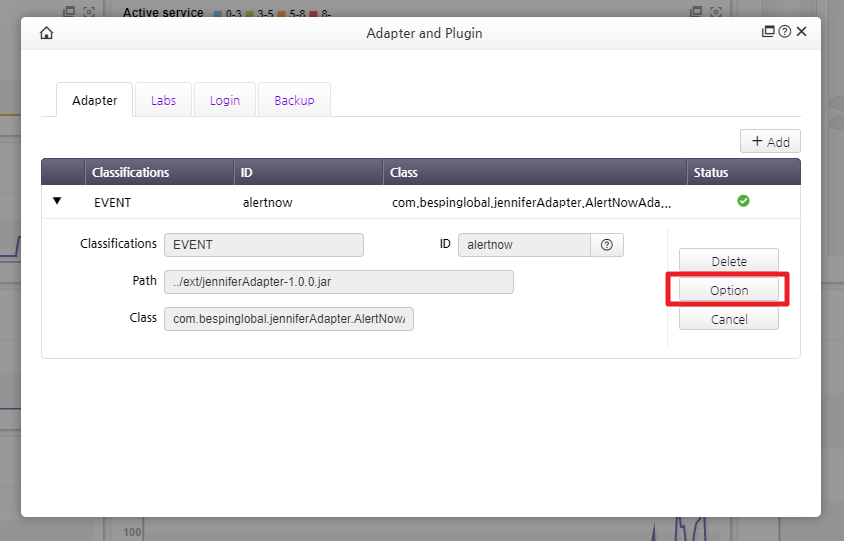
① Click the [Management] button in the Jennifer dashboard, and select [Adapter and Plugin].
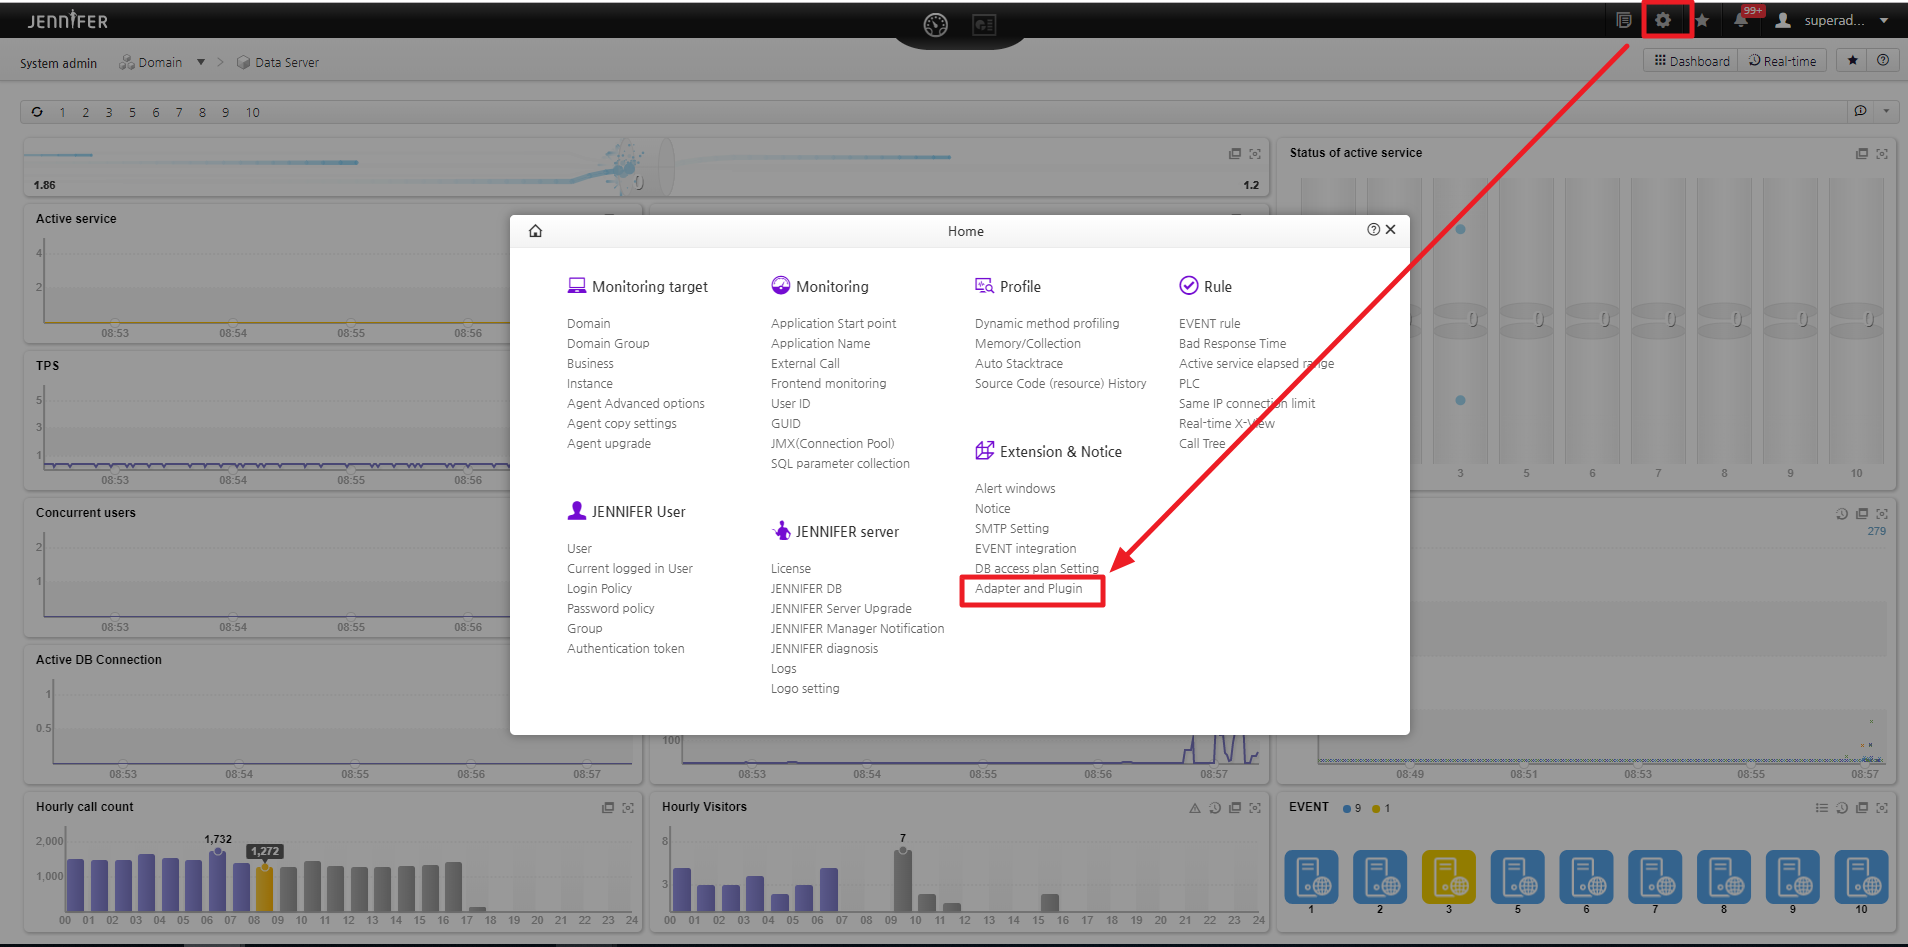
② Click the event in the Adapter and Plugin popup window. The extended page will be appeared displaying Classifications, ID, Path, and Class.
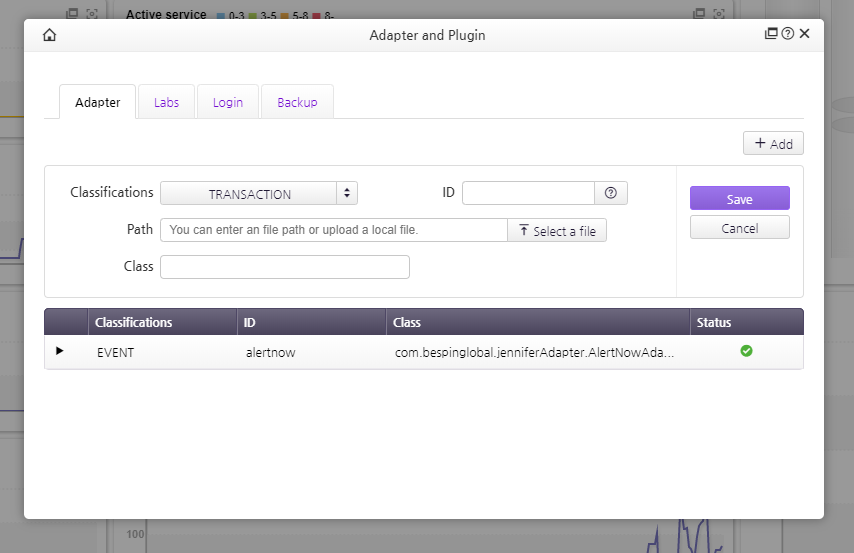
The table below provides descriptions for each item.
| Item | Description |
|---|---|
| Classifications | Type of adapters, and must select Event for AlertNow. |
| ID | ID is a unique ID for configuring adapter, and must type in alertnow for AlertNow. |
| Path | It is the path where distributed adapter is located, and upload jenniferAdapter-1.0.0.jar file that you previously downloaded. |
| Class | It sets EventHandler, and use com.alertnow.jenniferAdapter.AlertNowAdapter that AlertNow provides. |
③ Click the [Option] button after entering the required information.
④ Click the[+ Add] button in the Webhook URL popup window.
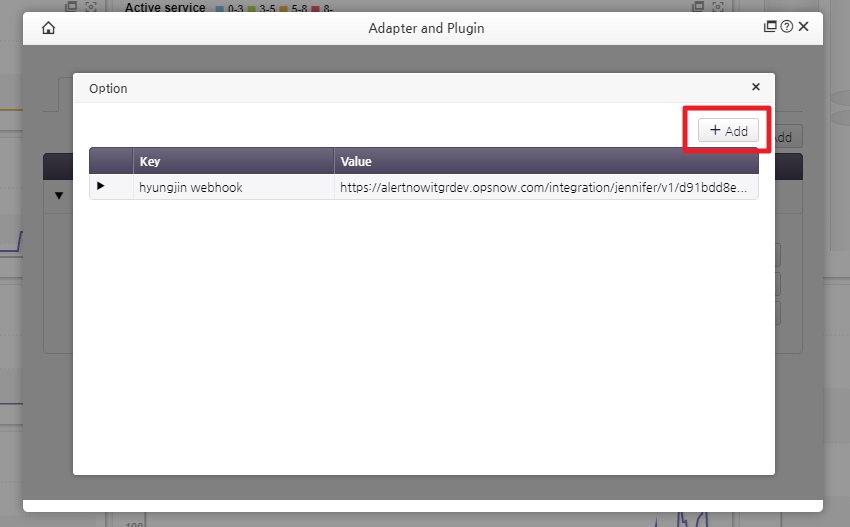
⑤ Enter Key and Value information, and then click the [Save] button.
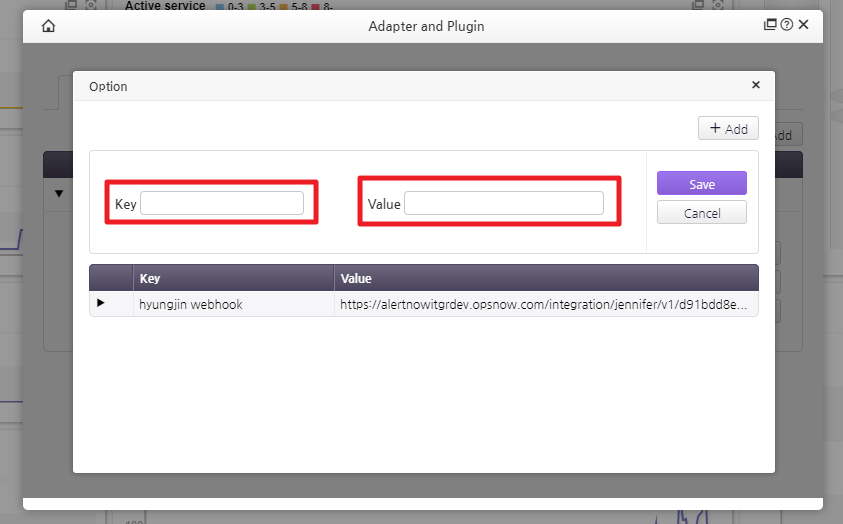
| Item | Description |
|---|---|
| Key | It is a unique value, and it doesn’t work as an identifier so that users can name it freely. |
| Value | Paste Webhook issued from AlertNow and add it. |
Notice: It is required to restart ViewServer after registering the Adapter. AlertNow allows you to add multiple Webhook.
EVENT Integration
① Click the [Management] button after completing Event rule and Adapter settings. Select the [EVENT Integration] in the popup window.
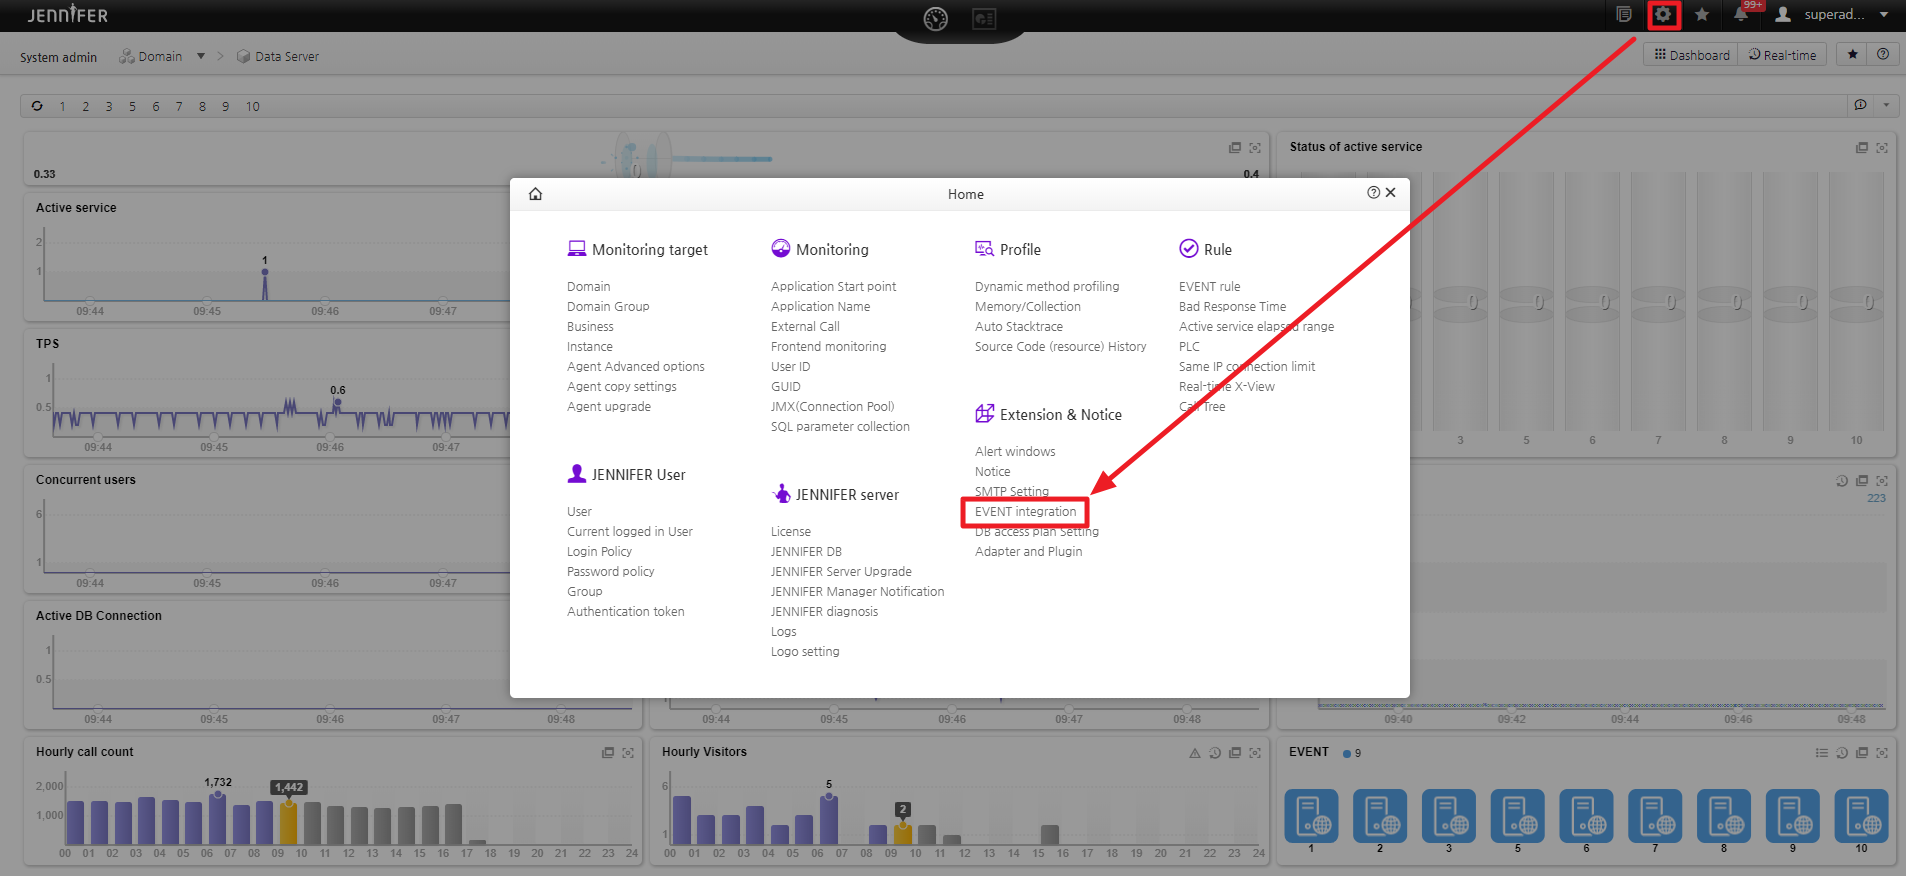
② Configure the severity and push types from EVENT Integration page.
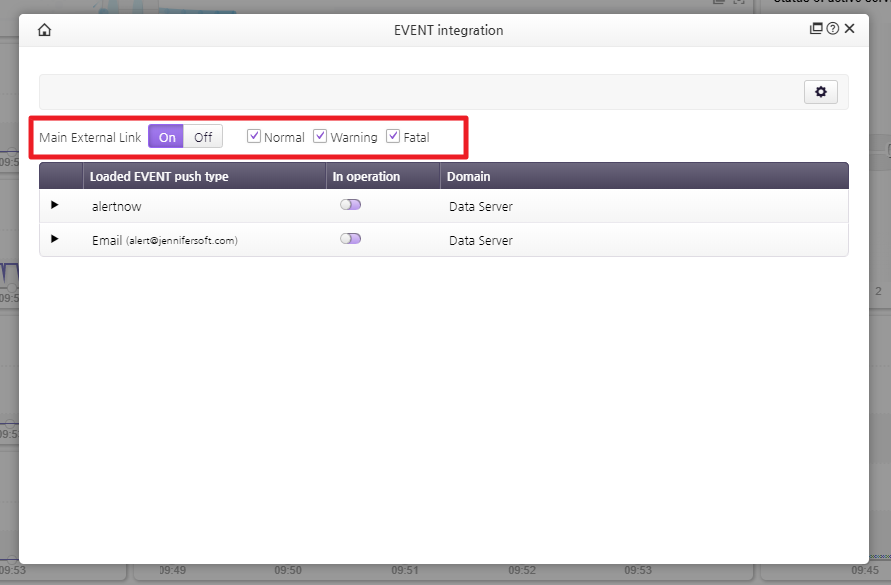
Notice: Normal must be selected in order to issue events. To select a push type, Main External Link should be On.
| Item | Description |
|---|---|
| Main External Link (On/Off) | Enables or disables the feature to push all of the issued events by selecting the On or Off button. |
| Severity | Normal, Warning, or Fatal can be selected for pushing the predetermined event rule, and only selected severity will be pushed. |
③ Set the schedule to Off and Repeat Off functions in the EVENT Integration page. As shown in the figure below, click the [Management] button to set the functions.
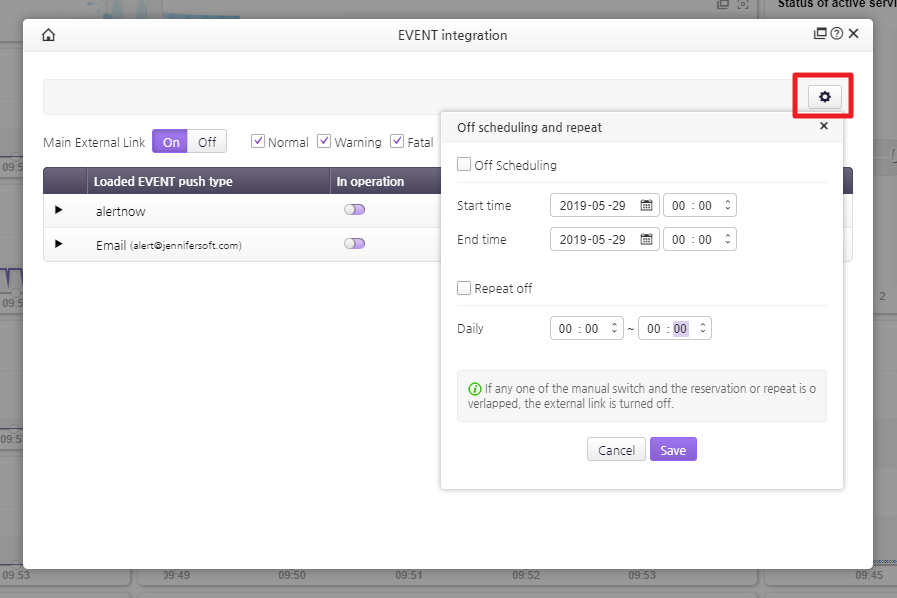
| Item | Description |
|---|---|
| Off Scheduling | Set Start Time and End Time for a certain period to turn off the Event Integration. |
| Repeat Off | Set Start Time and End Time on a daily basis to turn off the Event Integration. |
When Schedule and Repeat Off functions are set, it affects all events listed in the table.
SAMS
💡 Depending on your country or region, this feature may not be available.
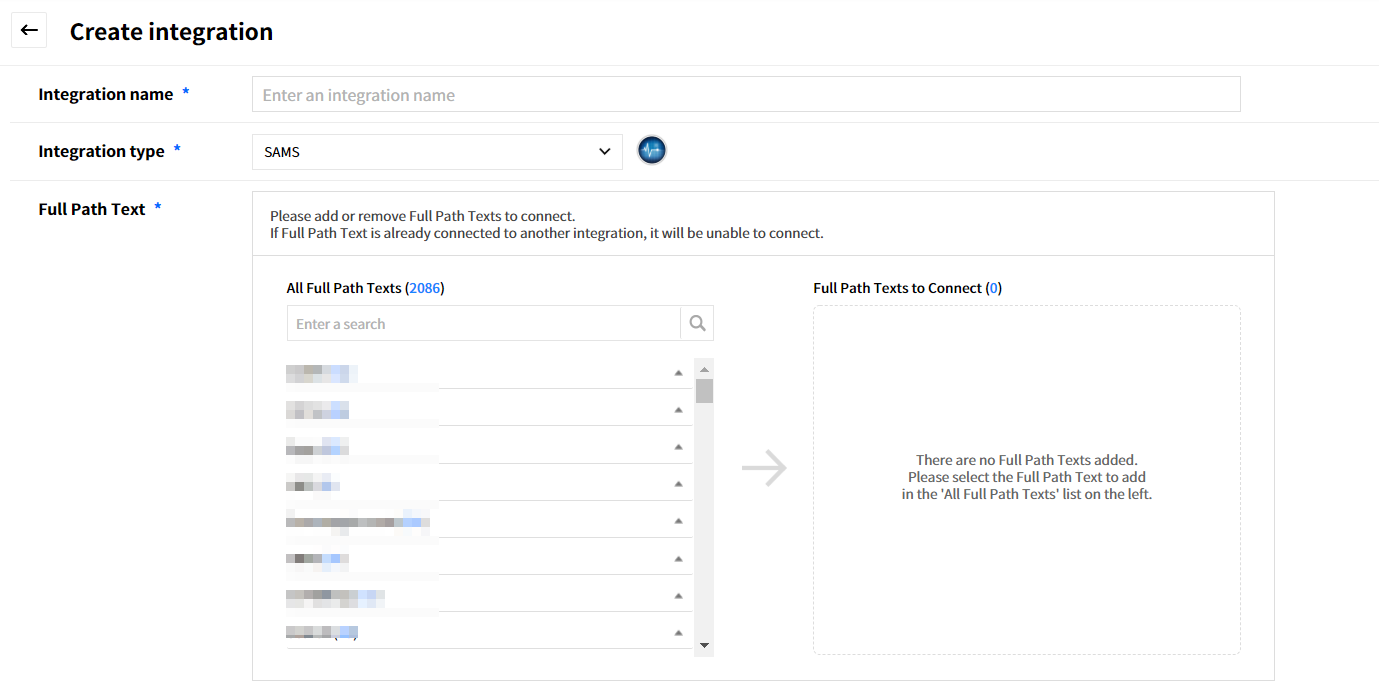
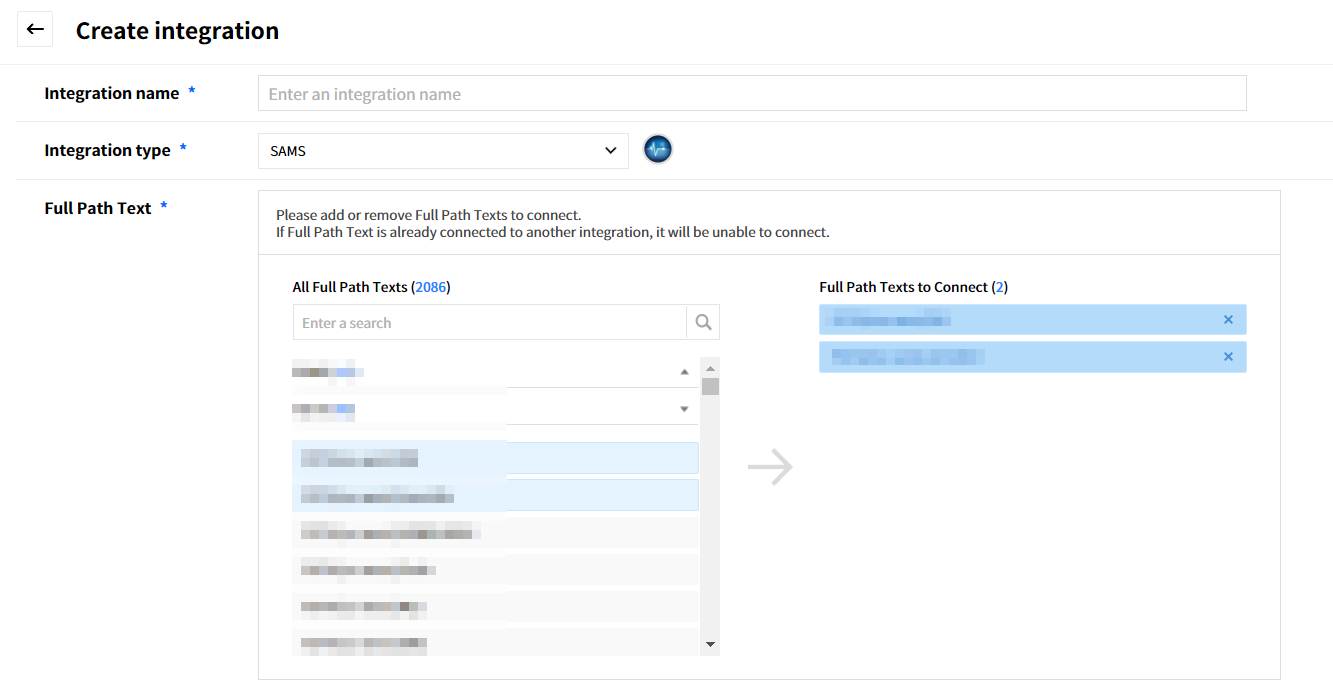
To integrate SAMS with AlertNow, you need to set up Full Path Text additionally.
Click the [Create integration] button located on the top-left side, and select the [SAMS] card.
![]()
Enter an integration name.
![]()
Add to the Full Path Texts to Connect by selecting one or more items to connect from the All Full Path Texts. If you click [ X ] button next to the Full Path Text name, it will be removed from the list.
![]()
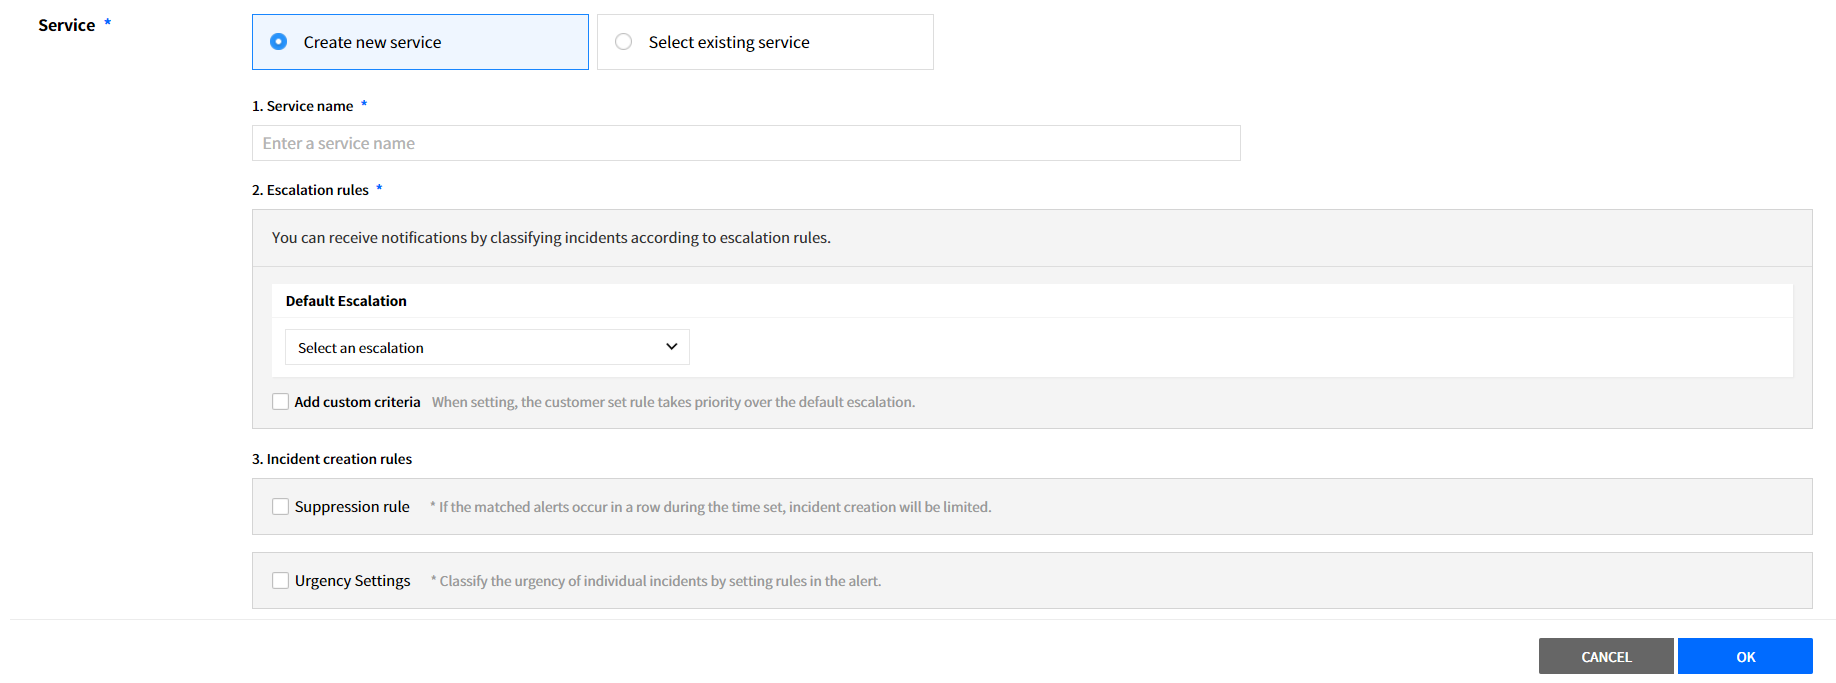
Fill in the required information in the Service field and then click the [OK] button to create integration.
![]()
Prometheus
To connect Prometheus with AlertNow, you must configure Webhook in the Prometheus.
Click the [Create Integration] button located on the top-left side, and select the [Prometheus] card.
![]()
In the [Create integration] page, enter the required information and then click the [OK] button to create the integration.
![]()
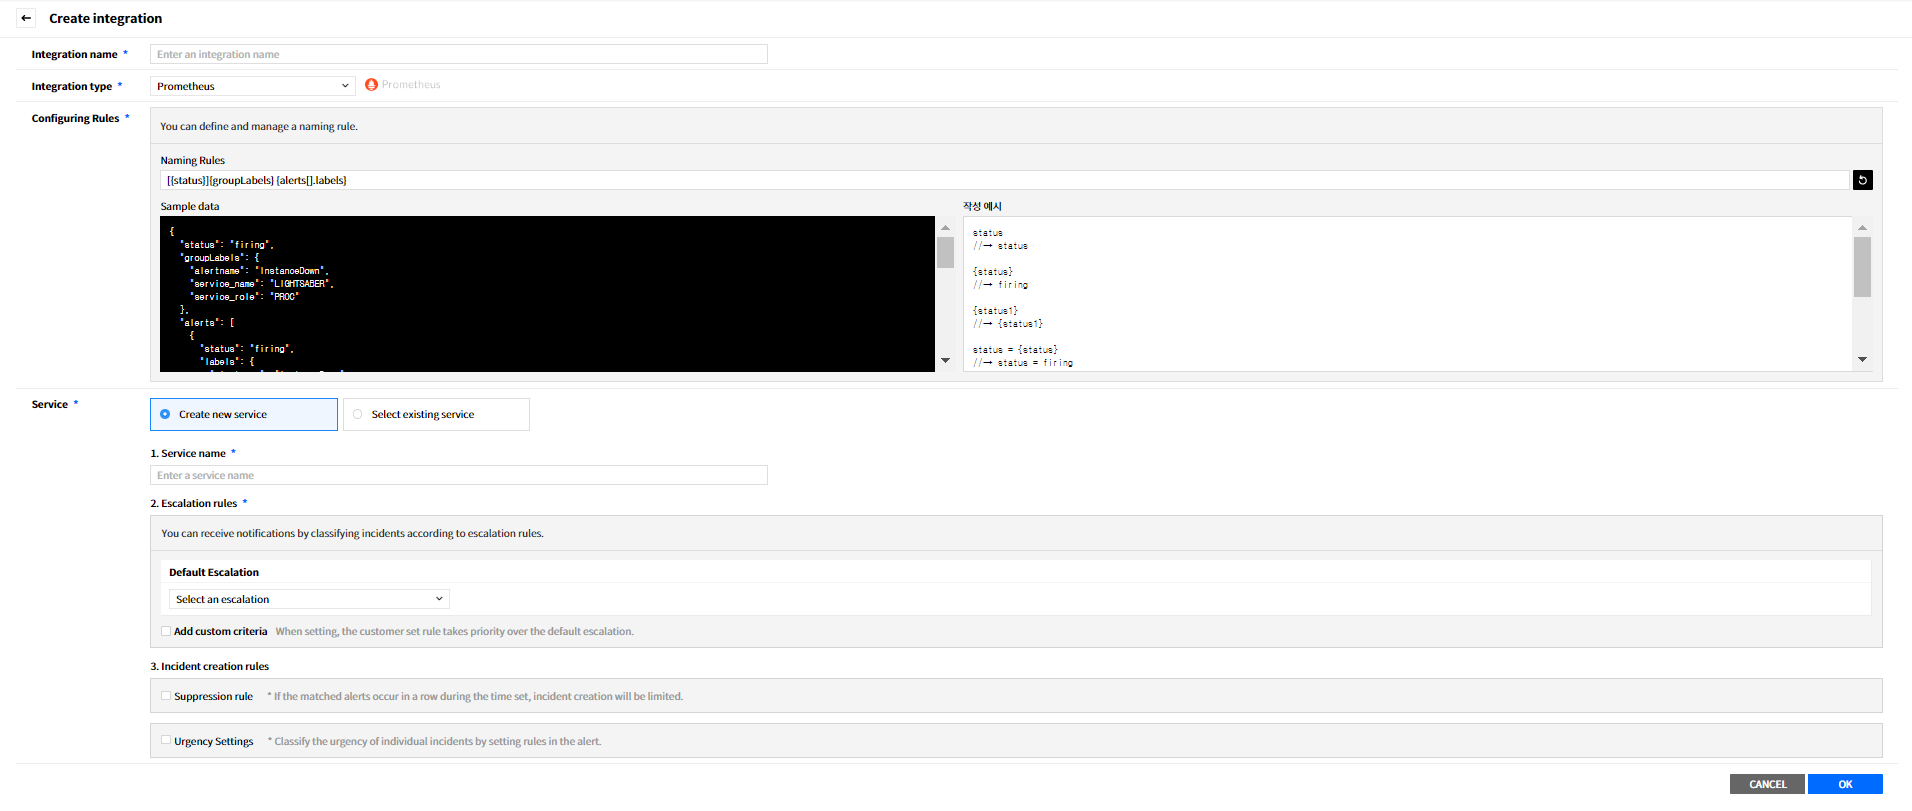
Webhook Configuration
① Sign in to Prometheus.
② Click [DOWNLOAD] to install and configure Alertmanager required for this integration.
③ Create an Alertmanager configuration file. You can find an example configuration file on the GitHub.
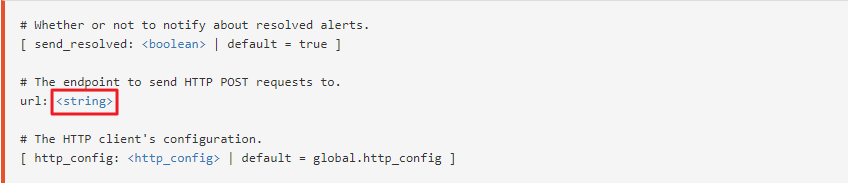
④ Copy the URL created in AlertNow and paste it to Webhook to complete the configuration.
Grafana
To connect Grafana with AlertNow, you must configure Webhook in the Grafana.
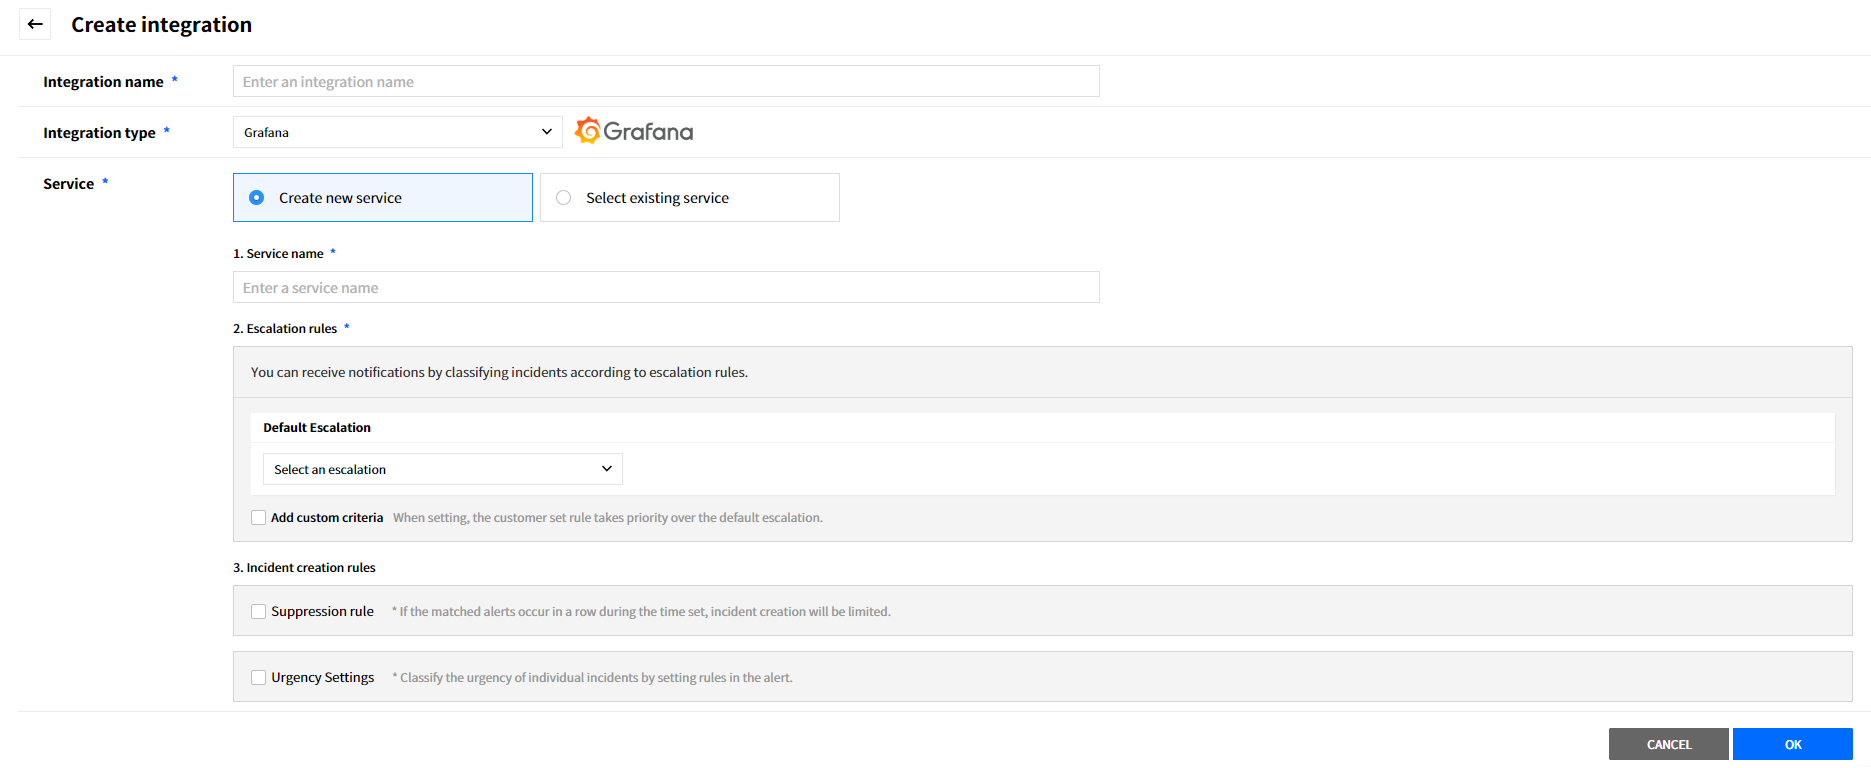
1.Click the [Create Integration] button located on the top-left side, and select the [Grafana] card.
- In the [Create integration] page, enter the required information and then click the [OK] button to create the integration.
![]()
Webhook Configuration
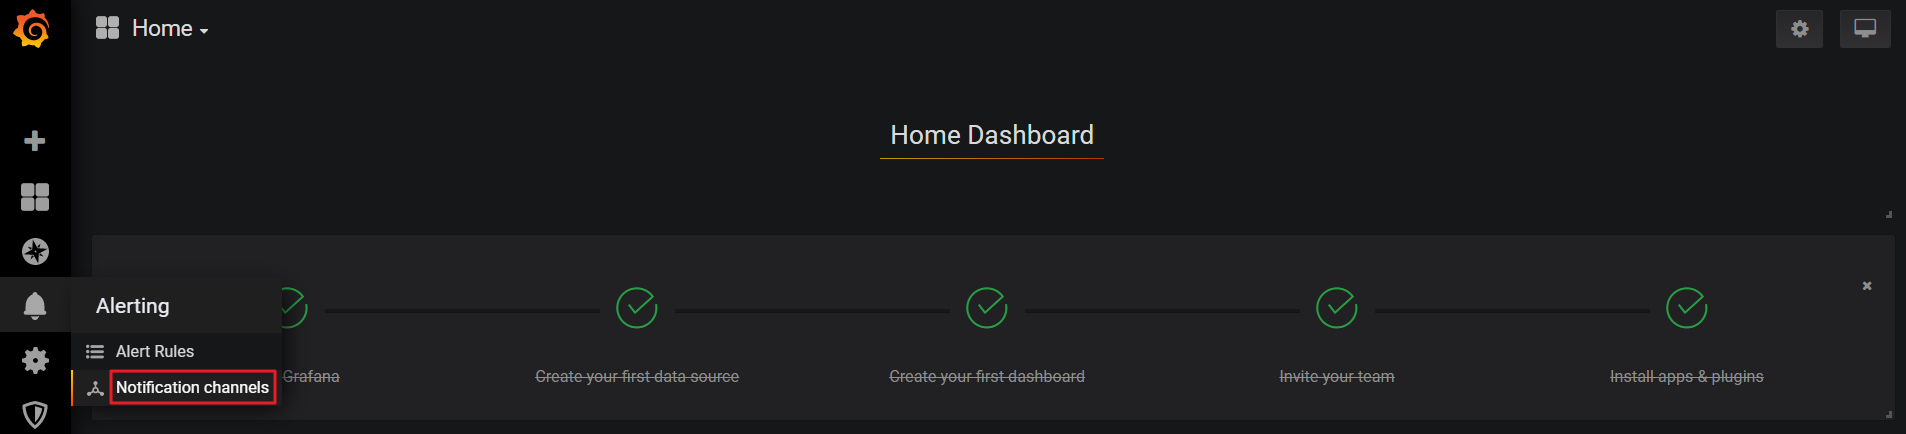
① Sign in to Grafana, and click [Notification Channels] located on the left side of the page.
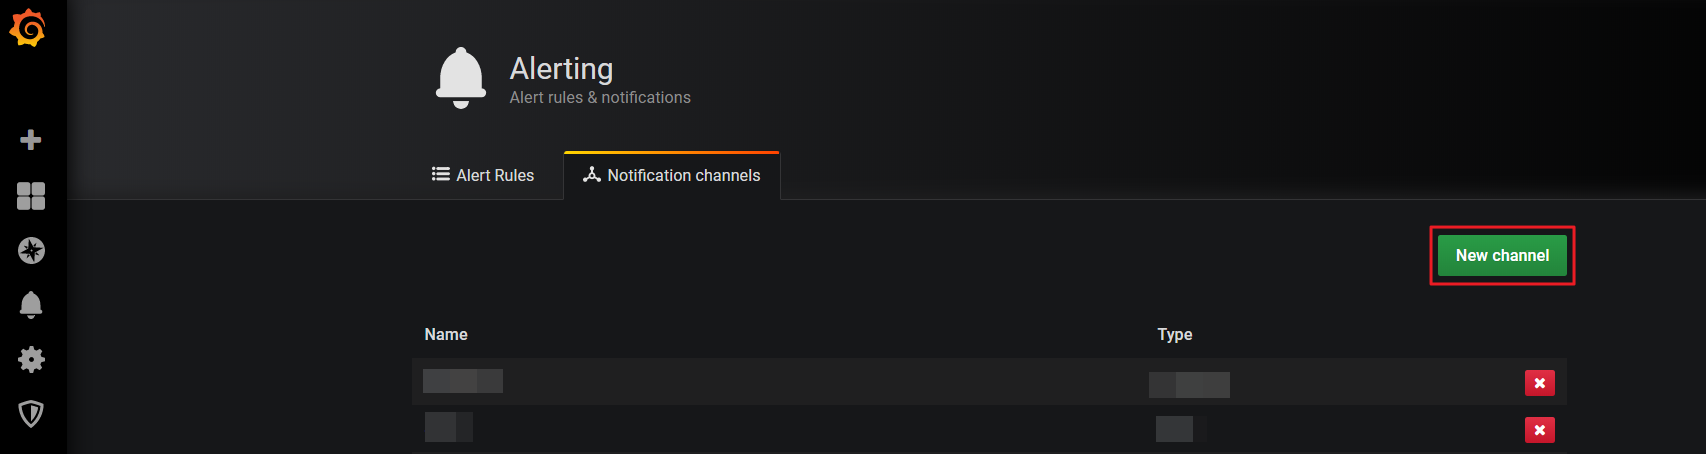
② Click the [New channel] button in the [Notification Channels page.
③ Enter a new channel’s name and select a type as Webhook. Then copy the URL created in AlertNow and paste it to URL field in the Webhook Settings. Click the [Save] button to create a new channel.
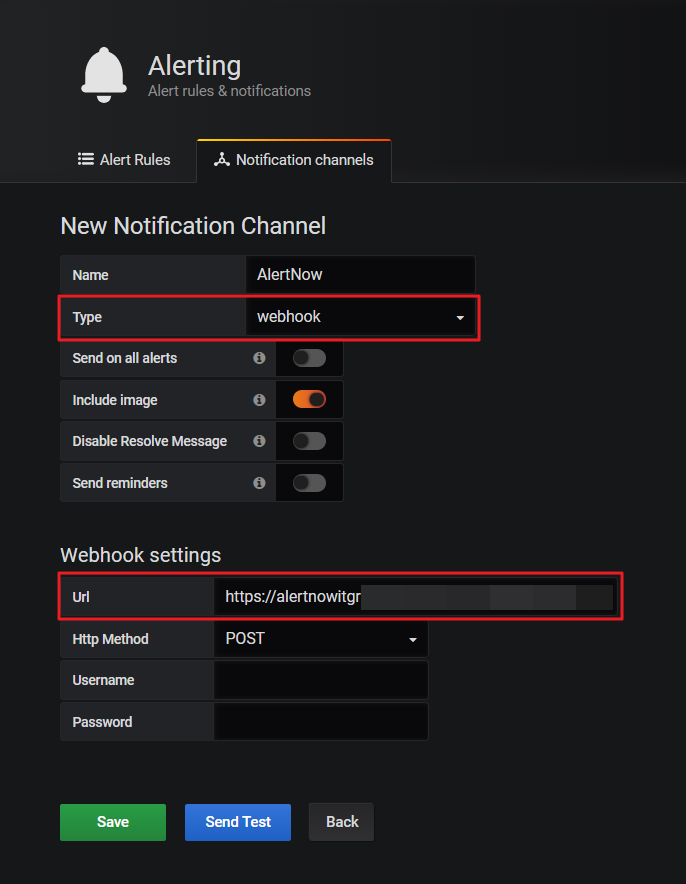
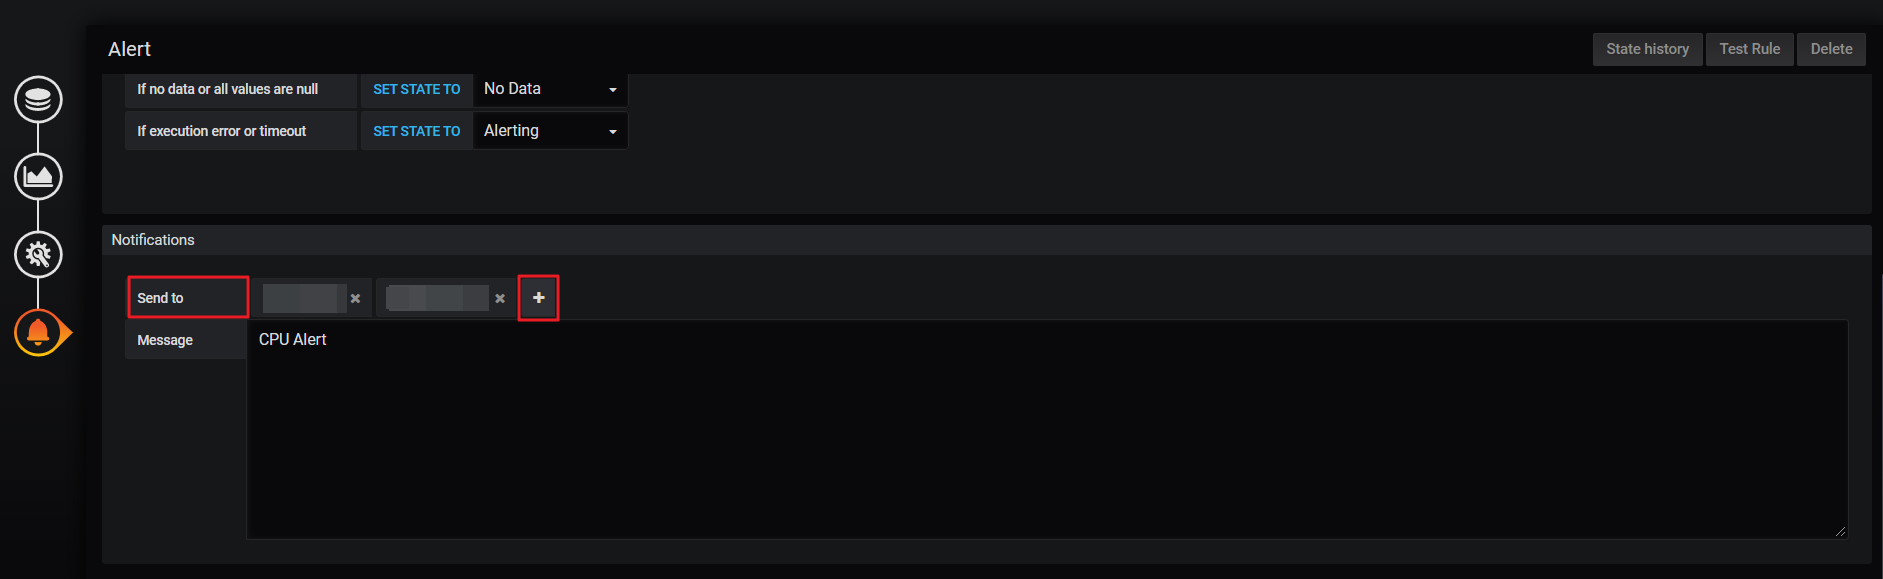
④ Select the [Alert Rules] located on the left side of the page.
⑤ Select the alert to connect and then add the created channel to Send to in Notifications to complete the configuration.
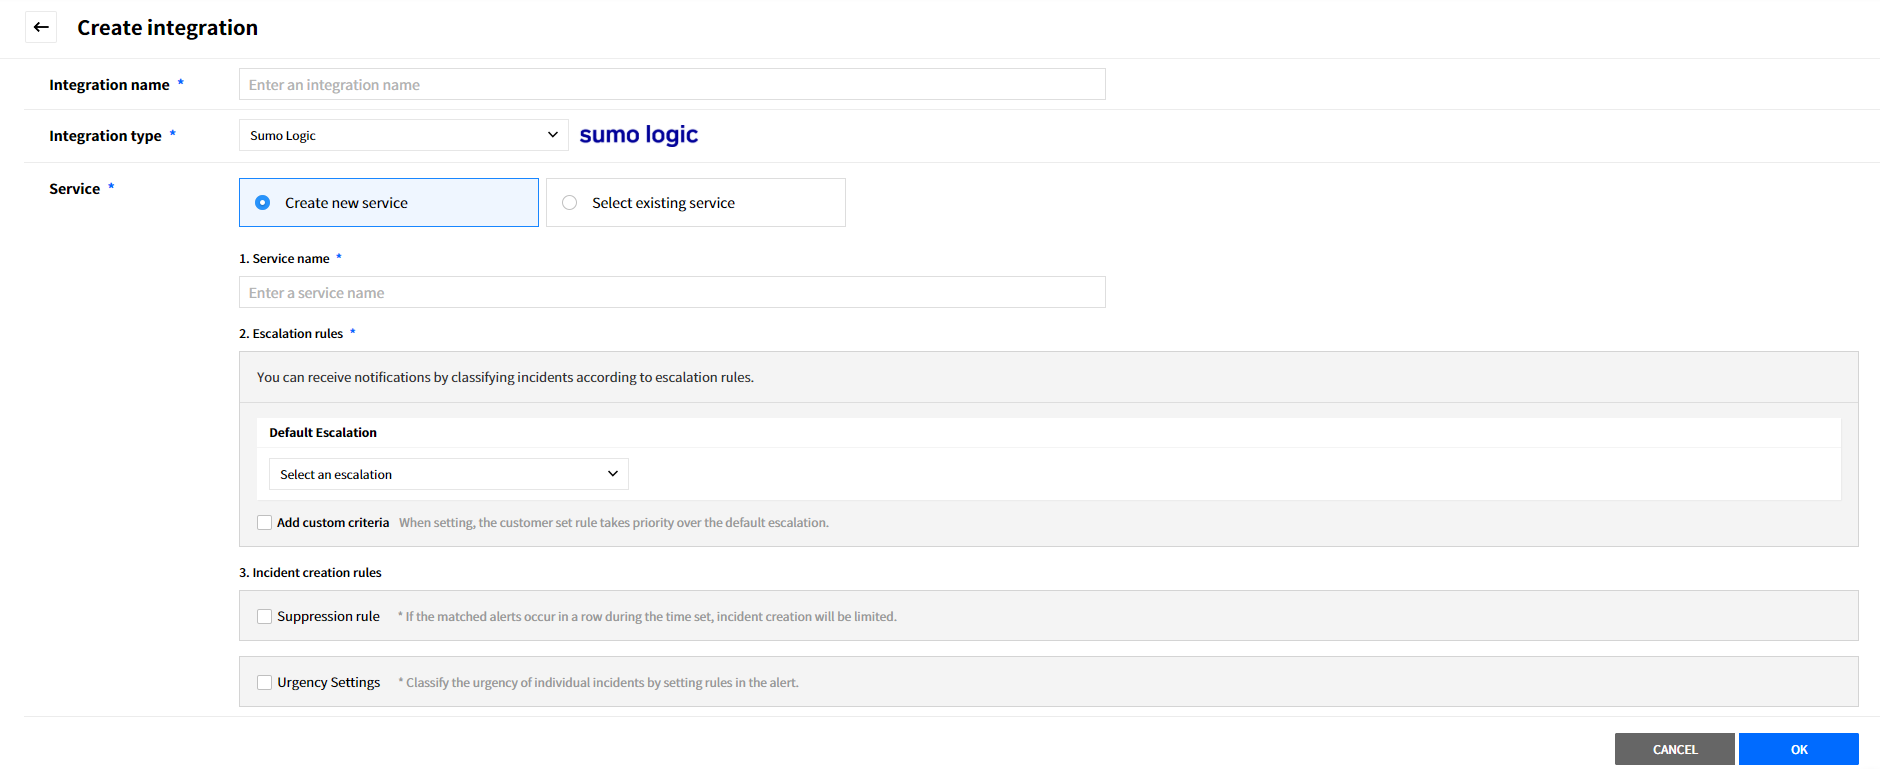
Sumo Logic
To integrate Sumo Logic with AlertNow, you must connect Webhook and add Monitor in Sumo Logic.
Click the [Create Integration] button located on the top-left side, and select the [Sumo Logic] card.
![]()
In the [Create integration] page, enter the required information and then click the [OK] button to create the integration.
![]()
Set up a Webhook Connection: Metric
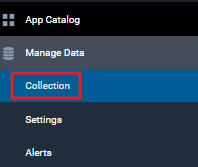
① Sign in to Sumo Logic, and select [Manage Data] > [Collection] located on the left side of the page.
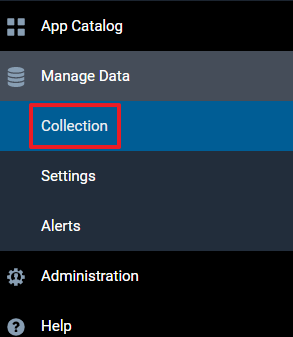
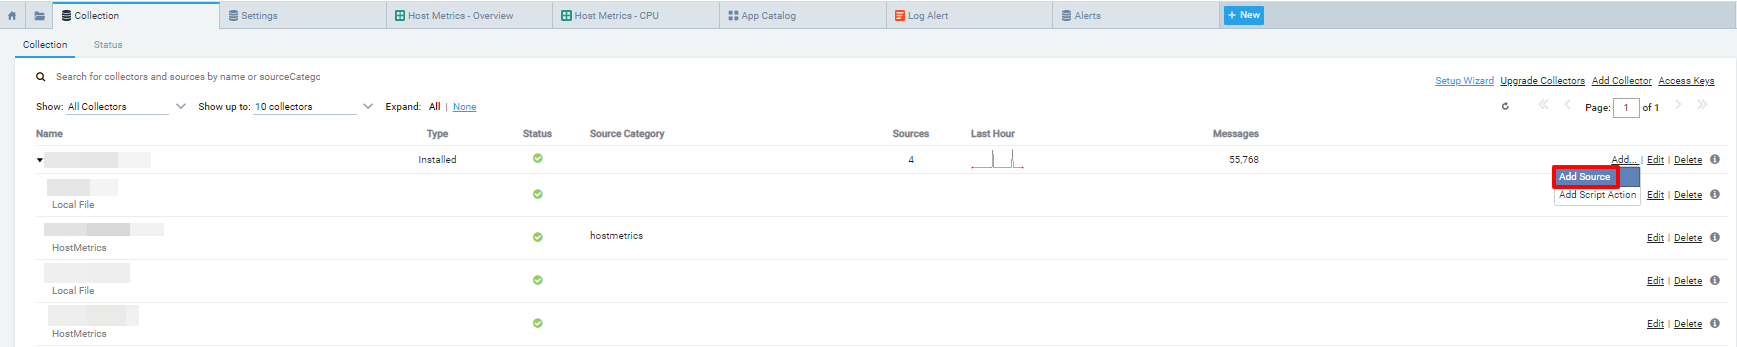
② Select [Add] > [Add Source] in the Collection page.
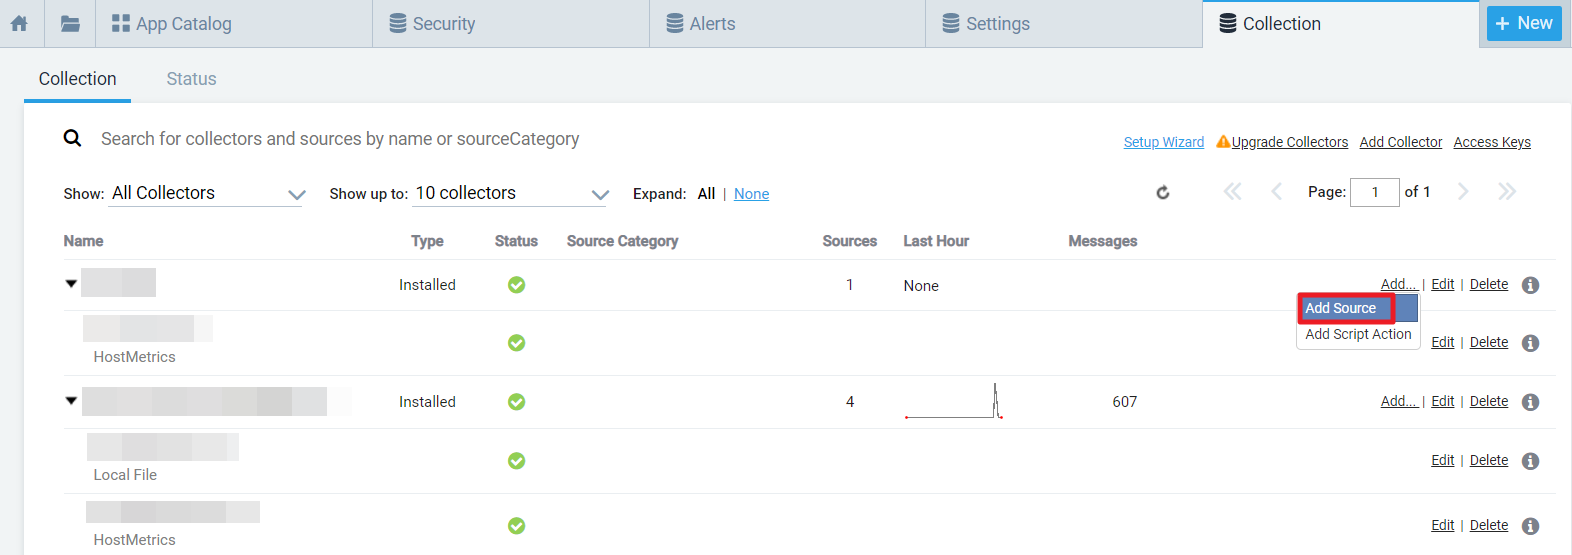
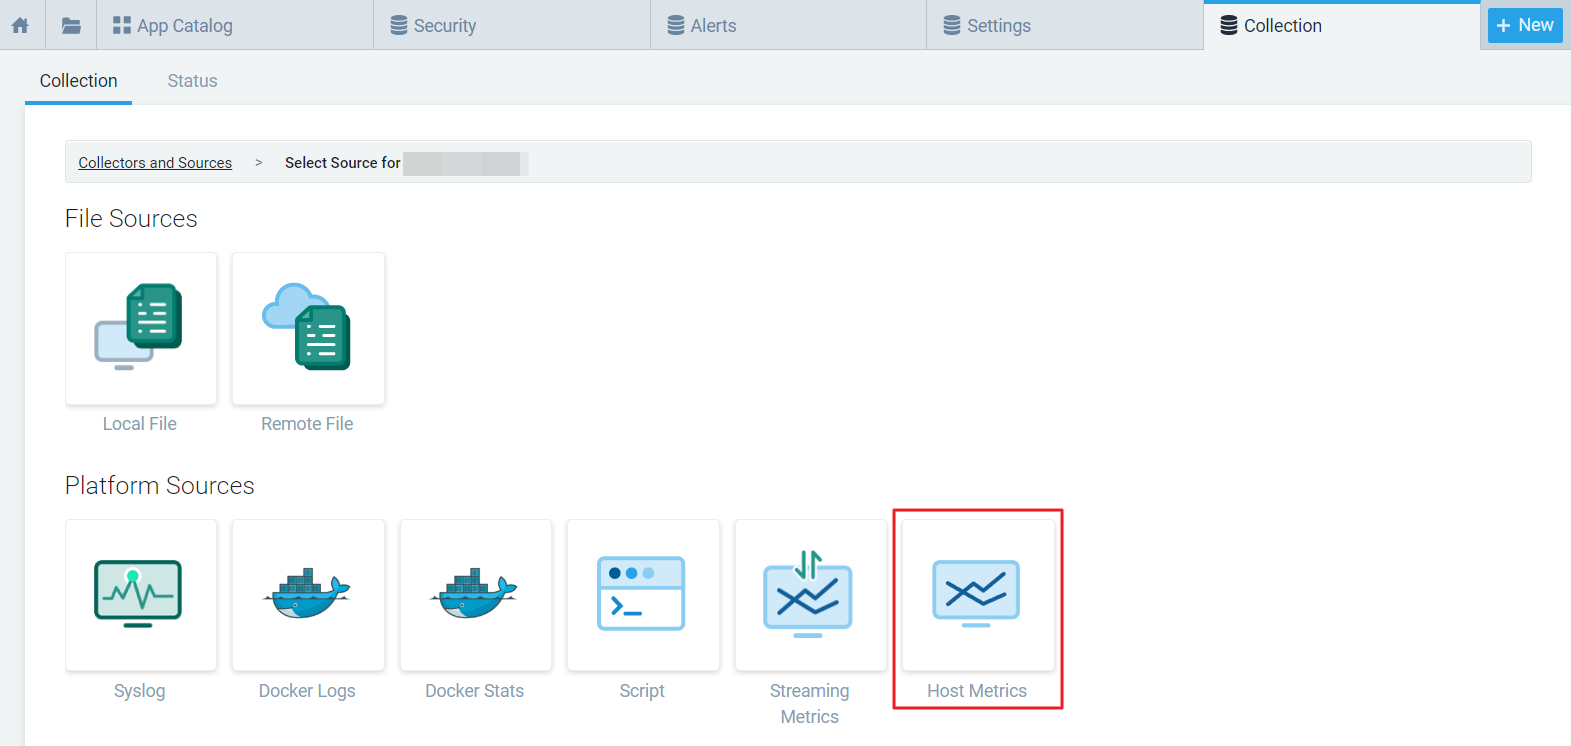
③ Select [Host Metrics].
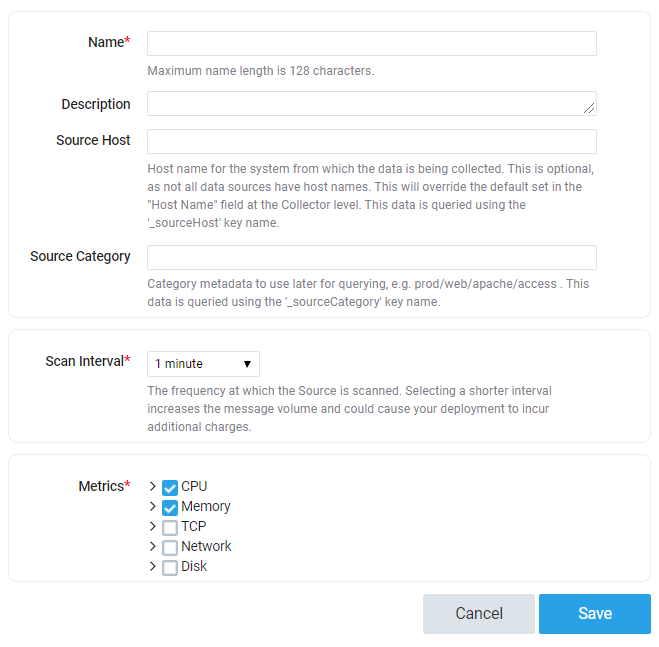
④ Enter a Name and an optional description. Then, select the required items and click the [Save] button.
⑤ Select [Manage Data] > [Settings] > [Connections] located on the left side of the page.
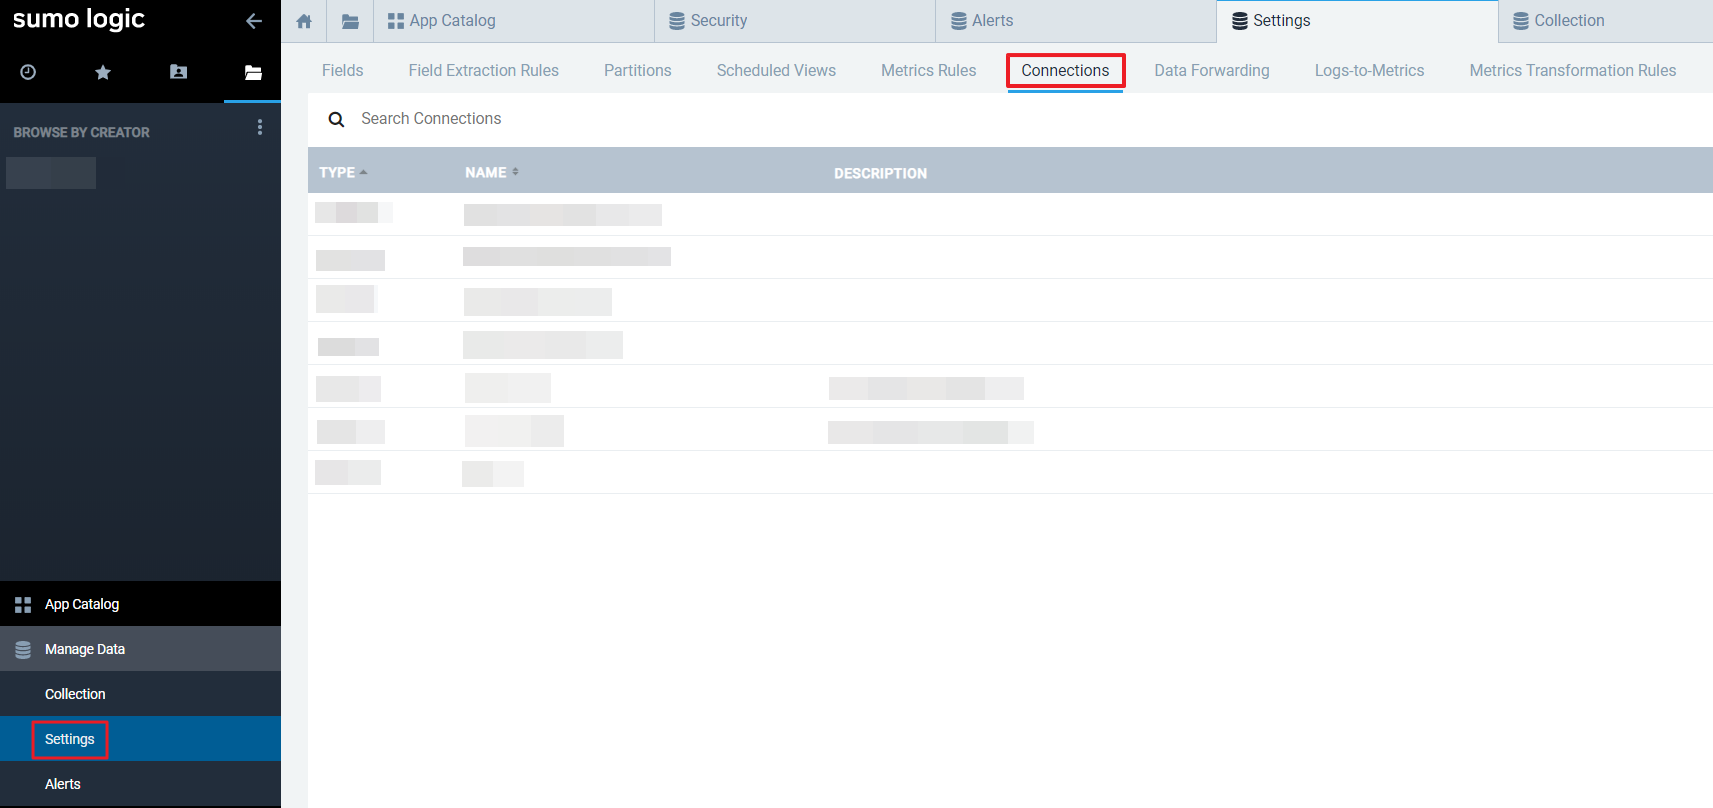
⑥ Click the [ + ] button to add a new connection.
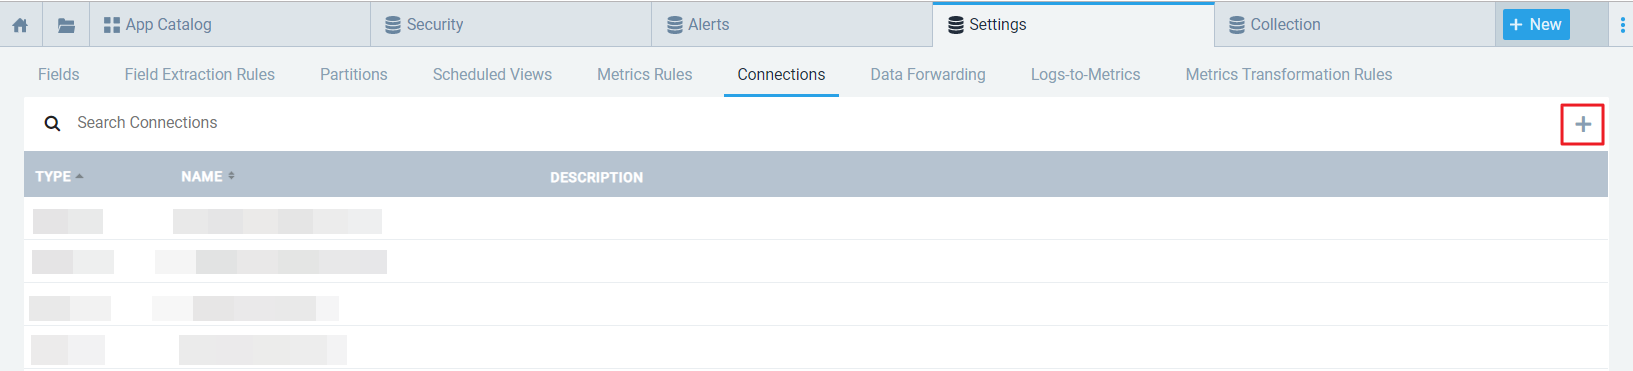
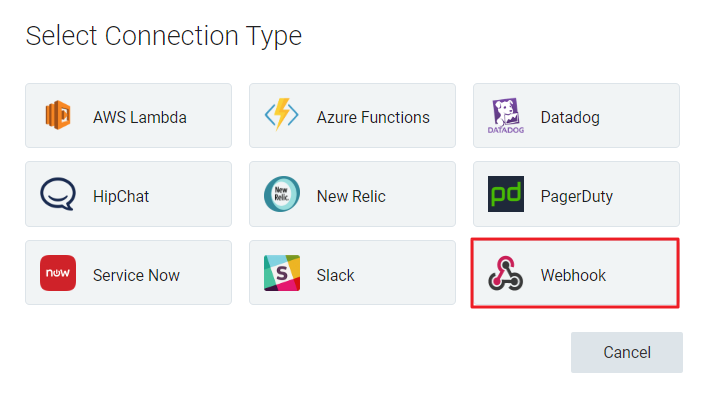
⑦ Select Webhook as Connection Type.
⑧ In the Create Webhook Connection dialog, enter a Name for the connection, an optional description. Then copy the URL created in AlertNow and paste it to URL field. Populate Payload field with the following content. Then, click the [Save] button.
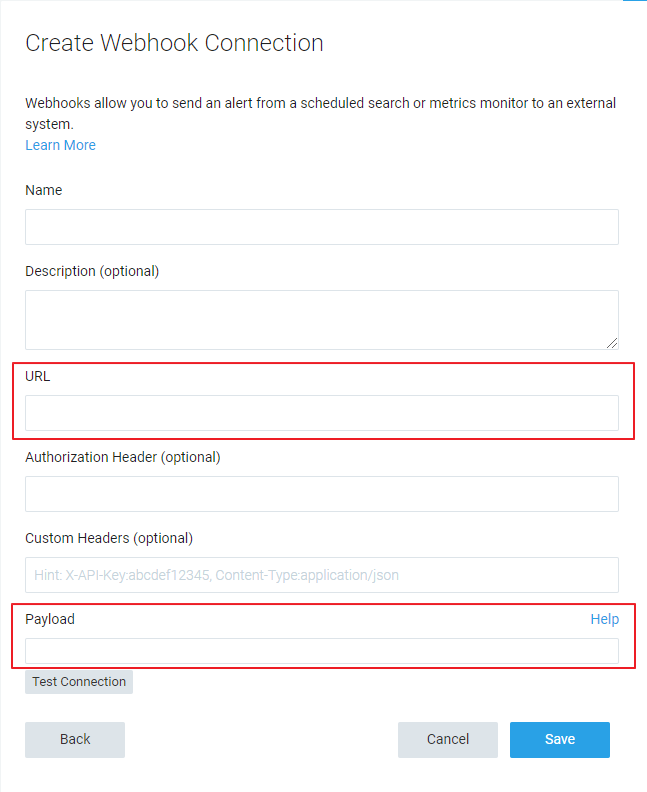
- Payload Sample
Metric
                    {
                      "alrtTypeCd": "metric",
                      "searchName": "{{SearchName}}",
                      "searchDescription": "{{SearchDescription}}",
                      "searchQuery": "{{SearchQuery}}",
                      "searchQueryUrl": "{{SearchQueryUrl}}",
                      "timeRange": "{{TimeRange}}",
                      "triggerTime": "{{FireTime}}",
                      "alertThreshold": "{{AlertThreshold}}",
                      "alertSource": "{{AlertSource}}",
                      "alertStatus": "{{AlertStatus}}",
                      "alertID": "{{AlertID}}"
                    }
Add Monitor
① Select Manage Data > Alerts > Add Monitor in the Sumo Logic console.
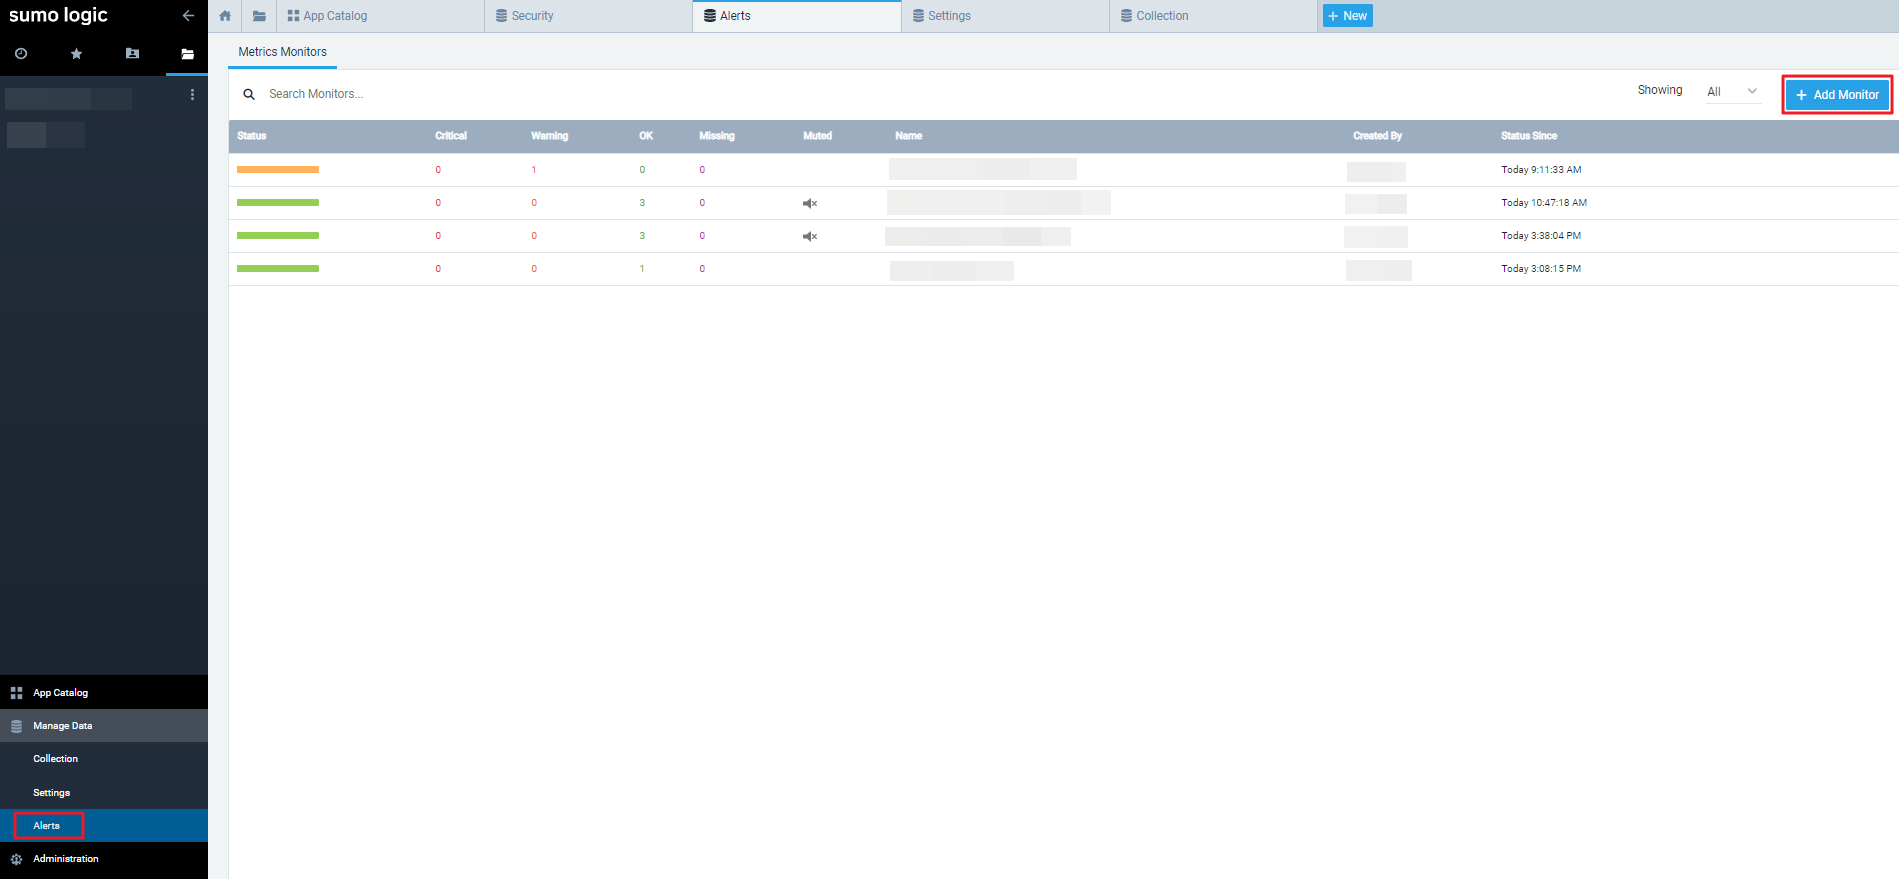
② Populate Query field and select the created one from list of Send Notification. Enter a Name for monitor and an optional description, and then click the [Save] button.
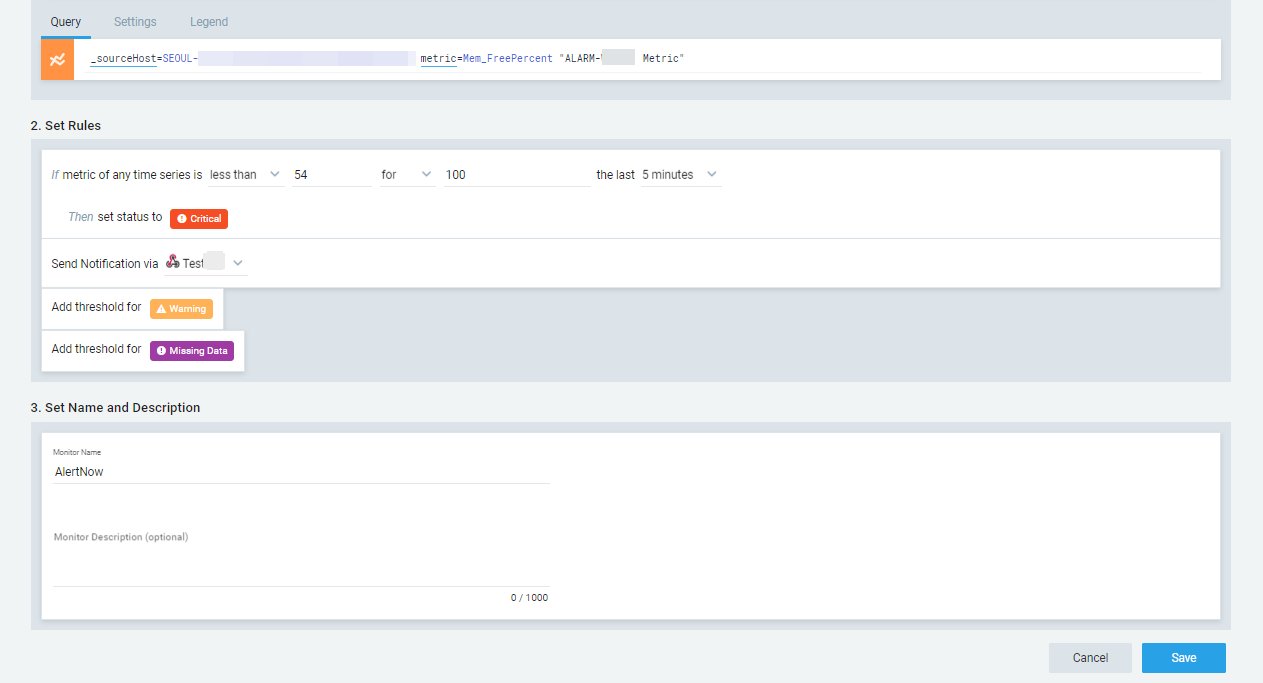
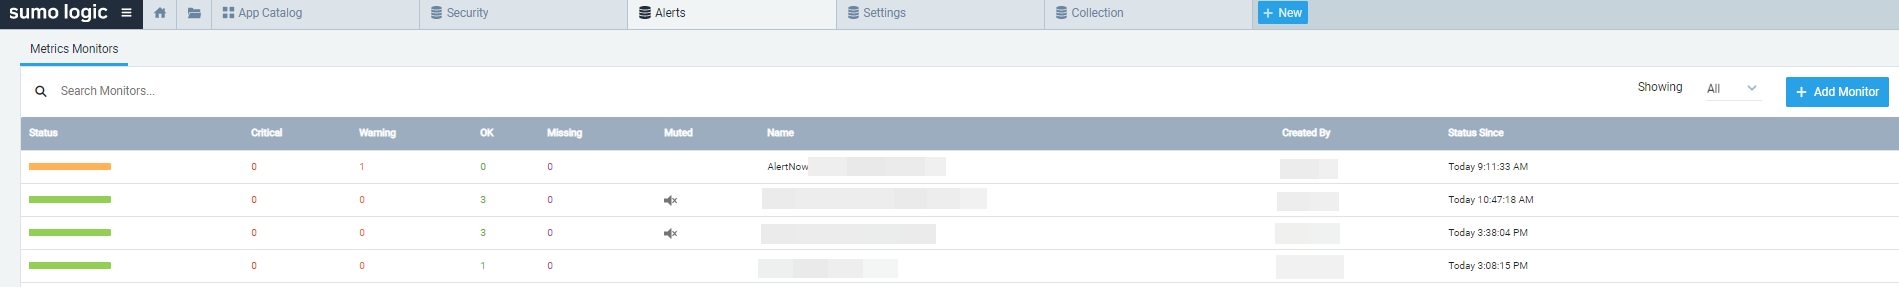
③ The created monitor will be displayed in Alerts of Manage Data menu.
Set Up a Webhook Connection: Log
① Sign in to Sumo Logic, and select Manage Data > Collection on the navigation bar.
② Select Add > Add Source in the Collection page.
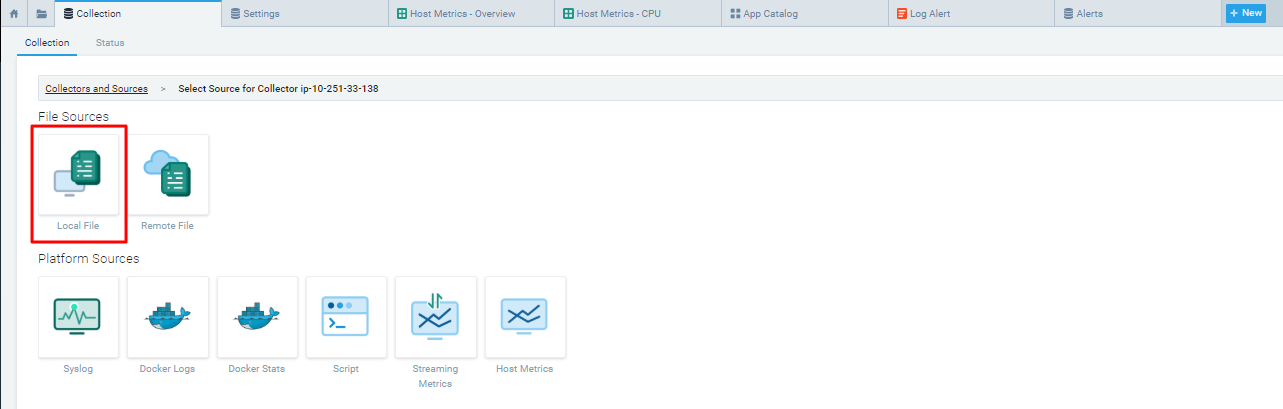
③ Select [Local File].
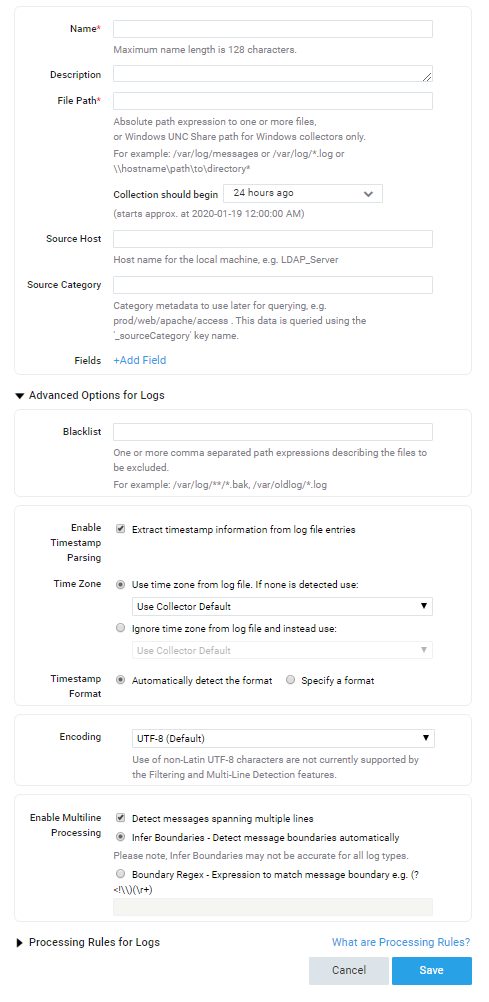
④ Fill in the required fields such as Name and File Path. Then click the [Save] button.
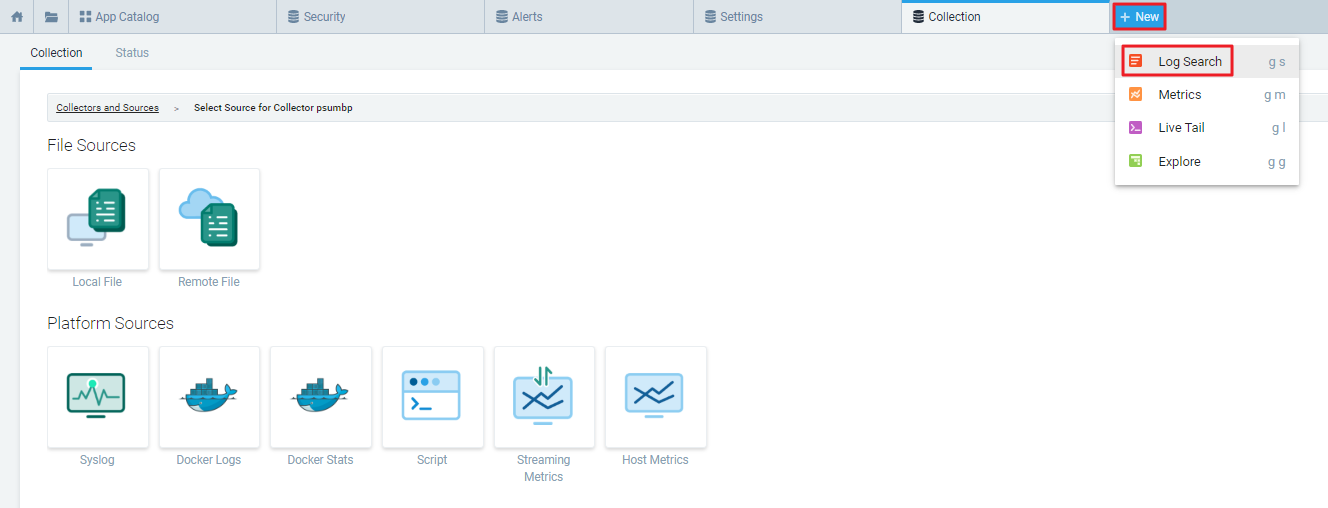
⑤ Select + New > Log Search in the Collection page.
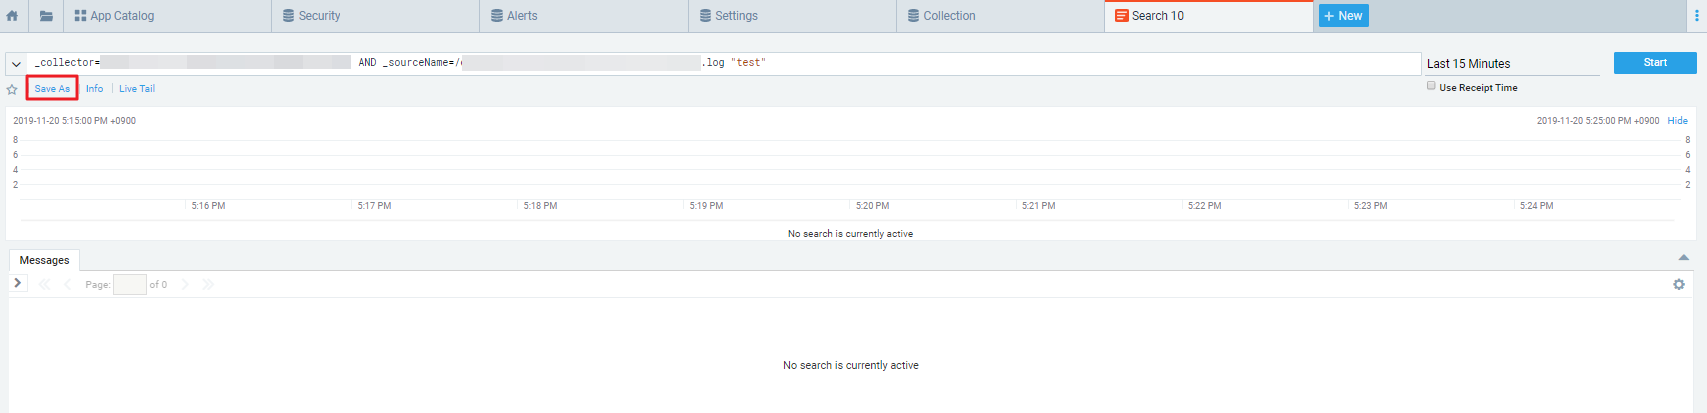
⑥ After entering a query in the Query field and click [Save As].
⑦ Enter in a name and click on Schedule this search to specify the conditions.
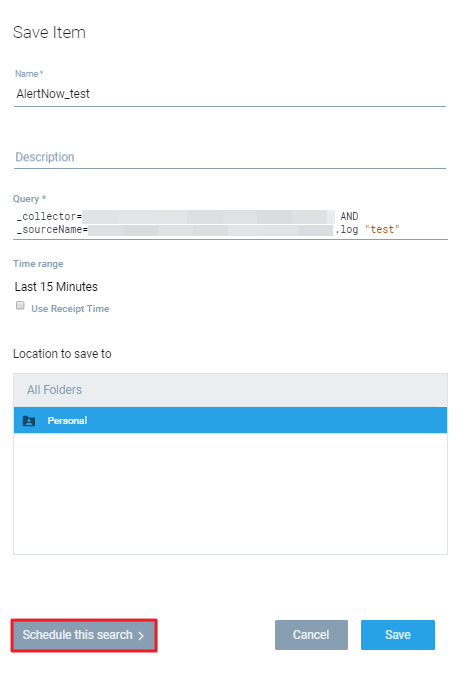
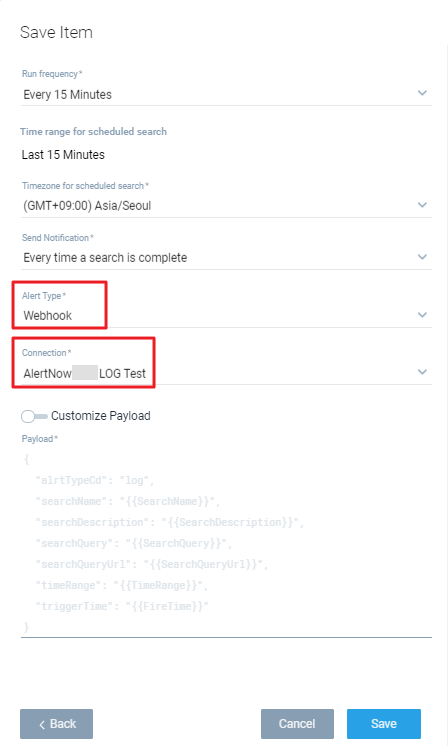
⑧ Select an option from the [Run Frequency] menu. For Alert Type, select Webhook. Then select a connection from the Webhook connections list and click the [Save] button.
- Payload Sample
Log
                    {
                      "alrtTypeCd": "log",
                      "searchName": "{{SearchName}}",
                      "searchDescription": "{{SearchDescription}}",
                      "searchQuery": "{{SearchQuery}}",
                      "searchQueryUrl": "{{SearchQueryUrl}}",
                      "timeRange": "{{TimeRange}}",
                      "triggerTime": "{{FireTime}}"
                    }
Nagios
To integrate Nagios with AlertNow, you must execute commands in the Nagios Core server.
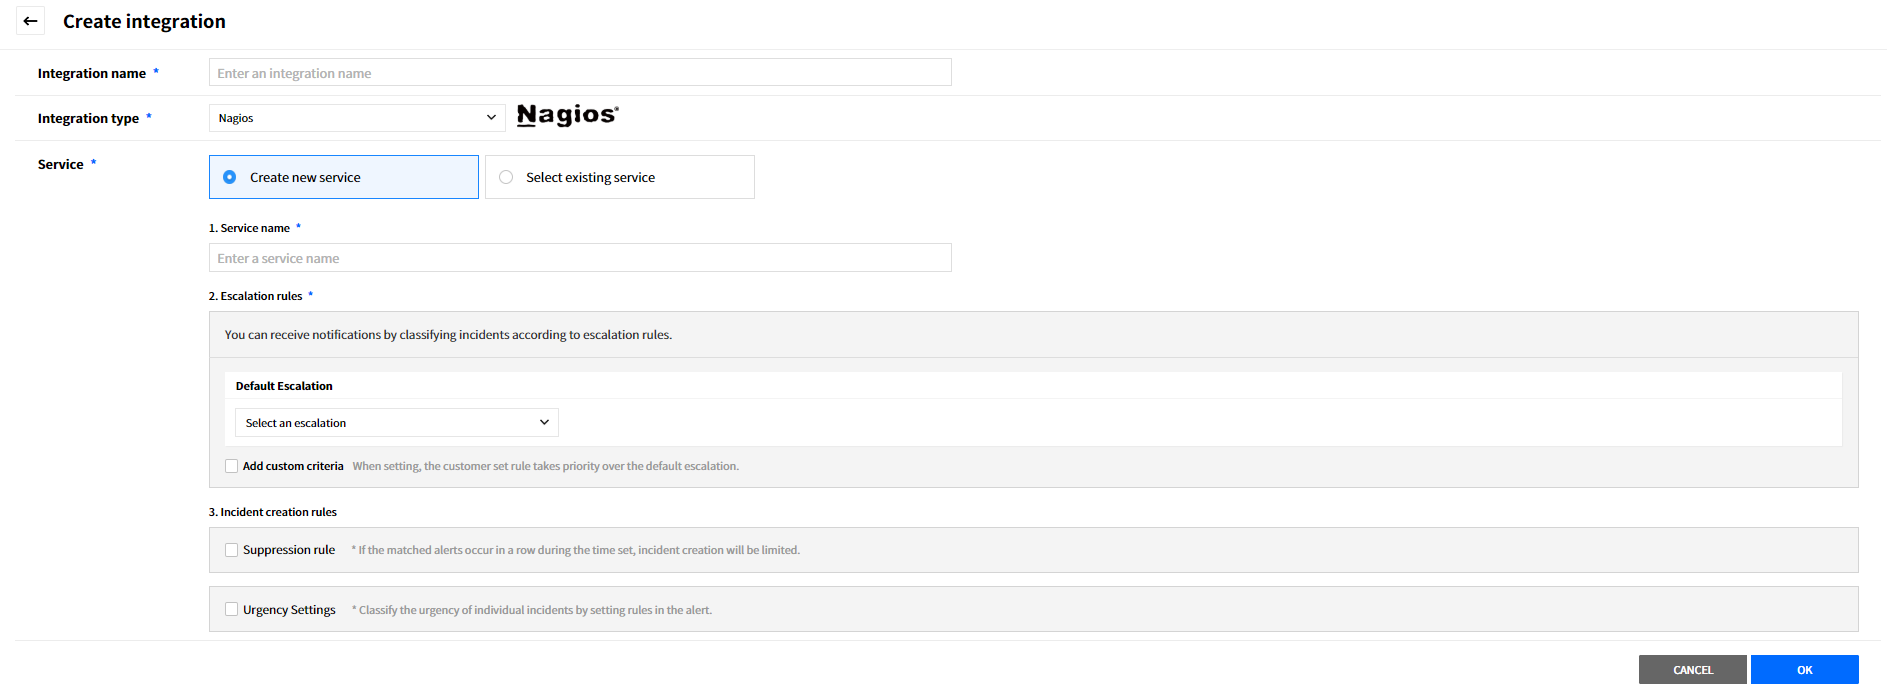
Click the [Create Integration] button located on the top-left side, and select the [Nagios] card.
![]()
In the Create integration page, enter the required information and then click the [OK] button to create the integration.
![]()
Nagios Core Server
This guide describes how to install Nagios Core server; install via apt-get (Debian based, i.e. Ubuntu), yum (RHEL based, i.e. CentOS, Fedora), Linux package managers, and directly download Nagios Core source as well. Pick the right command for your IT environment. Please note that all commands must be executed as the root user. On Nagios Core server, run commands sequentially as listed below.
⑴ Create the notify_service_alertnow.sh script
For installing the source directly, move to:
cd /usr/local/nagios/libexec
For Debian-based systems, move to:
cd /usr/lib/nagios/plugins
For RHEL-based systems, move to:
cd /usr/lib64/nagios/plugins
Create a shell script using the vi editor.
vi notify_service_alertnow.sh
Copy and paste the following code and add the URL created in AlertNow to <Enter AlertNow URL here>.
                    #!/bin/bash
                    ALERTNOW_URL=<Enter AlertNow URL here>

                    function notify_service_alertnow () {
                      curl -X POST ${ALERTNOW_URL} -H "Content-Type: application/json" -s -d "{\"alertType\": \"service\",\"notificationType\": \"$1\",\"serviceDesc\": \"$2\",\"serviceState\": \"$3\",\"hostName\": \"$4\",\"hostDisplayName\": \"$5\",\"serviceDisplayName\": \"$6\",\"serviceProblemId\": \"$7\",\"serviceOutput\": \"$8\",\"lastServiceProblemId\": \"$9\"}"
                    }
                    notify_service_alertnow "$1" "$2" "$3" "$4" "$5" "$6" "$7" "$8" "$9"
                    exit 0
Change the permission on the created script.
chmod +x notify_service_alertnow.sh
⑵ Create the notify_host_alertnow.sh script
For installing the source directly, move to:
cd /usr/local/nagios/libexec
For Debian-based systems, move to:
cd /usr/lib/nagios/plugins
For RHEL-based systems, move to:
cd /usr/lib64/nagios/plugins
Create a shell script using the vi editor.
vi notify_host_alertnow.sh
Copy and paste the following code and add the URL created in AlertNow to <Enter AlertNow URL here>.
                    #!/bin/bash
                    ALERTNOW_URL=<Enter AlertNow URL here>

                    function notify_host_alertnow () {
                      curl -X POST ${ALERTNOW_URL} -H "Content-Type: application/json" -s -d "{\"alertType\": \"host\",\"notificationType\": \"$1\",\"hostName\": \"$2\",\"hostState\": \"$3\",\"hostDisplayName\": \"$4\",\"hostProblemId\": \"$5\",\"lastHostProblemId\": \"$6\"}"
                    }
                    notify_host_alertnow "$1" "$2" "$3" "$4" "$5" "$6"
                    exit 0
Change the permission on the created script.
chmod +x notify_host_alertnow.sh
⑶ Create the alertnow.cfg file
For installing the source directly, move to:
cd /usr/local/nagios/etc/objects
For Debian-based systems, move to:
cd /etc/nagios3/conf.d
For RHEL-based systems, move to:
cd /etc/nagios/objects
Create a config file using the vi editor.
vi alertnow.cfg
Copy and paste the following code and save it.
                    define contact {
                           contact_name                             alertnow
                           alias                                    AlertNow Contact
                           service_notification_period              24x7
                           host_notification_period                 24x7
                           service_notification_options             w,u,c,r
                           host_notification_options                d,r
                           service_notification_commands            notify-service-by-alertnow
                           host_notification_commands               notify-host-by-alertnow
                    }

                    define command {
                           command_name     notify-service-by-alertnow
                           command_line     $USER1$/notify_service_alertnow.sh '$NOTIFICATIONTYPE$' '$SERVICEDESC$' '$SERVICESTATE$' '$HOSTNAME$' '$HOSTDISPLAYNAME$' '$SERVICEDISPLAYNAME$' '$SERVICEPROBLEMID$' '$SERVICEOUTPUT$' '$LASTSERVICEPROBLEMID$'
                    }

                    define command {
                           command_name     notify-host-by-alertnow
                           command_line     $USER1$/notify_host_alertnow.sh '$NOTIFICATIONTYPE$' '$HOSTNAME$' '$HOSTSTATE$' '$HOSTDISPLAYNAME$' '$HOSTPROBLEMID$' '$LASTHOSTPROBLEMID$'
                    }
⑷ Add the contact “alertnow” to contact.cfg file
For installing the source directly, move to /usr/local/nagios/etc/objects and open the config file in the vi editor.
                    cd /usr/local/nagios/etc/objects
                    vi contacts.cfg
For Debian-based systems, move to /etc/nagios3/conf.d and open the config file in the vi editor.
                    cd /etc/nagios3/conf.d
                    vi contacts_nagios2.cfg
For RHEL-based systems, move to /etc/nagios/objects and open the config file in the vi editor.
                    cd /etc/nagios/objects
                    vi contacts.cfg
Add the contact “alertnow” to members in the contactgroup and save it.
                    define contactgroup {

                        contactgroup_name       admins
                        alias                   Nagios Administrators
                        members                 nagiosadmin,alertnow ; add alertnow here
                    }
⑸ Add the path to nagios.cfg file
For installing the source directly, move to /usr/local/nagios/etc and open the config file in the vi editor.
                    cd /usr/local/nagios/etc
                    vi nagios.cfg
Add the following path to the file and save it.
cfg_file=/usr/local/nagios/etc/objects/alertnow.cfg
For Debian-based systems, skip this step.
For RHEL-based systems, move to /etc/nagios and open the config file in the vi editor.
                    cd /etc/nagios
                    vi nagios.cfg
Add the following path to the file and save it.
cfg_file=/etc/nagios/objects/alertnow.cfg
⑹ Restart Nagios Core
Restart Nagios Core for your configuration changes to take effect.
For installing the source directly, execute any of the following commands.
                    ===== Ubuntu 14.x =====
                    service nagios restart

                    ===== Ubuntu 15.x / 16.x / 17.x / 18.x =====
                    systemctl restart nagios.service

                    ===== RHEL 5/6 | CentOS 5/6 =====
                    service nagios restart

                    ===== RHEL 7/8 | CentOS 7 =====
                    systemctl restart nagios.service
For Debian-based systems, execute the following command.
service nagios3 restart
For RHEL-based systems, execute the following command.
service nagios restart
Standard
AlertNow Standard allows you to send customized events and incident details to AlertNow. It allows you to manage events and incidents efficiently.
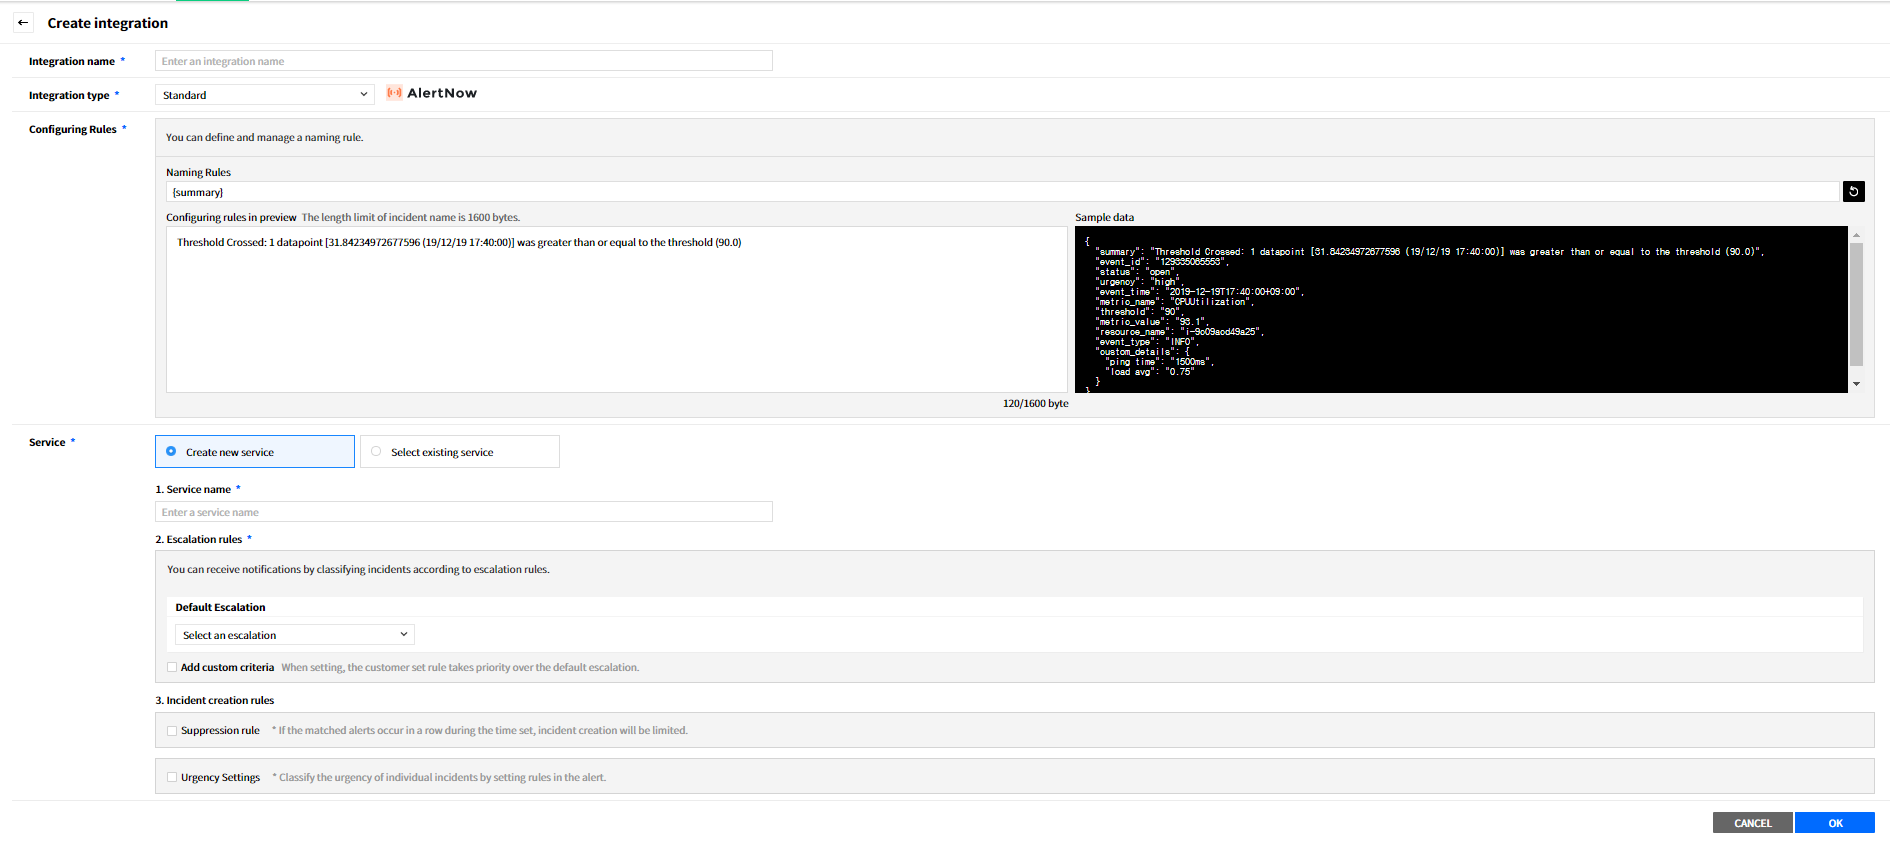
Click the [Create Integration] button located on the top-left side, and select the [Standard] card.
![]()
In the [Create integration] page, enter the required information and then click the [OK] button to create the integration.
![]()
Calling REST API
Call a REST API with the API Key created in AlertNow. Information required to call a REST API are:
About Standard Integration Call
URL: https://{DOMAIN}/integration/standard/v1/{APIKEY}
Method: POST
Content-Type: application/json
Body: Refers to the following tableMessage Spec
| Field | Name | Data Type | Mandatory | Description | Default Value | Example |
|---|---|---|---|---|---|---|
| summary | Summary info | String | Required | Information that lets you identify the content of the event | Threshold Crossed: 1 datapoint [31.84234972677596 (19/12/19 17:40:00)] was greater than or equal to the threshold (90.0) | |
| event_id | Event ID | String | Optional | If event_id data does not exist, it will be automatically set (However, if status is ack or close, it is required) |
UUID | 129335065553 |
| status | Status info | String | Optional | Field indicating the status of the event Valid values: - open: event creation - ack: event confirmation - close: event end |
open | open |
| urgency | Urgency | String | Optional | Field indicating the degree of influence on system or the urgency of the event related to the priority Valid values: - highest - high - medium - low - lowest - none |
none | high |
| event_time | Occurred | String | Optional | Time at which an event occurred Timestamp (ISO 8601) data type |
Current timestamp | 2019-12-19T17:40:00+09:00 |
| metric_name | Metric name | String | Optional | Information that lets you identify a metric type | CPUUtilization | |
| threshold | Threshold | String | Optional | Metric threshold | 90 | |
| metric_value | Metric value | String | Optional | Measured value of metric | 93.1 | |
| resource_name | Resource name | String | Optional | Information that you can identify such as the host name of the system on which event occurred | i-9c09acd49a25 | |
| event_type | Event type | String | Optional | Information that lets you identify an event type | INFO | |
| custom_details | Details | JSON | Optional | More information field | { “ping time”: “1500ms”, “load avg”: 0.75 } |
- Payload Sample
                    {
                        "summary": "Threshold Crossed: 1 datapoint [31.84234972677596 (19/12/19 17:40:00)] was greater than or equal to the threshold (90.0)",
                        "event_id": "129335065553",
                        "status": "open",
                        "urgency": "high",
                        "event_time": "2019-12-19T17:40:00+09:00",
                        "metric_name": "CPUUtilization",
                        "threshold": "90",
                        "metric_value": "93.1",
                        "resource_name": "i-9c09acd49a25",
                        "event_type": "INFO",
                        "custom_details": {
                            "ping time": "1500ms",
                            "load avg": "0.75"
                        }
                    }
Kapacitor
To integrate Kapacitor with AlertNow, you need to write the TICKscript or create the Alert Rule Builder in Kapacitor.
Click the [Create Integration] button located on the top-left side, and select the [Kapacitor] card.
![]()
In the [Create integration] page, enter the required information and then click the [OK] button to create the integration.
![]()
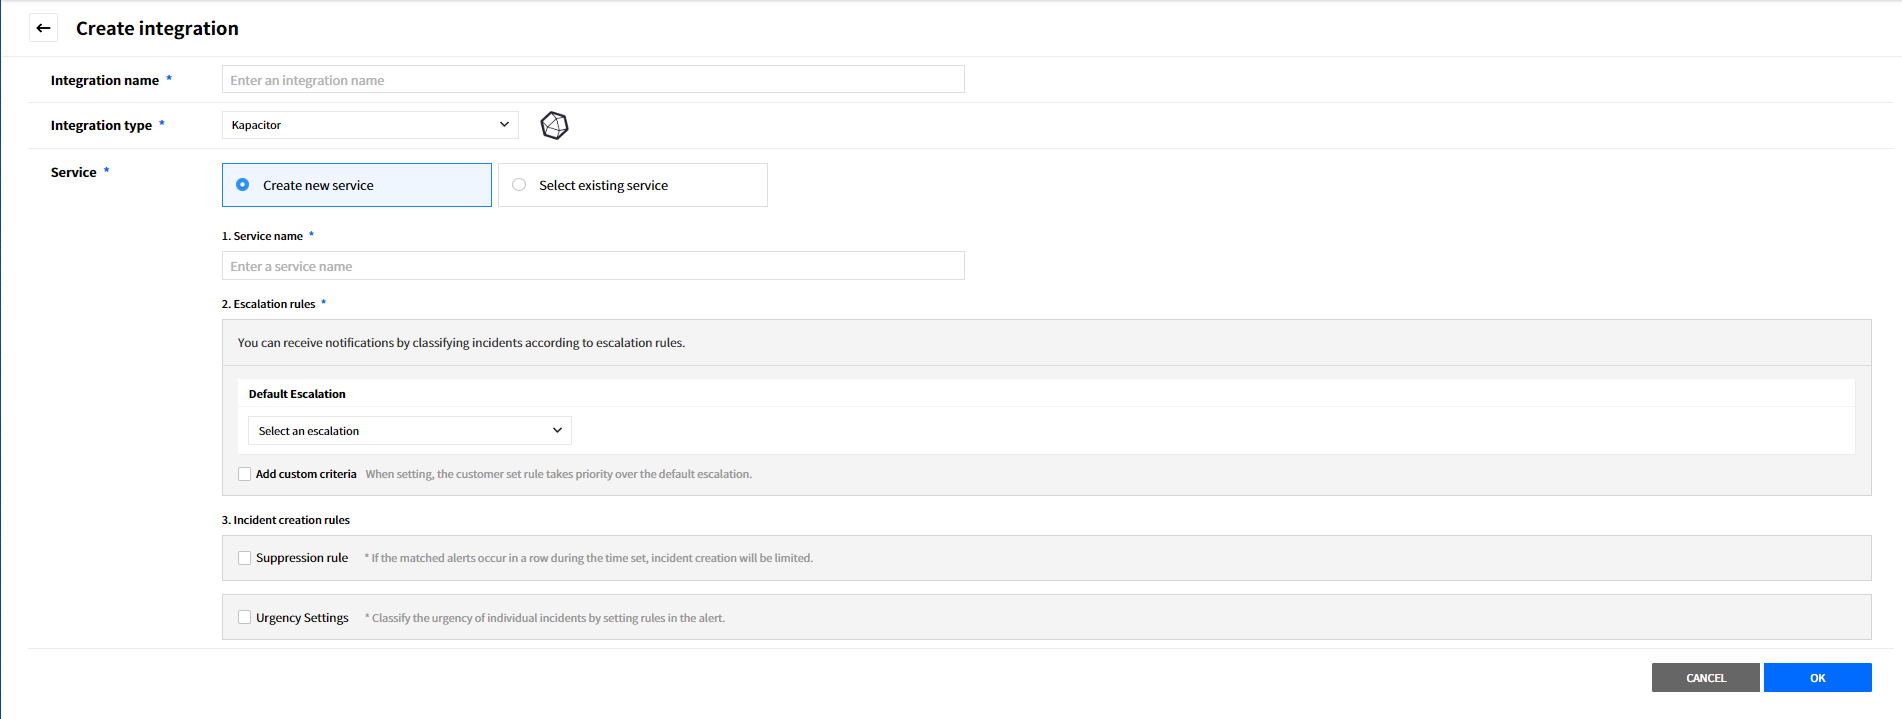
Configuration on Kapacitor
- How to write the TICKscrip generating an alert when the memory metric exceeds a threshold that you set
The steps below describe how to write the script to integrate Kapacitor with AlertNow. The script can be edited if required.
⑴ Write the alertnow_mem_alert.tick script
Move to the same directory as the kapacitor.conf file.
cd /etc/kapacitor
Write a script using the vi editor.
vi alertnow_mem_alert.tick
Copy and paste the following code and add the URL created in AlertNow to <Enter AlertNow URL here>.
Change each of the variable values and the ‘used_percent’ metric to values that you want to measure and then save them.
                    var alertnow_url = '<Enter AlertNow URL here>'
                    var measurement = 'mem'
                    var period = 10s
                    var every = 10s
                    var info = 80
                    var warn = 85
                    var crit = 90

                    var data = stream
                        |from()
                            .measurement(measurement)
                        |window()
                            .period(period)
                            .every(every)

                    var trigger = data
                        |alert()
                            .info(lambda: "used_percent" > info)
                            .warn(lambda: "used_percent" > warn)
                            .crit(lambda: "used_percent" > crit)
                            .stateChangesOnly()
                            .id('{{ .Name }}:used_percent')
                            .message(' {{.ID}} is {{.Level}}; value: {{ index .Fields "used_percent" }}')
                            .post(alertnow_url)
                                .skipSSLVerification()
⑵ Define the kapacitor task
Define the TICKscript written as kapacitor task.
                    // Pattern
                    kapacitor define <TASK_ID> -tick <PATH_TO_TICKSCRIPT> -dbrp <DATABASE>.<RETENTION_POLICY>

                    // Example
                    kapacitor define "alertnow_mem_alert" -tick /etc/kapacitor/alertnow_mem_alert.tick -dbrp telegraf.autogen
3. Enable the kapacitor task
Enable the kapacitor task.
                    // Pattern
                    kapacitor enable <TASK_ID>

                    // Example
                    kapacitor enable alertnow_mem_alert
4. Verify the kapacitor task
Verify the registered kapacitor task.
kapacitor list tasks
- Kapacitor is interworking with Chronograf
The steps below describe how to integrate Kapacitor with AlertNow when Kapacitor is connected with Chronograf.
① From your Chronograph dashboard, in the left hand menu, select [Alerting] > [Manage Tasks].
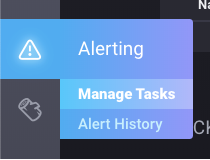
② Click the [Build Alert Rule] button on the top right of the page.
③ Write the [Alert Rule Builder] sequentially as mentioned below.
④ Enter the [Alert Rule] name.
⑤ Select an Alert Type of the following options: Threshold, Relative and Deadman.

⑥ In the section Time Series, select a policy, a measurement & tag and a field to be monitored.
⑦ Define the Conditions for threshold.
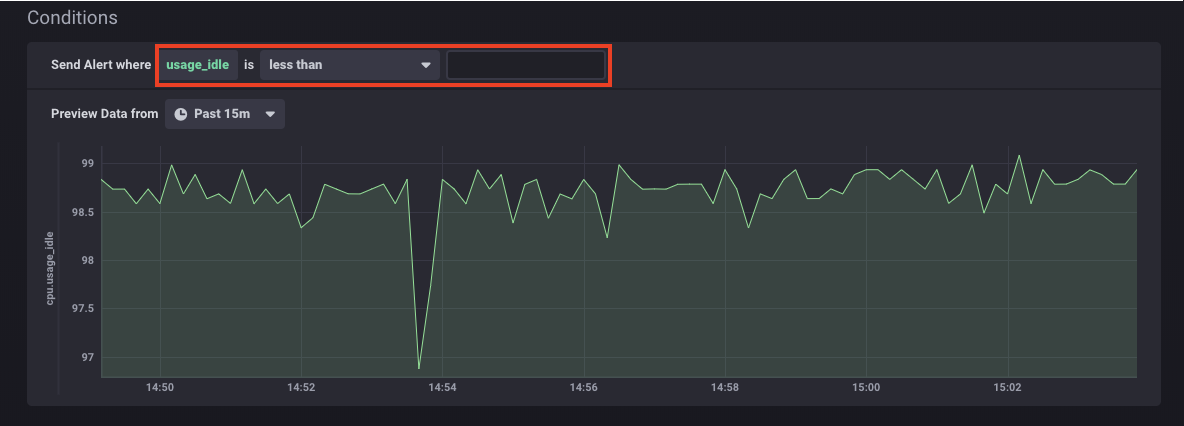
⑧ In the section Alert Handlers, select post and add the URL for the integration created in AlertNow to HTTP endpoint for POST request field.
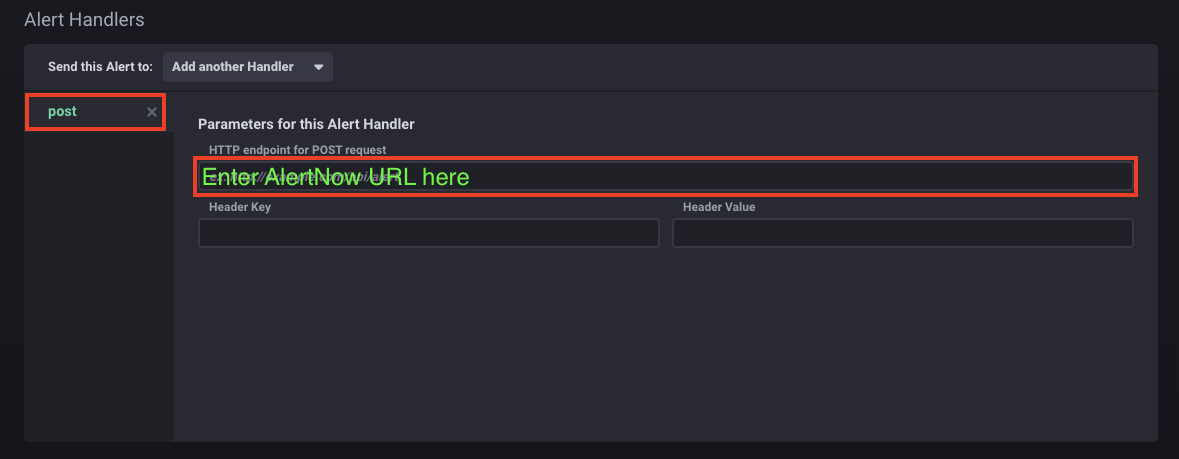
⑨ Enter the Alert Message.
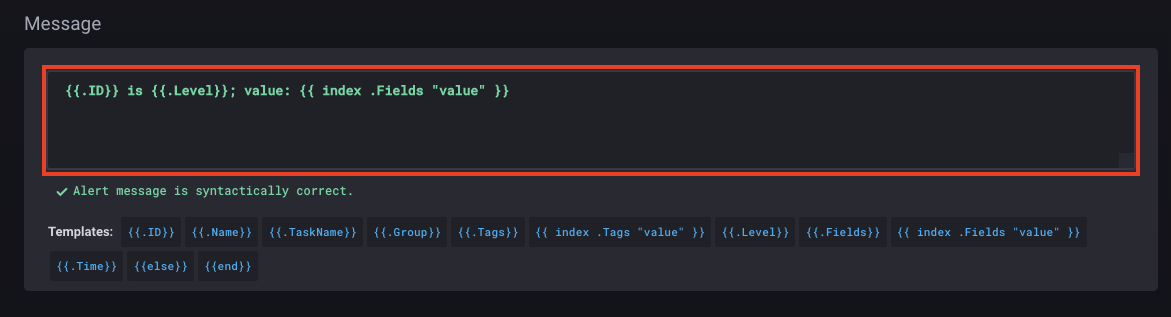
⑩ Click the [Save Rule] button in the top right corner.
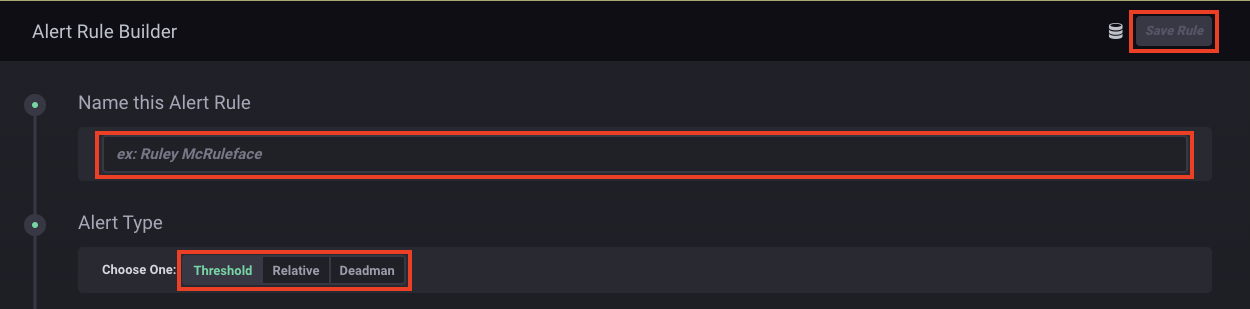
SAMBA
💡 Depending on your country or region, this feature may not be available.
To integrate SAMBA with AlertNow, you need to set the configuration as below.
Click the [Create integration] button located on the top-left side, and select the [SAMBA] card.
![]()
Enter an integration name and then configure the naming rules with the sample data.
![]()
- Sample data
                    {
                        "summary": "SAMBA > eu-idc > System > euidbmkaf04 > CPU Usage (SUM)",
                        "status": "open",
                        "urgency": "low",
                        "event_time": "2020-01-07T16:03:00+09:00",
                        "metric_name": "CPU Usage (SUM)",
                        "threshold": "90",
                        "metric_value": "93.1",
                        "resource_name": "SAMBA > eu-idc > System > euidbmkaf04",
                        "event_type": "INFO"
                    }
- Fill in the required information in the Service field and then click the [OK] button to create integration.
![]()
Dynatrace
To integrate Dynatrace with AlertNow, you need to set Custom Webhook Integration in the Dynatrace.
Click the [Create Integration] button located on the top-left side, and select the [Dynatrace] card.
![]()
In the [Create integration] page, enter the required information and then click the [OK] button to create the integration.
![]()
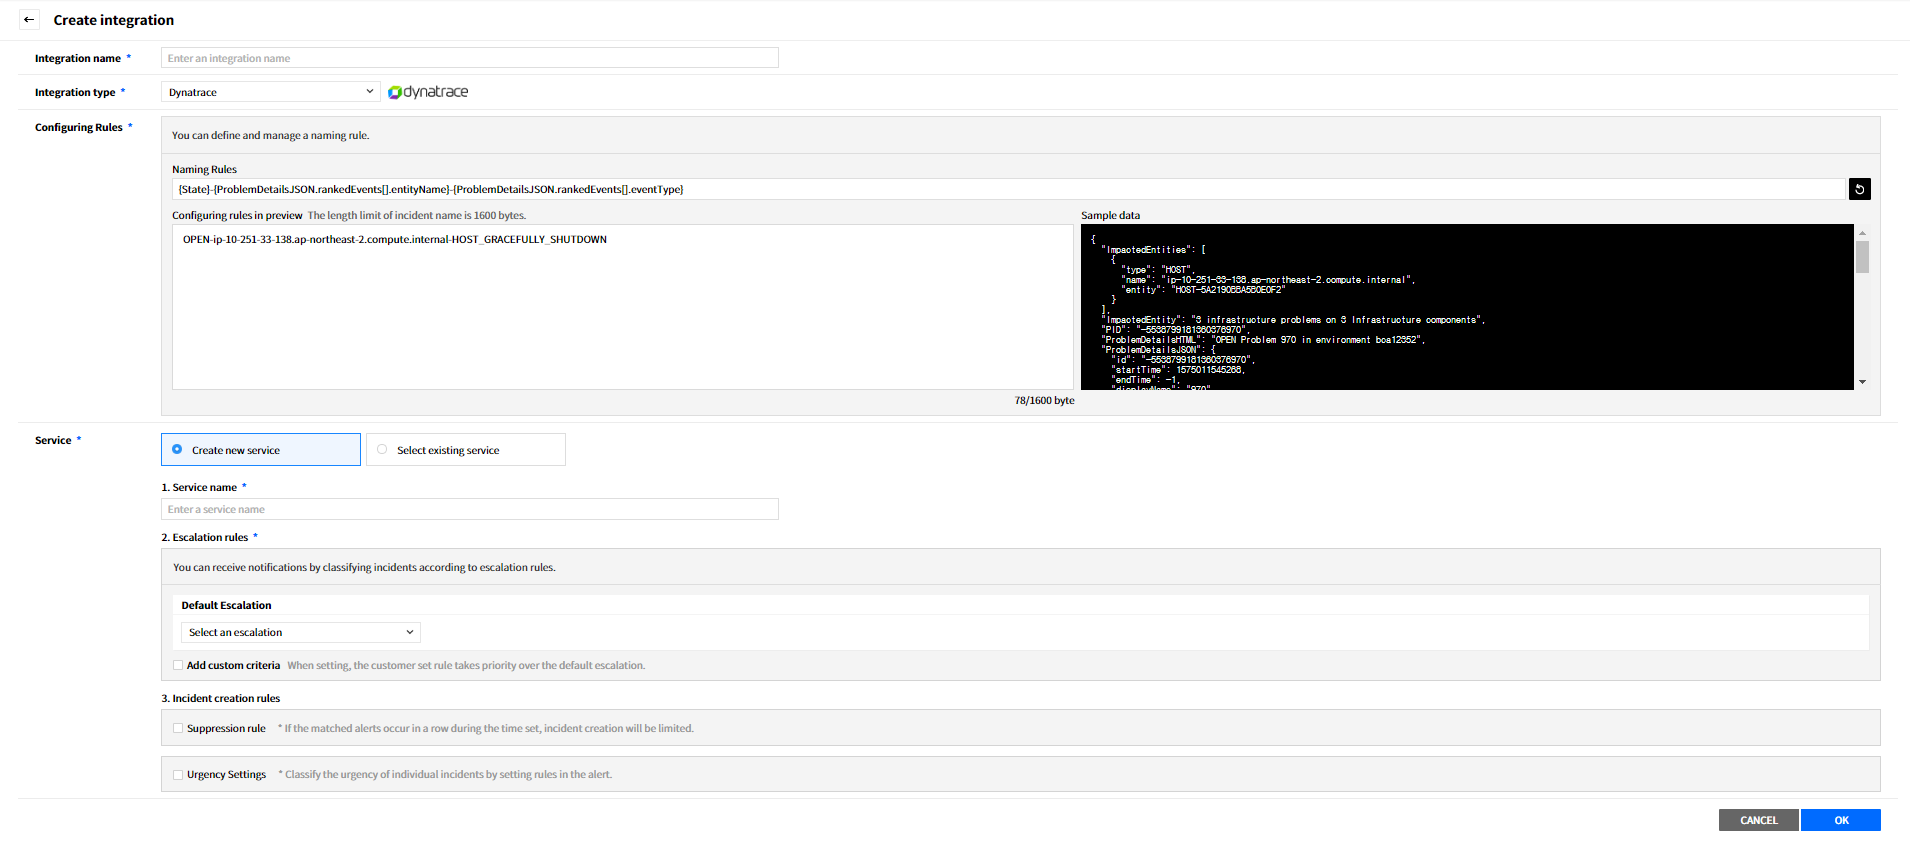
Webhook Configuration
① Sign in to Dynatrace, and click the menu button on the top left of the page.
② Select Settings > Integration > Problem Notifications.
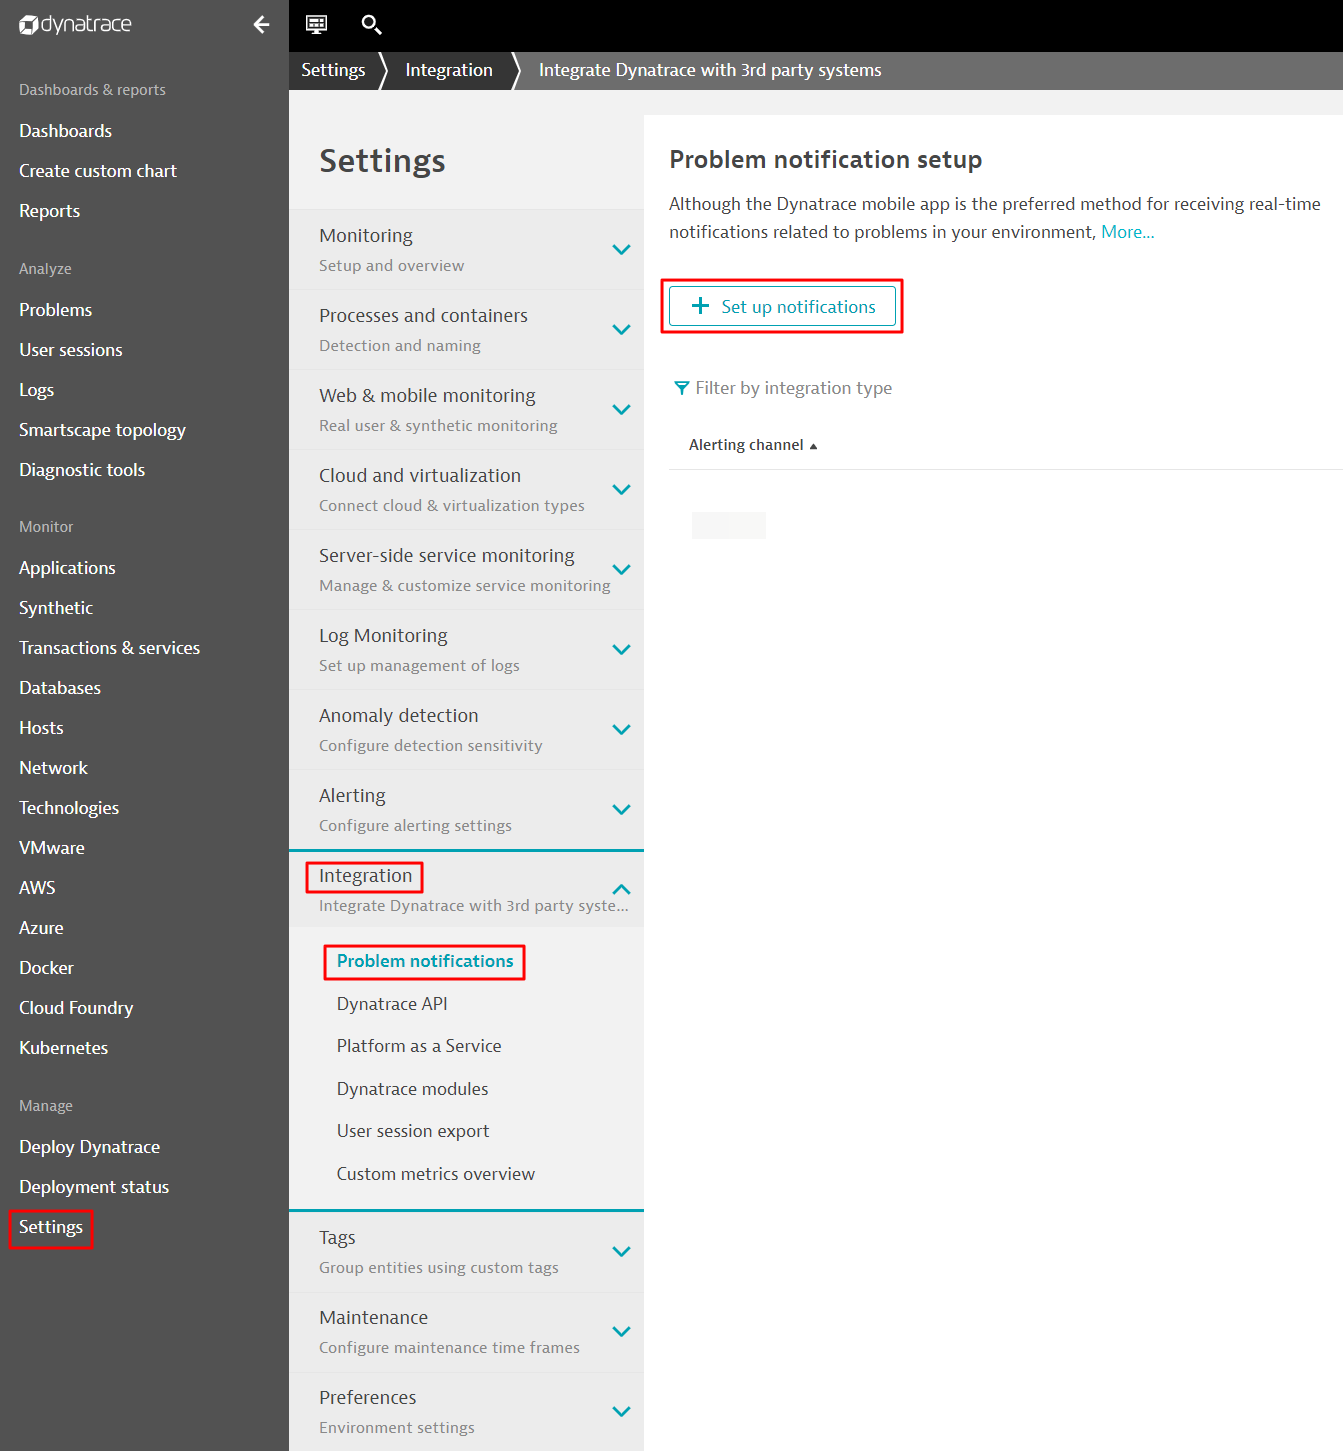
③ Click [Set up notifications], and choose [Custom integration].
④ On the Set up custom integration page, enter a Name for your integration, copy the URL for the integration in AlertNow and paste it to the Webhook URL field, populate Custom payload field with the following content.
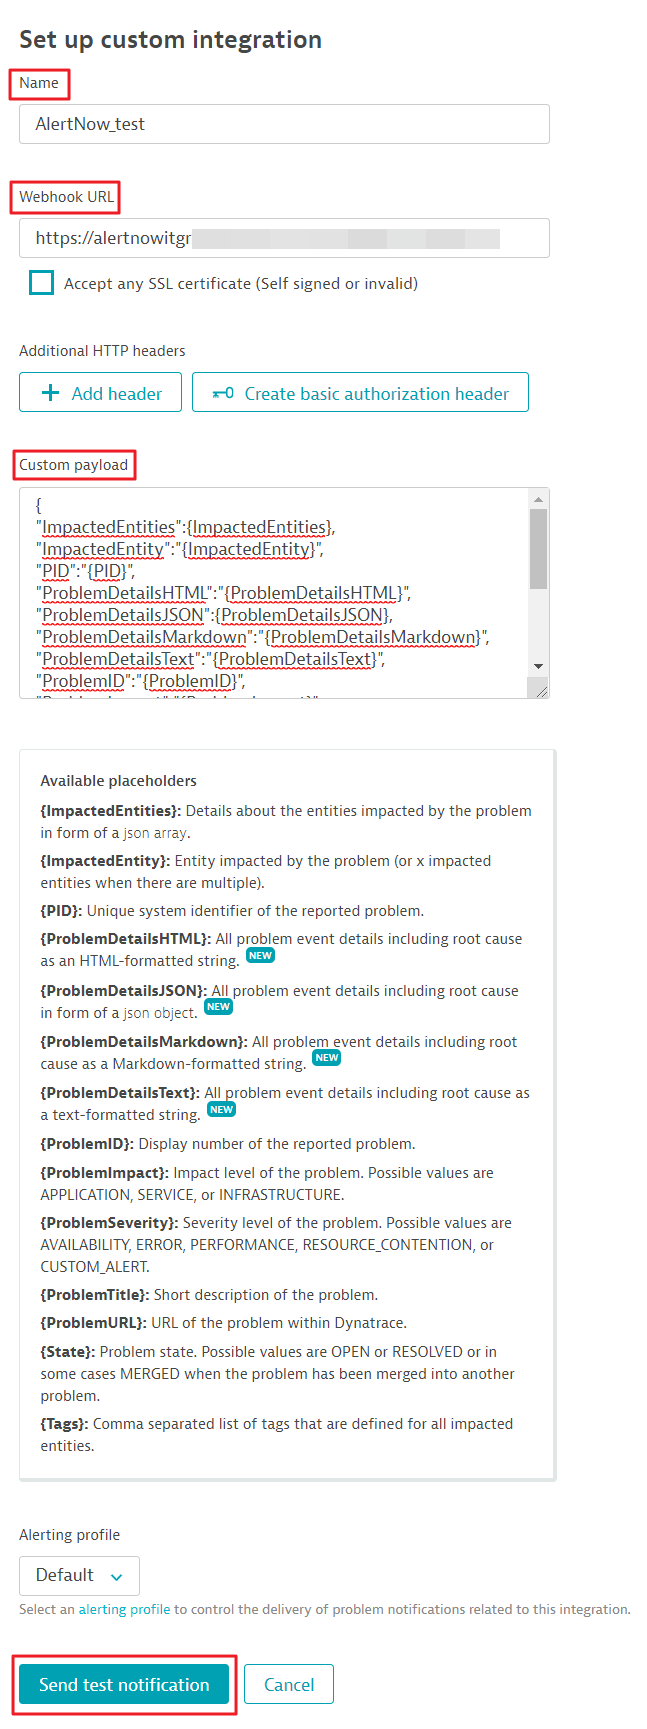
- Payload Sample
                    {
                    "ImpactedEntities":{ImpactedEntities},
                    "ImpactedEntity":"{ImpactedEntity}",
                    "PID":"{PID}",
                    "ProblemDetailsHTML":"{ProblemDetailsHTML}",
                    "ProblemDetailsJSON":{ProblemDetailsJSON},
                    "ProblemDetailsMarkdown":"{ProblemDetailsMarkdown}",
                    "ProblemDetailsText":"{ProblemDetailsText}",
                    "ProblemID":"{ProblemID}",
                    "ProblemImpact":"{ProblemImpact}",
                    "ProblemSeverity":"{ProblemSeverity}",
                    "ProblemTitle":"{ProblemTitle}",
                    "ProblemURL":"{ProblemURL}",
                    "State":"{State}",
                    "Tags":"{Tags}"
                    }
⑤ Click [Send test notification]. If it is properly configured, you will receive a Custom integration test successful. Click [Save] to complete the configuration.
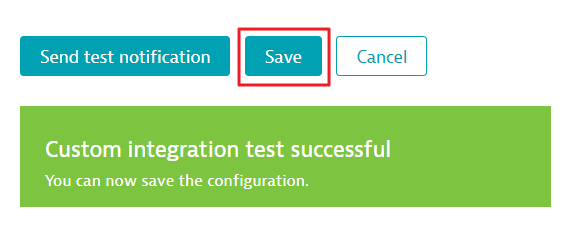
Elasticsearch Watcher
To integrate Elasticsearch Watcher with AlertNow, you need to configure Watcher in the Elasticsearch Watcher server.
Click the [Create Integration] button located on the top-left side, and select the [Elasticsearch Watcher] card.
![]()
In the [Create integration] page, enter the required information and then click the [OK] button to create the integration.
![]()
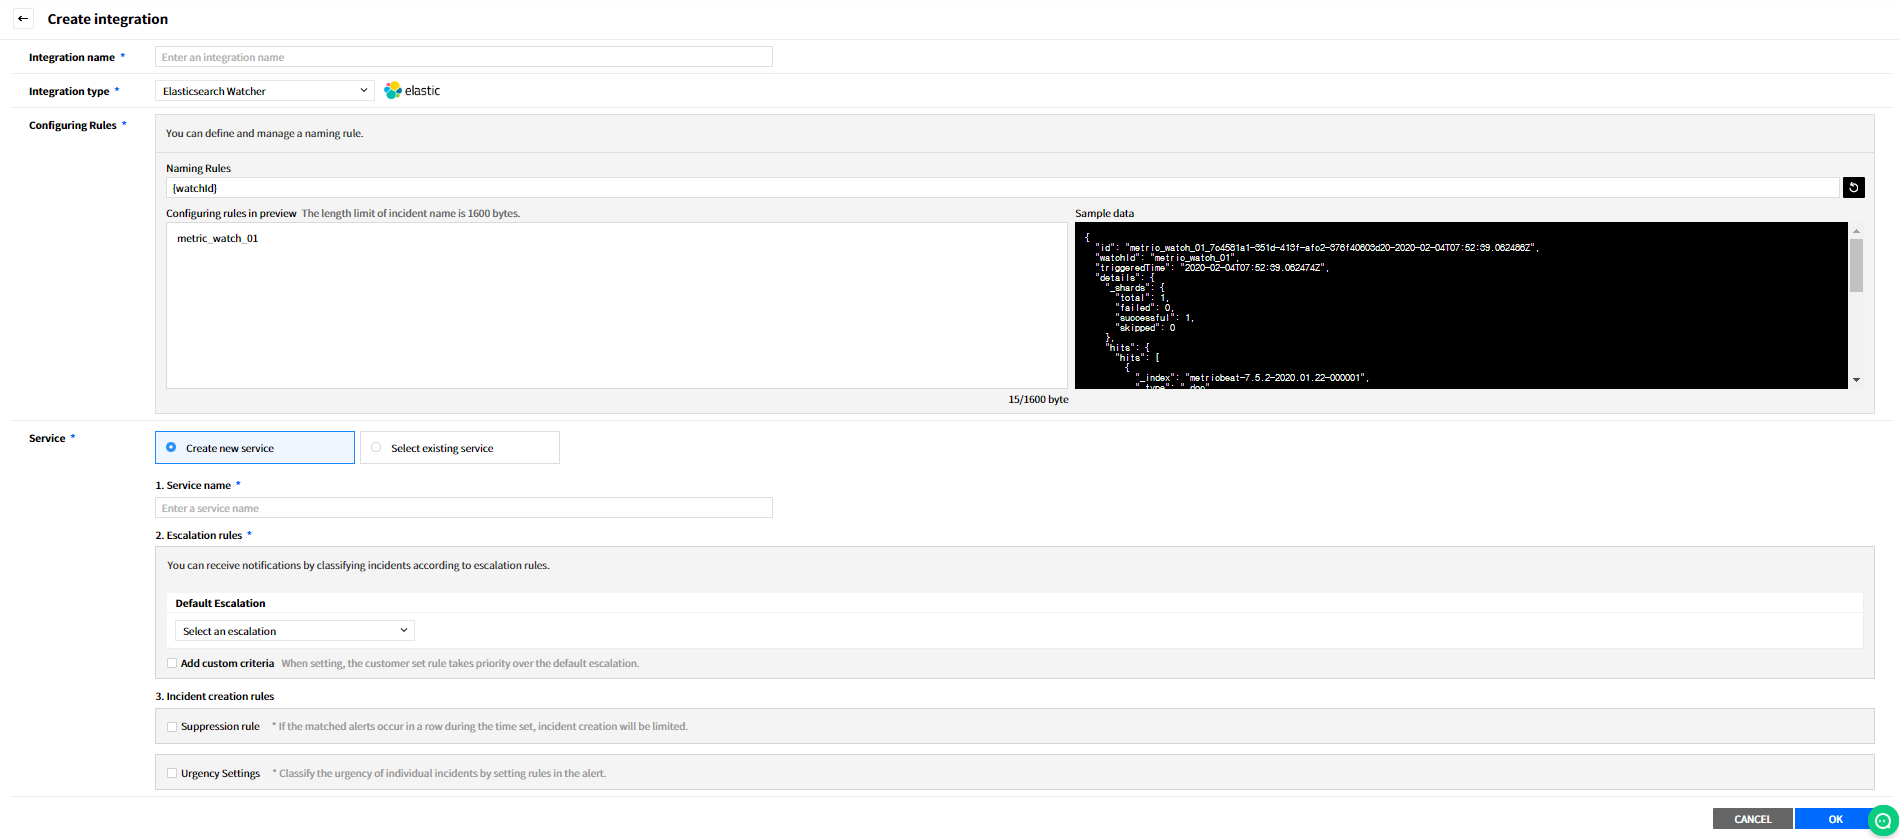
Configure in Elasticsearch Watcher
① Verify that Watcher is set up and running on your server:
curl -X GET 'http://localhost:9200/_watcher/stats?pretty'
You should get a response showing “watcher_state”: “started”:
                    {
                      "_nodes" : {
                        "total" : 1,
                        "successful" : 1,
                        "failed" : 0
                      },
                      "cluster_name" : "elasticsearch",
                      "manually_stopped" : false,
                      "stats" : [
                        {
                          "node_id" : "0lqYKcZuTV2AvspmQnLcmw",
                          "watcher_state" : "started",
                          "watch_count" : 1,
                          "execution_thread_pool" : {
                            "queue_size" : 0,
                            "max_size" : 10
                          }
                        }
                      ]
                    }
② This example shows how to use a PUT request to register a new watch or update an existing watch. Replace the “trigger”, “input”, and “condition” with the ones you want to use to integrate Elasticsearch Watcher with AlertNow, and create the user-defined alerts. Add the URL created in AlertNow to <Enter AlertNow URL here>. The URL can be found in the AlertNow integration page.
                    curl -X PUT 'http://localhost:9200/_watcher/watch/alertnow_watch_01' -H 'Content-Type: application/json' -d '{
                      "trigger": {
                        "schedule" : { "interval" : "60s" }
                      },
                      "input": {
                        "search" : {
                          "request" : {
                            "indices" : [ "metricbeat*" ],
                            "body" : {
                              "query": {
                                "bool": {
                                  "must": {
                                    "range": {
                                        "system.process.cpu.total.pct": {
                                          "gte": 50
                                        }
                                    }
                                  },
                                  "filter": {
                                    "range": {
                                      "@timestamp": {
                                        "gte": "now-60s"
                                      }
                                    }
                                  }
                                }
                              }
                            }
                          }
                        }
                      },
                      "condition": {
                        "compare" : { "ctx.payload.hits.total" : { "gte" : 1 }}
                      },
                      "actions": {
                        "alertnow": {
                          "webhook": {
                            "method":"POST",
                            "url":"<Enter AlertNow URL here>",
                            "headers":{
                              "Content-Type":"application/json"
                            },
                            "body": "{\"id\": \"{{ctx.id}}\",\"watchId\": \"{{ctx.watch_id}}\",\"triggeredTime\": \"{{ctx.trigger.triggered_time}}\",\"details\": {{#toJson}}ctx.payload{{/toJson}}}"
                          }
                        }
                      }
                    }'
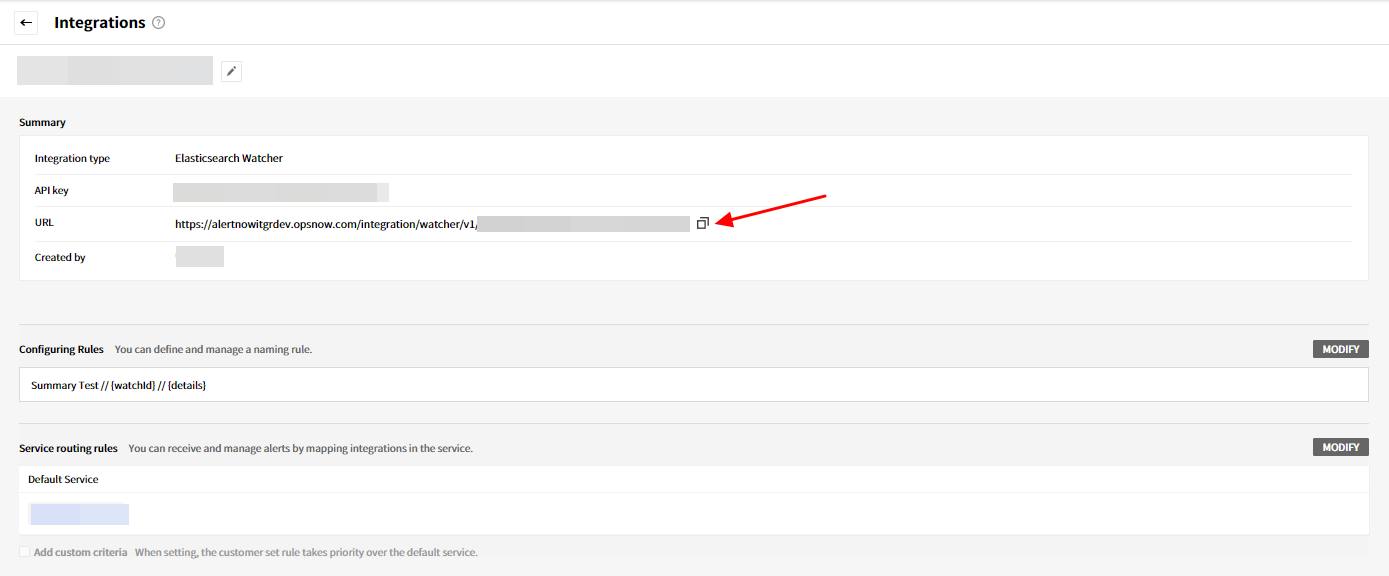
- You can find detailed instructions on Configuring Watcher and Alerting in the Watcher Documentation.
③ Confirm that the watch is registered or updated properly.
curl -X GET 'localhost:9200/.watches/_search?pretty'
📑 Note: Verify that an issue meets your watch’s condition and an alert is created.
                    curl -X GET 'http://localhost:9200/.watch_history*/_search?pretty' -H 'Content-Type: application/json' -d '{
                      "query" : {
                        "match" : { "result.condition.met" : true }
                      }
                    }'
💡 Depending on your country or region, this feature may not be available.
To integrate AlertNow with any service capable of sending email notifications, you need to set the configuration for the email you are using.
Click the [Create Integration] button located on the top-left side, and select the [Email] card.
![]()
Enter an integration name, email and then select the Suppression rules.
![]()
Fill in the required information in the Service field and then click the [OK] button to create integration.
![]()
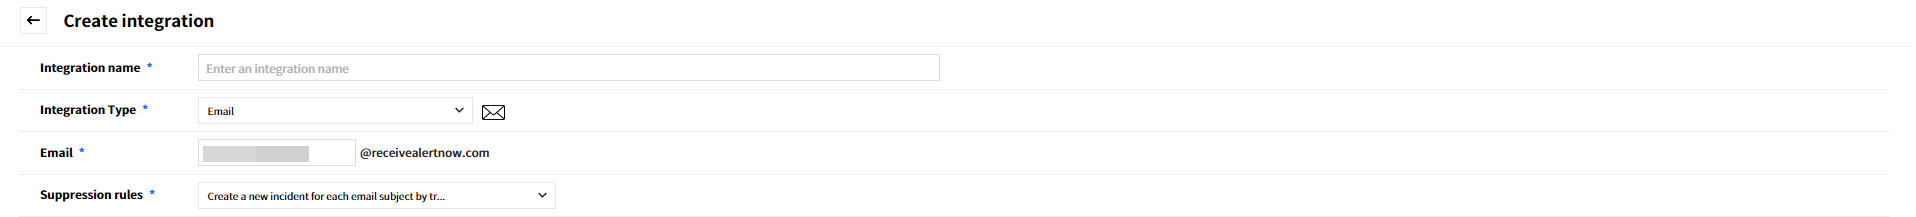
- Add the Integration Email to Your Monitoring Service
In order to complete the integration, refer to your monitoring service’s documentation on email integration, and then copy the integration email address and add it to your monitoring service. AlertNow will create an incident when it receives an email from the email address you entered.
Scouter
To integrate Scouter with AlertNow, you need to download AlertNow Plugin and install it on the Scouter server.
Click the [Create Integration] button located on the top-left side, and select the [Scouter] card.
![]()
Enter an integration name and then define the naming rules.
![]()
Fill in the required information in the Service field and then click the [OK] button to create integration.
![]()
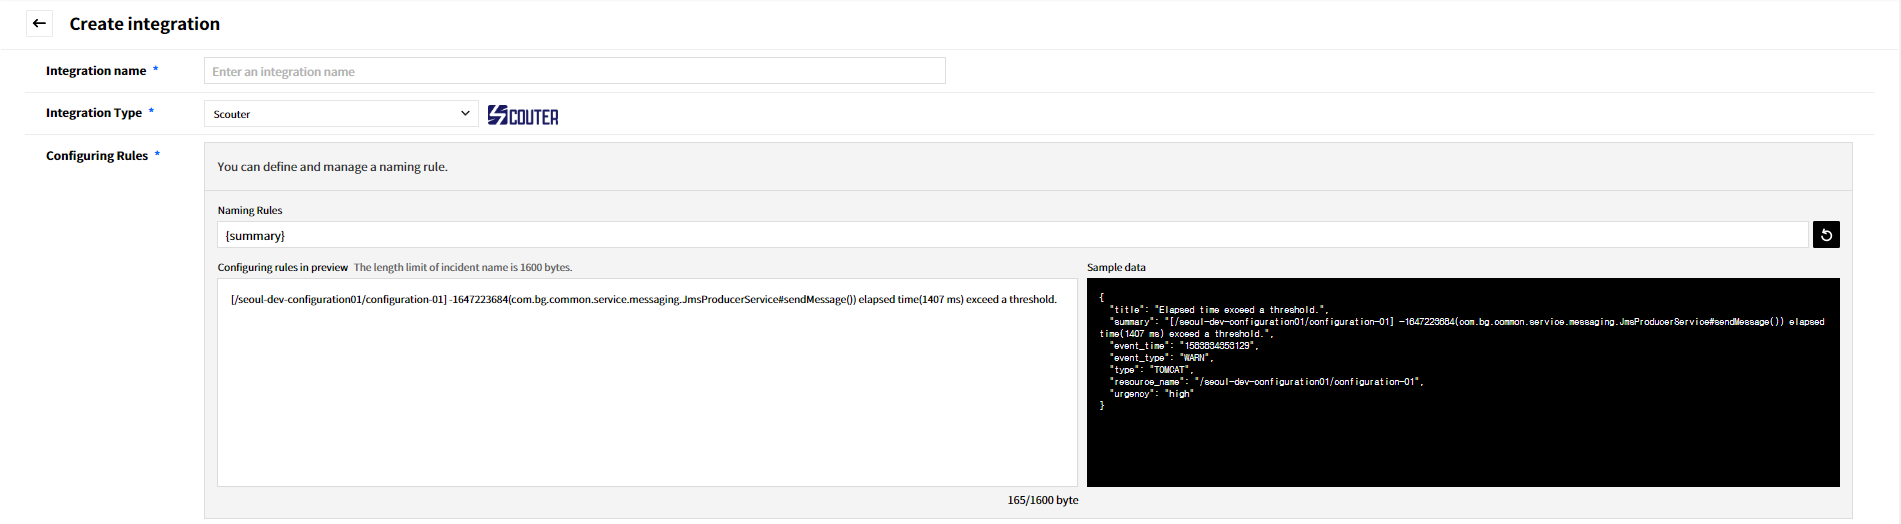
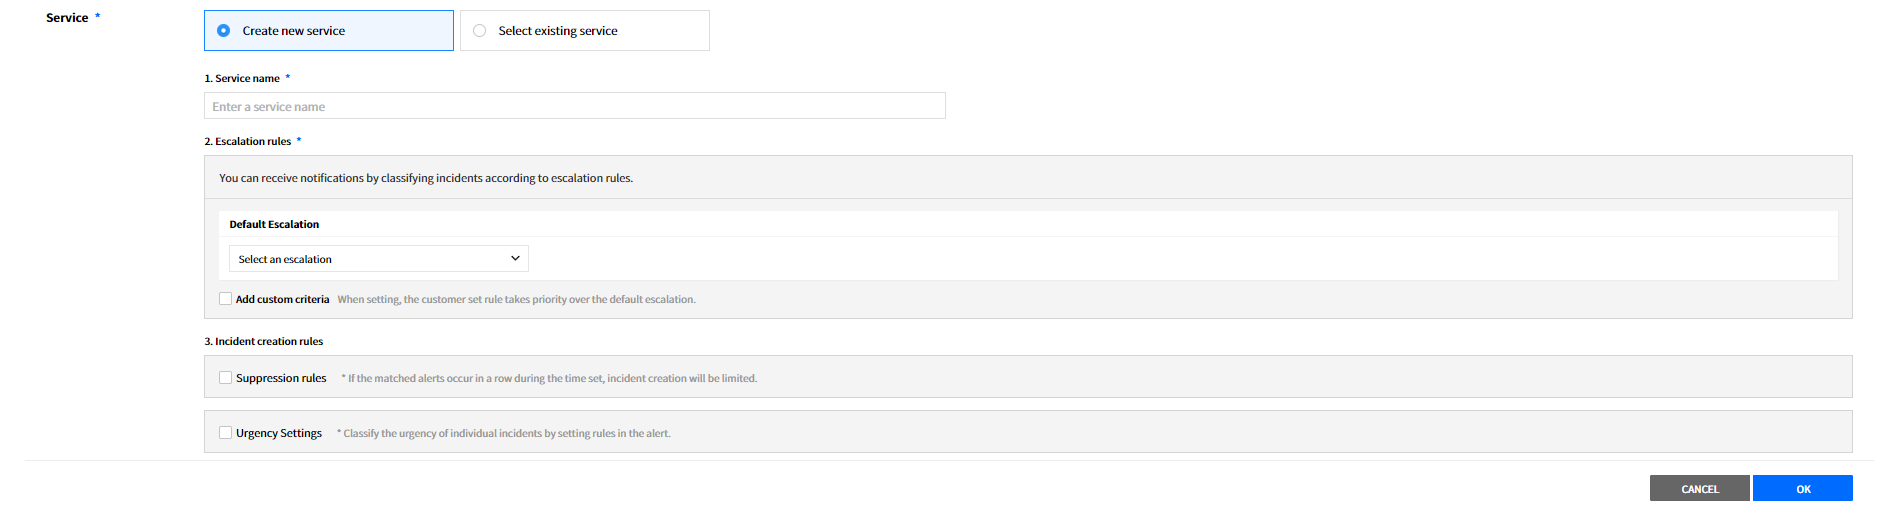
Scouter Server
⑴ Install AlertNow Plugin
To integrate Scouter with AlertNow, install AlertNow Plugin. Click Download AlertNow Plugin and save it to the subfolder lib/ of the Scouter server.
AlertNow Plugin
lib/scouter-plugin-server-alert-alertnow-1.0.1-SNAPSHOT.jar
⑵ Restart Scouter server
Add AlertNow Plugin setting values to the conf/scouter.conf file located in the subpath of Scouter server, and restart the server.
conf/scouter.conf
                    # External Interface (AlertNow)
                    ext_plugin_alertnow_send_alert=true
                    ext_plugin_alertnow_debug=true
                    ext_plugin_alertnow_level=0
                    ext_plugin_alertnow_webhook_url=<Enter AlertNow URL here.>
                    ext_plugin_alertnow_xlog_enabled=true
                    ext_plugin_elapsed_time_threshold=1500
                    ext_plugin_gc_time_threshold=1000
                    ext_plugin_thread_count_threshold=1000
- Notification setting options
① ext_plugin_alertnow_send_alert: Whether to send AlertNow message (true/false) - Default is false
② ext_plugin_alertnow_debug: Whether to log - Default is false
③ ext_plugin_alertnow_level: Alert level (0: INFO, 1: WARN, 2: ERROR, 3: FATAL) - Default is false
④ ext_plugin_alertnow_webhook_url: Enter AlertNow Webhook URL
⑤ ext_plugin_elapsed_time_threshold: Response time threshold (ms) - Default is 0, the response time threshold is not be checked when it is 0
⑥ ext_plugin_gc_time_threshold: GGC Time threshold (ms) - Default is 0, the GC Time threshold is not be checked when it is 0
⑦ ext_plugin_thread_count_threshold: Thread Count threshold - Default is 0, the Thread Count threshold is not be checked when it is 0
⑧ ext_plugin_alertnow_xlog_enabled: Send xlog message (true/false) - Default is false
The following alerts are currently supported:
- Connect new Agent
- Disconnect Agent
- Reconnect Agent
- Elapsed Time threshold exceeded
- GC Time threshold exceeded
- Thread Count threshold exceeded
⑶ Set up Host Agent notification
Add the setting value to the conf/scouter.conf file located in the subpath of the host agent when you want to notify about the data collected by the host agent and exceed the threshold. Only CPU, Memory and Disk notifications can be set.
conf/scouter.conf
                    ### scouter host configuration
                    cpu_alert_enabled=true
                    cpu_warning_pct=90
                    cpu_fatal_pct=95
                    cpu_check_period_ms=60000
                    cpu_fatal_history=3
                    cpu_alert_interval_ms=300000

                    mem_alert_enabled=true
                    mem_alert_interval_ms=120000
                    mem_warning_pct=80
                    mem_fatal_pct=90

                    disk_alert_enabled=true
                    disk_warning_pct=70
                    disk_fatal_pct=90
CPU notification setting options
① cpu_alert_enabled: Enable or Disable cpu notification (Default: true)
② cpu_warning_pct: Percent of cpu warning level notification (Set to integer)
③ cpu_fatal_pct: Percent of cpu fatal level notification (Set to integer)
④ cpu_check_period_ms: Specify the period for checking cpu
⑤ cpu_warning_history, cpu_fatal_history: Specifies how many times the setting value of each level is exceeded to send notification (e.g. if cpu_fatal_pct is 90%, cpu_check_period_ms is 5 minutes (300000ms), and cpu_fatal_history is 3, notification will be sent when the CPU is 90% for the last 5 minutes)
⑥ cpu_alert_interval_ms: Do not send the same notification for time interval you setMemory notification setting options
① mem_alert_enabled=true
② mem_alert_interval_ms=30000
③ mem_warning_pct=80
④ mem_fatal_pct=90Disk usage notification setting options
① disk_alert_enabled=true
② disk_warning_pct=70
③ disk_fatal_pct=90
⑷ Set up Customized notification
Select the metric you want to generate a notification from Scouter Client UI.
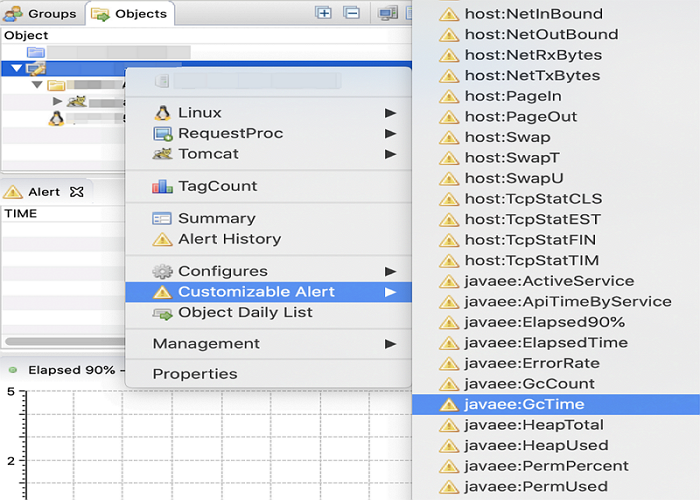
Write a custom notification script in JAVA language and save it as shown below.
Alert Script in the top left of the page is the area for writing scripts, and API Help in the top right of the page is the help page for the two parameters $counter and $$ passed to the script. Alert Configuration at the bottom left of the page is to configure an alert verification cycle, and Console Output at the bottom right is a console window that informs whether the code compiles successfully when the notification script is saved.
- Alert Configuration
① history_size=150
Scouter counter value is collected every 2 seconds. In other words, 150 means to keep up to 150 values of the recent data and data values in the past 300 seconds.
This information is used to compare with old data when writing the notification script.
② slient_time=300
This is the snooze time and this value is specified in seconds. If a notification is sent, it will not be sent for 300 seconds when the value is set.
③ check_time=2
This value is specified in seconds. Setting it to 2 runs the above notification script every 2 seconds. You can adjust it according to the value you want to measure.
Alert script files are editable directly on the Scouter server. For details, see Scripting in Scouter Server.
Amazon GuardDuty
To integrate Amazon GuardDuty with AlertNow, you need to set a topic, subscription and event rule in the AWS Console.
- Click the [Create Integration] button located on the top-left side, and select the [Amazon GuardDuty] card.
- In the [Create integration] page, enter the required information and then click the [OK] button to create the integration.
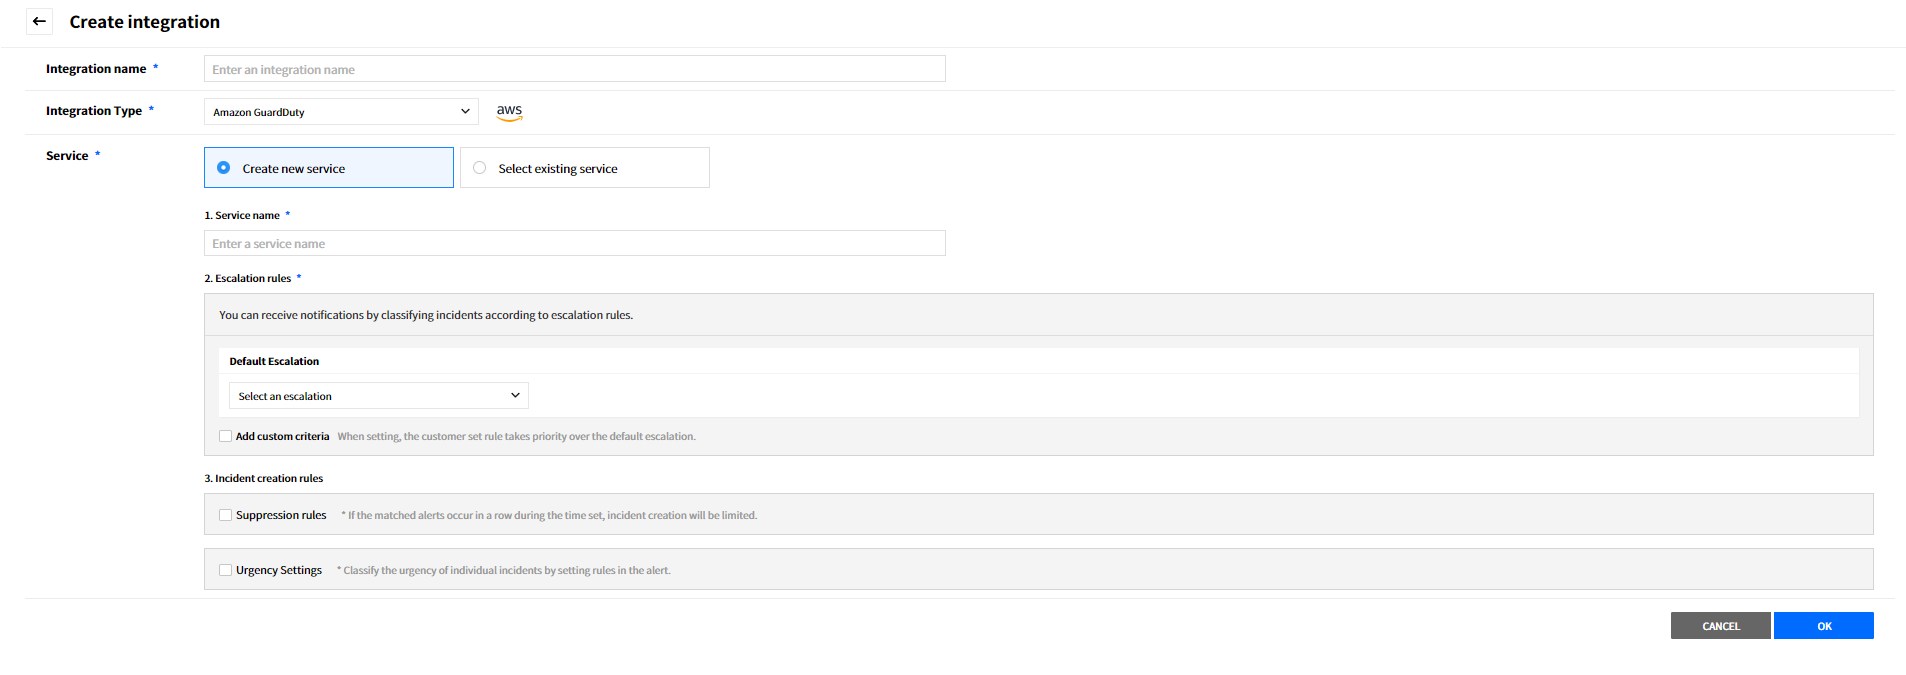
Access AWS Console
To connect AWS GuardDuty with AlertNow, you need to create a SNS topic in the AWS Console. From the AWS Console, type SNS in the search field, and then select Simple Notification Service.
Create SNS Topic and Subscription
On the Amazon SNS dashboard, select the Topics.
⑴ Create New Topic
① Select the [Create topic] located on the top-right of the page. The Create topic page will appear.
② The table below provides descriptions for each item. Click the [Create topic] button.
| Item | Description |
|---|---|
| Topic Name | It is a communication channel to send messages and subscribe notifications and used to create an ARN for later created Topics. Maximum 256 characters. Can include alphanumeric characters, hyphens (-) and underscores (_). For example, CreateSNSTopicTest: ‘arn:aws:sns:us-west-2:111122223333:CreateSNSTopicTest’ |
| Display Name | It is the name displayed for your topic when subscribing to SNS. |
⑵ Create Subscription as shown
① Select [Create subscription] located on the top-right of the page.
② The Create subscription page will appear. Click the [Create Subscription] button.
③ The table below provides descriptions for each item.
| Item | Description | Remark |
|---|---|---|
| Topic ARN | The name of Topic ARN is automatically reflected based on your Topic Name. | Can be edited |
| Protocol | Choose HTTPS for your topic to receive messages. | |
| Endpoint | Copy and paste the URL from AlertNow. | Can be edited |
⑶ Confirm Subscription
① The subscription is being created.
② Click the [Request confirmation] button on at the upper right. Approval confirmation is made for the Subscription ID.
Create CloudWatch Event Rule
① In the AWS management console, enter CloudWatch in the search field to go to the CloudWatch console. Select Events and Create rule at the left side of the page and then click [Create rule].
② In the Event section, select GuardDuty for the service name and GuardDuty finding for the event type. For Targets, Choose [Add Target] and SNS topic, and then click [Configure details].
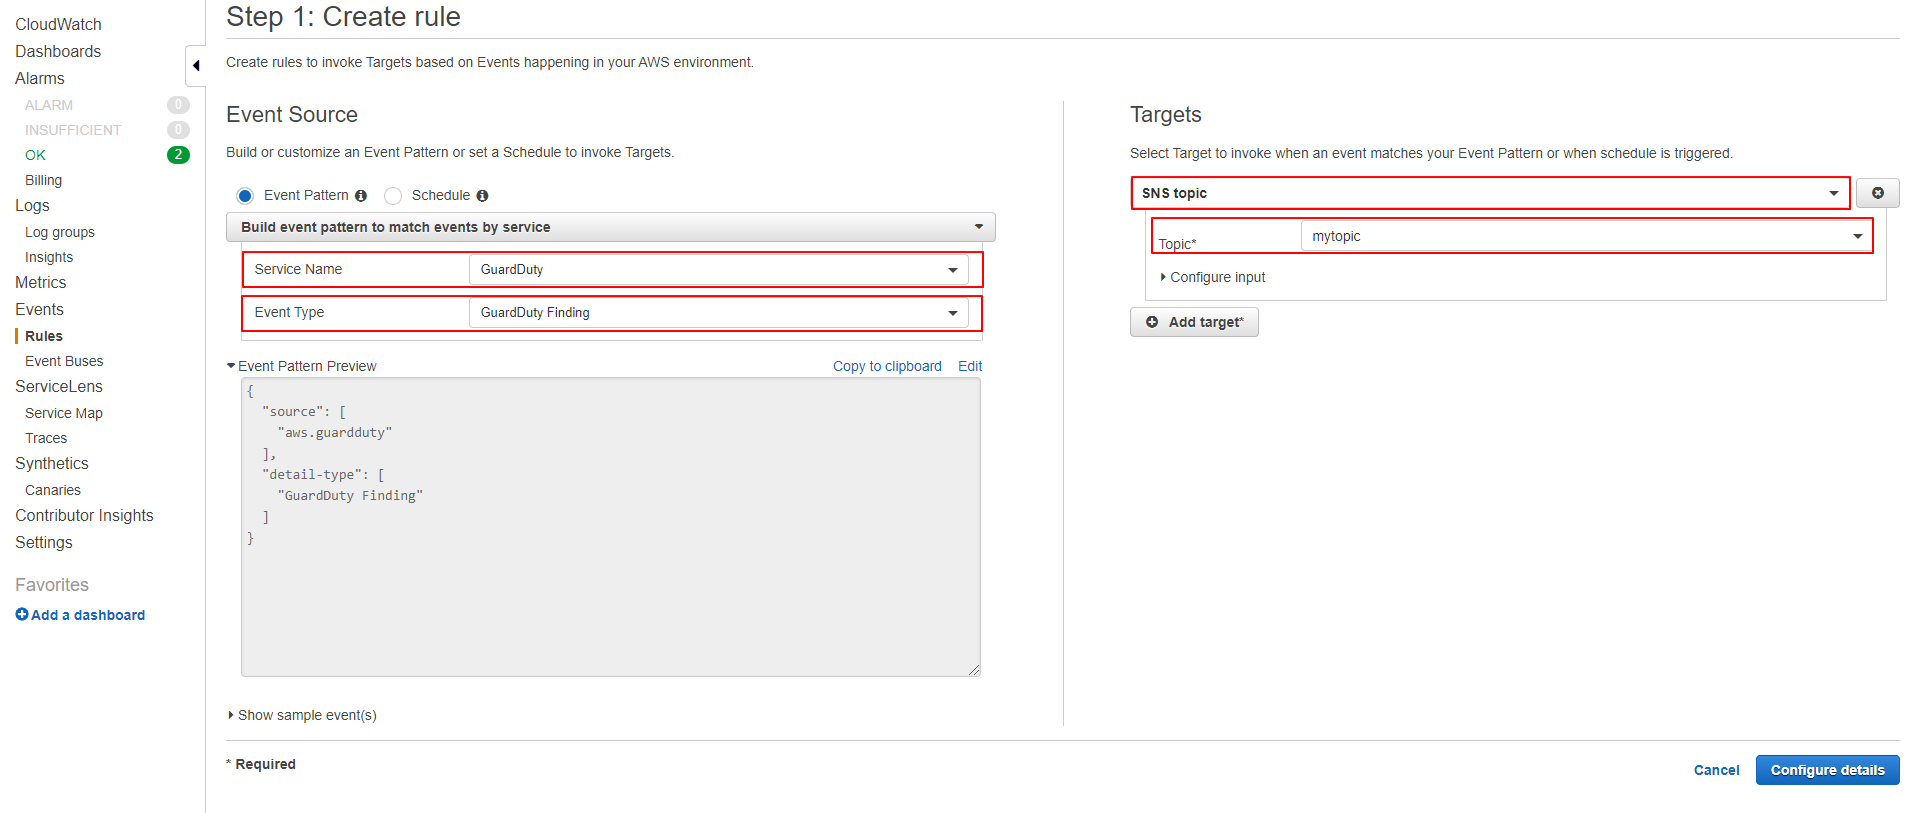
③ Enter a name for the event rule and then click [Create rule].
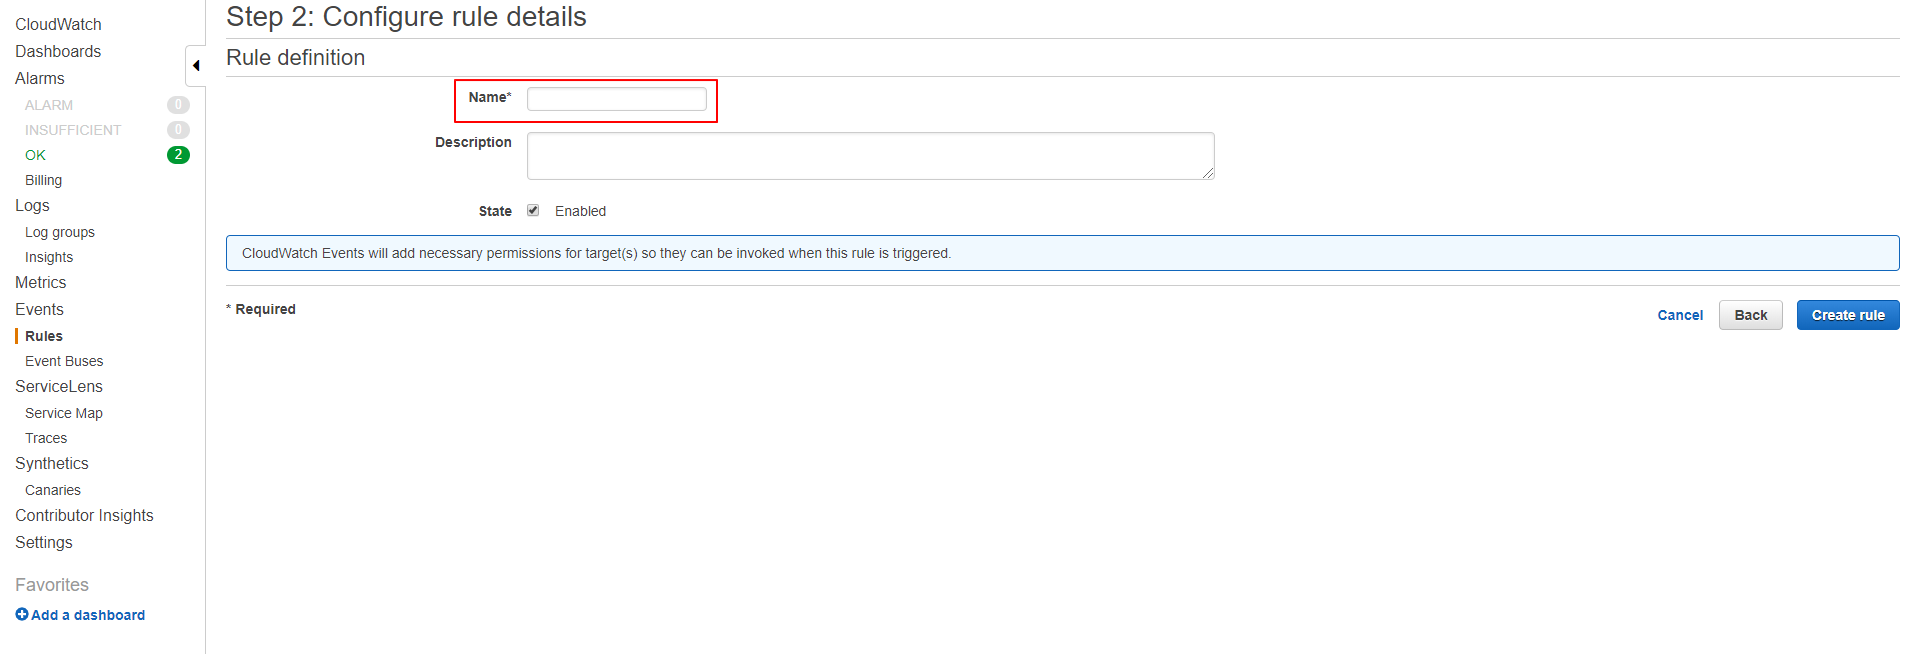
④ The rule has been created.
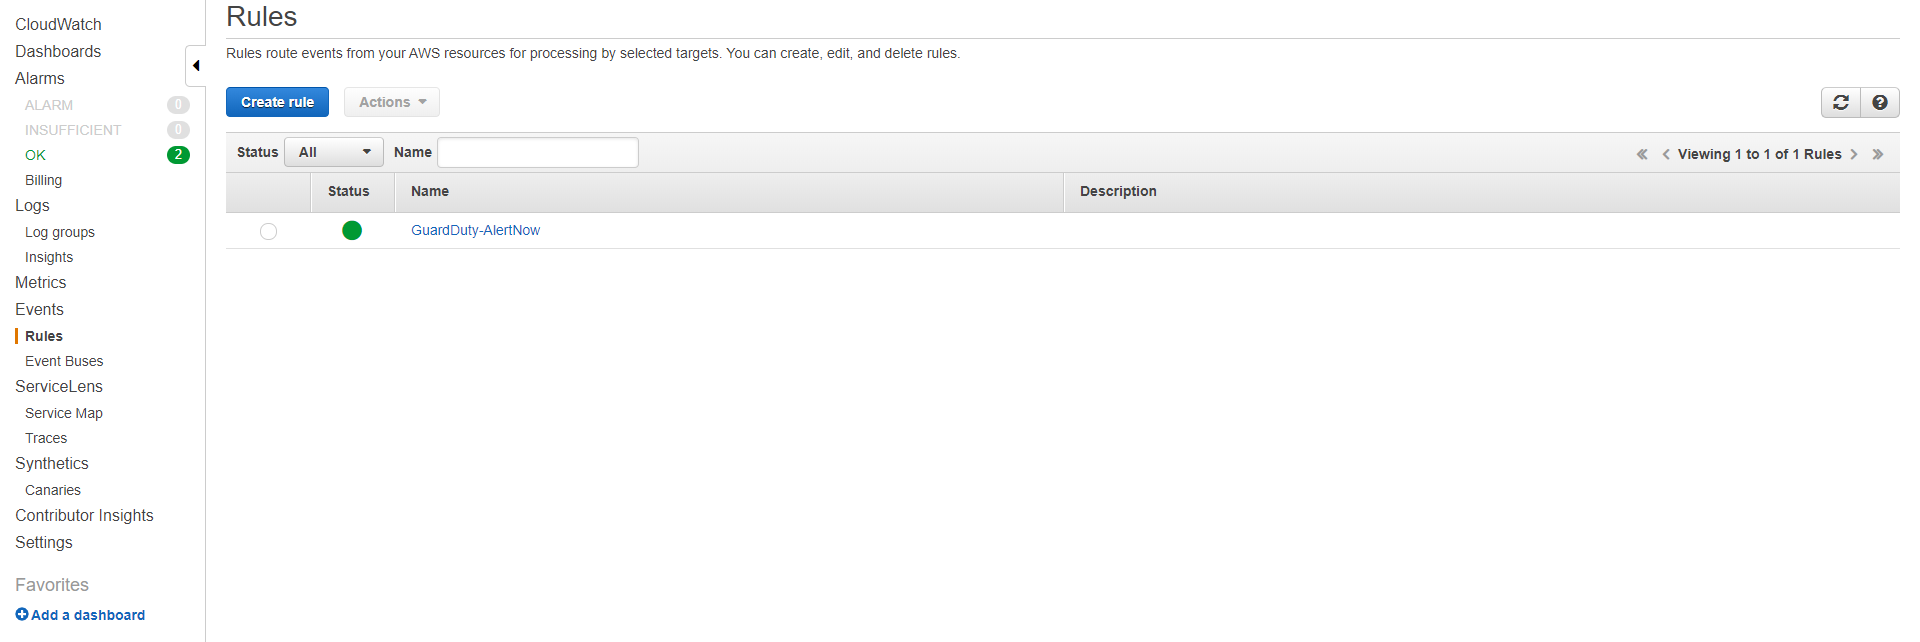
GuardDuty Sample findings
① Go to GuardDuty console and click [Generate sample findings].
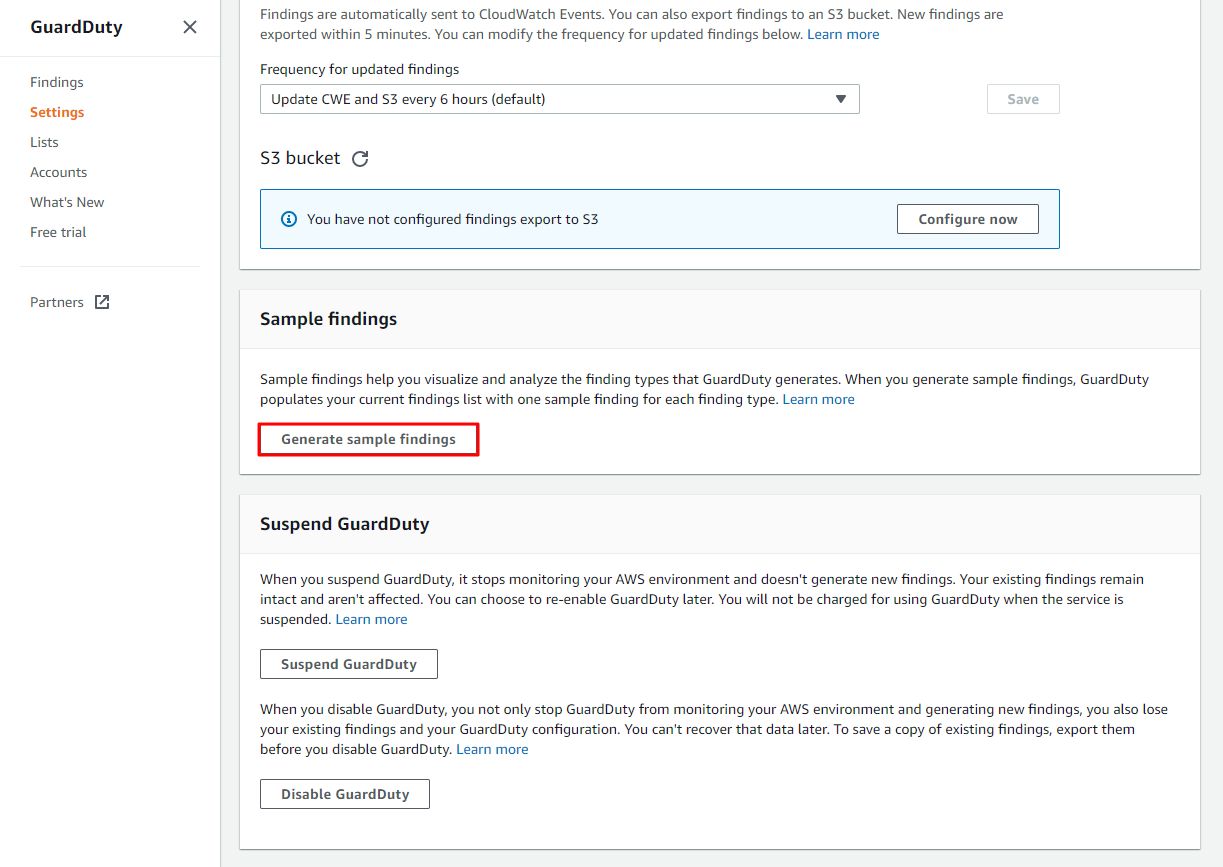
② The sample findings will be displayed in the Findings menu.
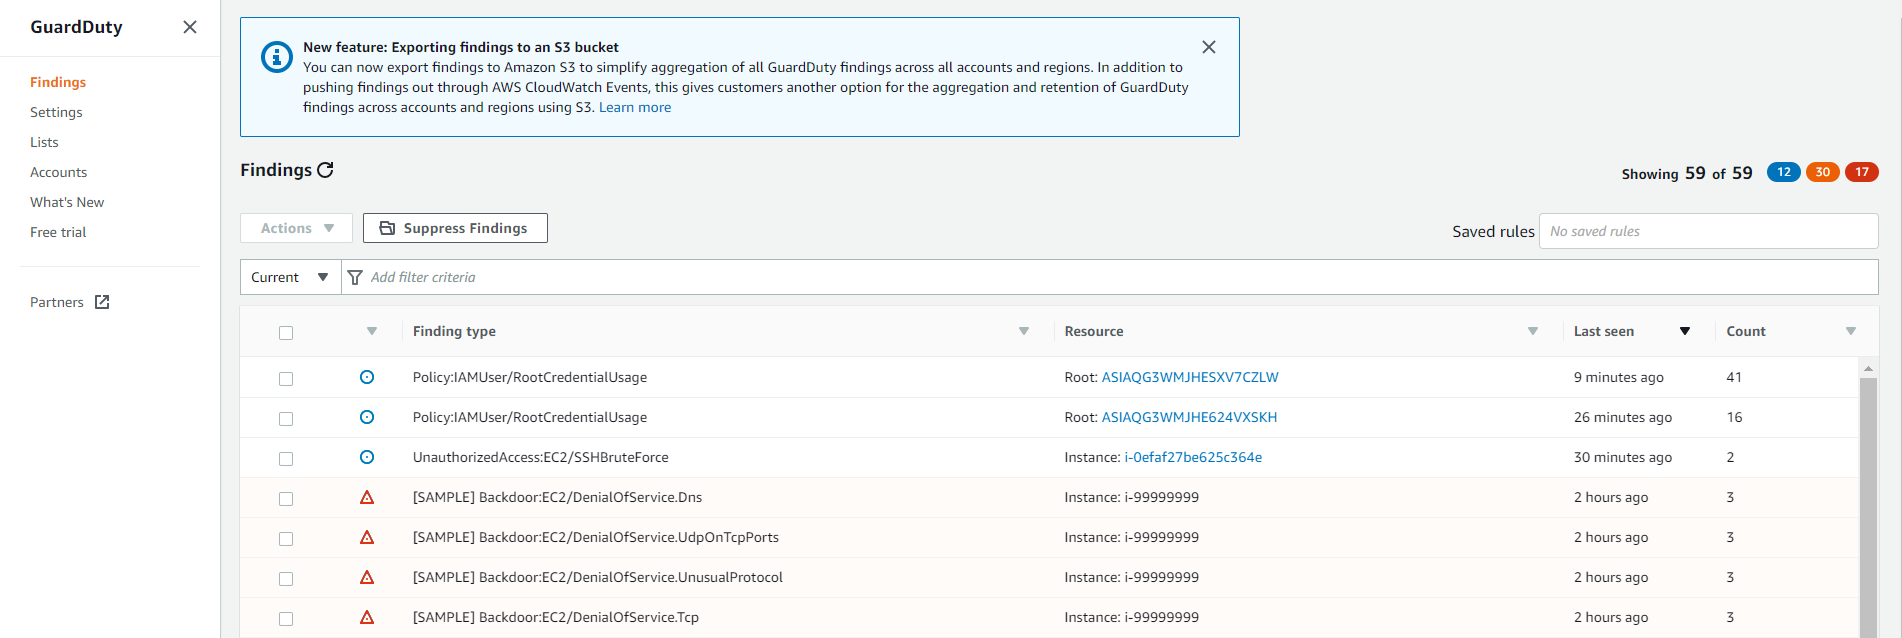
Consul
To integrate Consul with AlertNow, you need to set the Consul Server.
Click the [Create Integration] button located on the top-left side, and select the [Consul] card.
![]()
In the [Create integration] page, enter the required information and then click the [OK] button to create the integration.
![]()
Copy the Integration URL for your new integration.
![]()
Consul Server
① Install consul-alerts deamon on the Consul server based on Consul-Alerts guide.
Version v0.6.0 or later of Consul health checks based Simple Daemon for sending notifications needs to be installed
② Run Consul-Alerts.
nohup consul-alerts start --watch-checks --log-level=info &
③ Once Consul-Alerts is running, you can configure HTTP Endpoint built-in notifier using curl.
| Key | Description |
|---|---|
| enabled | Enable the http-endpoint notifier (Default: false) |
| cluster-name | The name of the cluster (Default: “Consul Alerts”) |
| base-url | Base URL of the HTTP endpoint (Mandatory) |
| endpoint | The endpoint to append to the end of base-url |
| payload | The payload to send to the HTTP endpoint (Mandatory) |
- Base URL Configuration: Configure the base-url by adding the URL created in AlertNow to {Enter AlertNow URL here}.
curl -X PUT -d '{Enter AlertNow URL here.}' http://localhost:8500/v1/kv/consul-alerts/config/notifiers/http-endpoint/base-url
- Payload Configuration: Configure the payload.
                    curl -X PUT 'http://localhost:8500/v1/kv/consul-alerts/config/notifiers/http-endpoint/payload' -H 'Content-Type: application/json' -d '{
                        "node":"{{range $name, $checks := .Nodes}}{{range $check := $checks}}{{$check.Node}}{{end}}{{end}}",
                        "serviceId":"{{range $name, $checks := .Nodes}}{{range $check := $checks}}{{$check.ServiceId}}{{end}}{{end}}",
                        "service":"{{range $name, $checks := .Nodes}}{{range $check := $checks}}{{$check.Service}}{{end}}{{end}}",
                        "checkId":"{{range $name, $checks := .Nodes}}{{range $check := $checks}}{{$check.CheckId}}{{end}}{{end}}",
                        "check":"{{range $name, $checks := .Nodes}}{{range $check := $checks}}{{$check.Check}}{{end}}{{end}}",
                        "status":"{{range $name, $checks := .Nodes}}{{range $check := $checks}}{{$check.Status}}{{end}}{{end}}",
                        "output":"{{range $name, $checks := .Nodes}}{{range $check := $checks}}{{$check.Output}}{{end}}{{end}}",
                        "notes":"{{range $name, $checks := .Nodes}}{{range $check := $checks}}{{$check.Notes}}{{end}}{{end}}",
                        "interval":"{{range $name, $checks := .Nodes}}{{range $check := $checks}}{{$check.Interval}}{{end}}{{end}}",
                        "rmdCheck":"{{range $name, $checks := .Nodes}}{{range $check := $checks}}{{$check.RmdCheck}}{{end}}{{end}}",
                        "notifList":"{{range $name, $checks := .Nodes}}{{range $check := $checks}}{{$check.NotifList}}{{end}}{{end}}",
                        "varOverrides":"{{range $name, $checks := .Nodes}}{{range $check := $checks}}{{$check.VarOverrides}}{{end}}{{end}}",
                        "timestamp":"{{range $name, $checks := .Nodes}}{{range $check := $checks}}{{$check.Timestamp}}{{end}}{{end}}"
                    }'
- Enabled: set
consul-alerts/config/notifiers/http-endpoint/enabledto tru
curl -X PUT -d 'true' http://localhost:8500/v1/kv/consul-alerts/config/notifiers/http-endpoint/enabled
- Verify the settings: When setup is complete, you can see this in Key/Value Store.
![]()
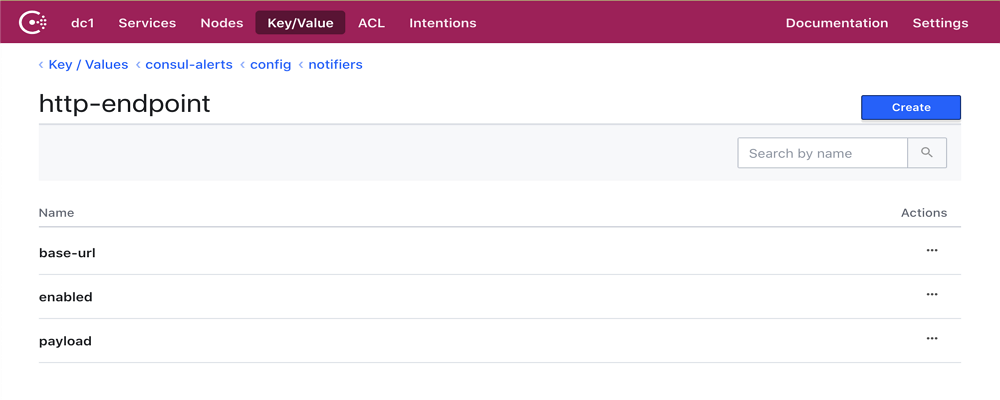
④ Consul-Alerts will open the alert once health checks are critical.
⑤ Consul-Alerts will resolve the alert once health checks are passing.
Jennifer4
To integrate Jennifer4 with AlertNow, you need to configure Adapter in the Jennifer Server.
Click the [Create Integration] button located on the top-left side, and select the [Jennifer4] card.
![]()
In the [Create integration] page, enter the required information and then click the [OK] button to create the integration.
![]()
Copy the Integration URL for your new integration.
![]()
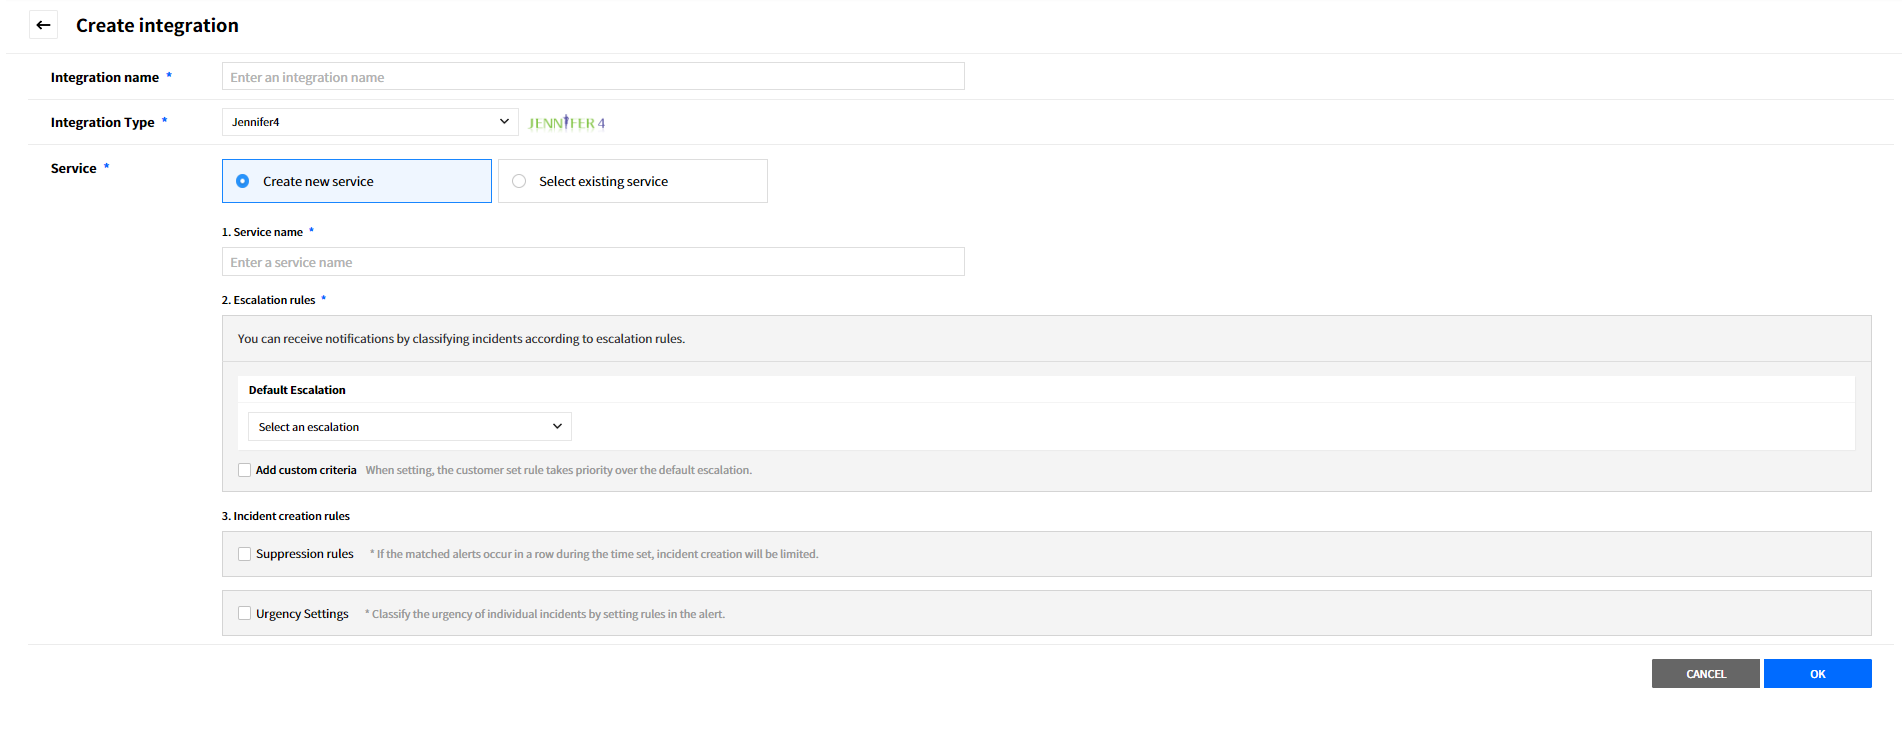
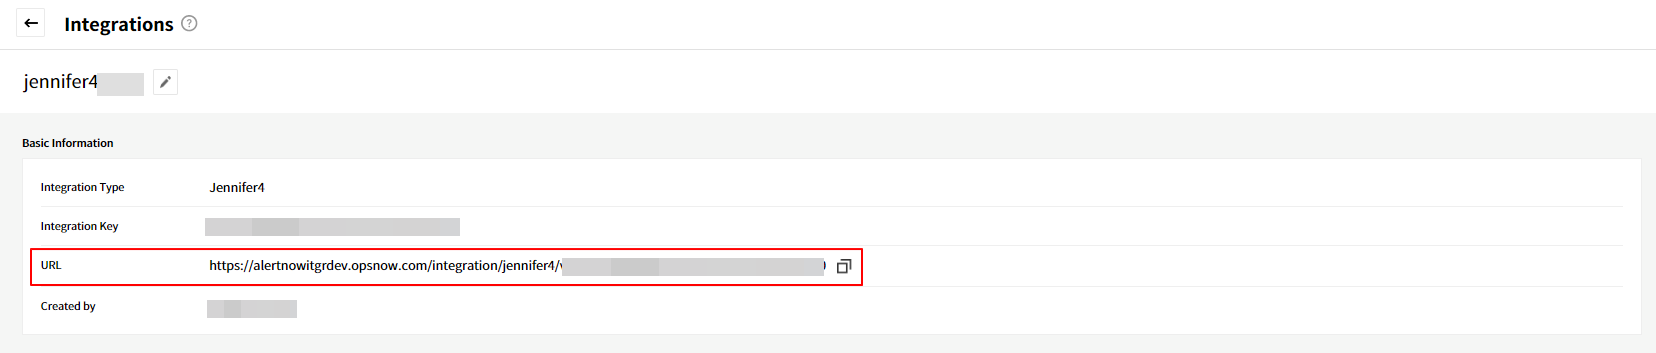
Download Jennifer4 Adapter for AlertNow
To integrate Jennifer, click [Download Jennifer Adapter for AlertNow] to download. Jennifer4 is not compatible with Jennifer5 version.
- JDK versions available for integration with AlertNow
① jdk 1.5: Not available
② jdk 1.6: Not available
③ jdk 1.7: Available (7 ~ 7u80, including OpenJDK)
④ jdk 1.8: Available (8 ~ 8u241, including OpenJDK)
*Jennifer4 supports JDK 1.5 to 1.8, but you must be using JDK 1.7 or later to integrate with AlertNow.
Configure Adapter
① Shutdown the running Jennifer Server by executing shutdown.sh in the /{Jennifer4 Server Home}/bin directory.
② Open AlertNowNotiAdapter.java file using the vi Editor or Document Editor. The file must be saved in UTF-8 encoding. Changing the encoding might cause compile failure.
③ Paste the URL for the integration created in AlertNow to within double quotes in the private static final String ALERTNOW_JENNIFER_INTEGRATION_URL as shown below.
📑 Note: Do not modify any information except Webhook URL. If other information is changed, the integration with AlertNow may not work properly.

④ Move the modified file to /{Jennifer4 Server Home}/common/lib directory.
⑤ Ensure that jenniferserver.jar file exists in /{Jennifer4 Server Home}/common/lib directory. If it does not exist, please contact your Server administrator or Jennifer Support.
⑥ If the file exists in /{Jennifer4 Server Home}/common/lib directory, move AlertNowNotiAdapter.java file in the directory and use the following commands to compile them.
                    ⑴  javac -d . -cp ./jenniferserver.jar AlertNowNotiAdapter.java
                    ⑵  jar uvf jenniferserver.jar ./com
⑦ If you are running the javac command, com directory is created at /{Jennifer4 Server Home}/common/lib and the class file for AlertNowNotiAdapter.java is located in the directory.
⑧ When the class file is created after running the javac command, use the jar uvf command to merge/compile source code.
⑨ After merging AlertNowNotiAdapter.java file, move to /{Jennifer4 Server Home}/bin directory. Modify jennifer.properties file using the vi Editor or Document Editor as shown below.
sms_adapter_class_name = com.javaservice.jennifer.server.AlertNowNotiAdapter
⑩ The sms_adapter_class_name exists in both Auto-notification and Customize. Only the one should be activated and modified. If not, both will not work.
⑪ Run startup.sh in the /{Jennifer4 Server Home}/bin directory to start Jennifer4 server. To integrate alerts from Jennifer4 with AlertNowNotiAdapter, configure alert and SMS settings as below. When the TOT and Agent IDs are displayed in the Type for Alert Management in Properties, click the IDs to set the alerts. Select the alert list and move it to the right side, and then select Enable Alert and Enable SMS check boxes.
SMS is the only external interface of Jennifer4 and it is configured with AlertNow Adapter. Thus, you should select Enable SMS to integrate with AlertNow.
If Enable Alert and Enable SMS are not enabled, the alert list can only be seen in the Web Monitoring and it does not integrate with the external service.
![]()
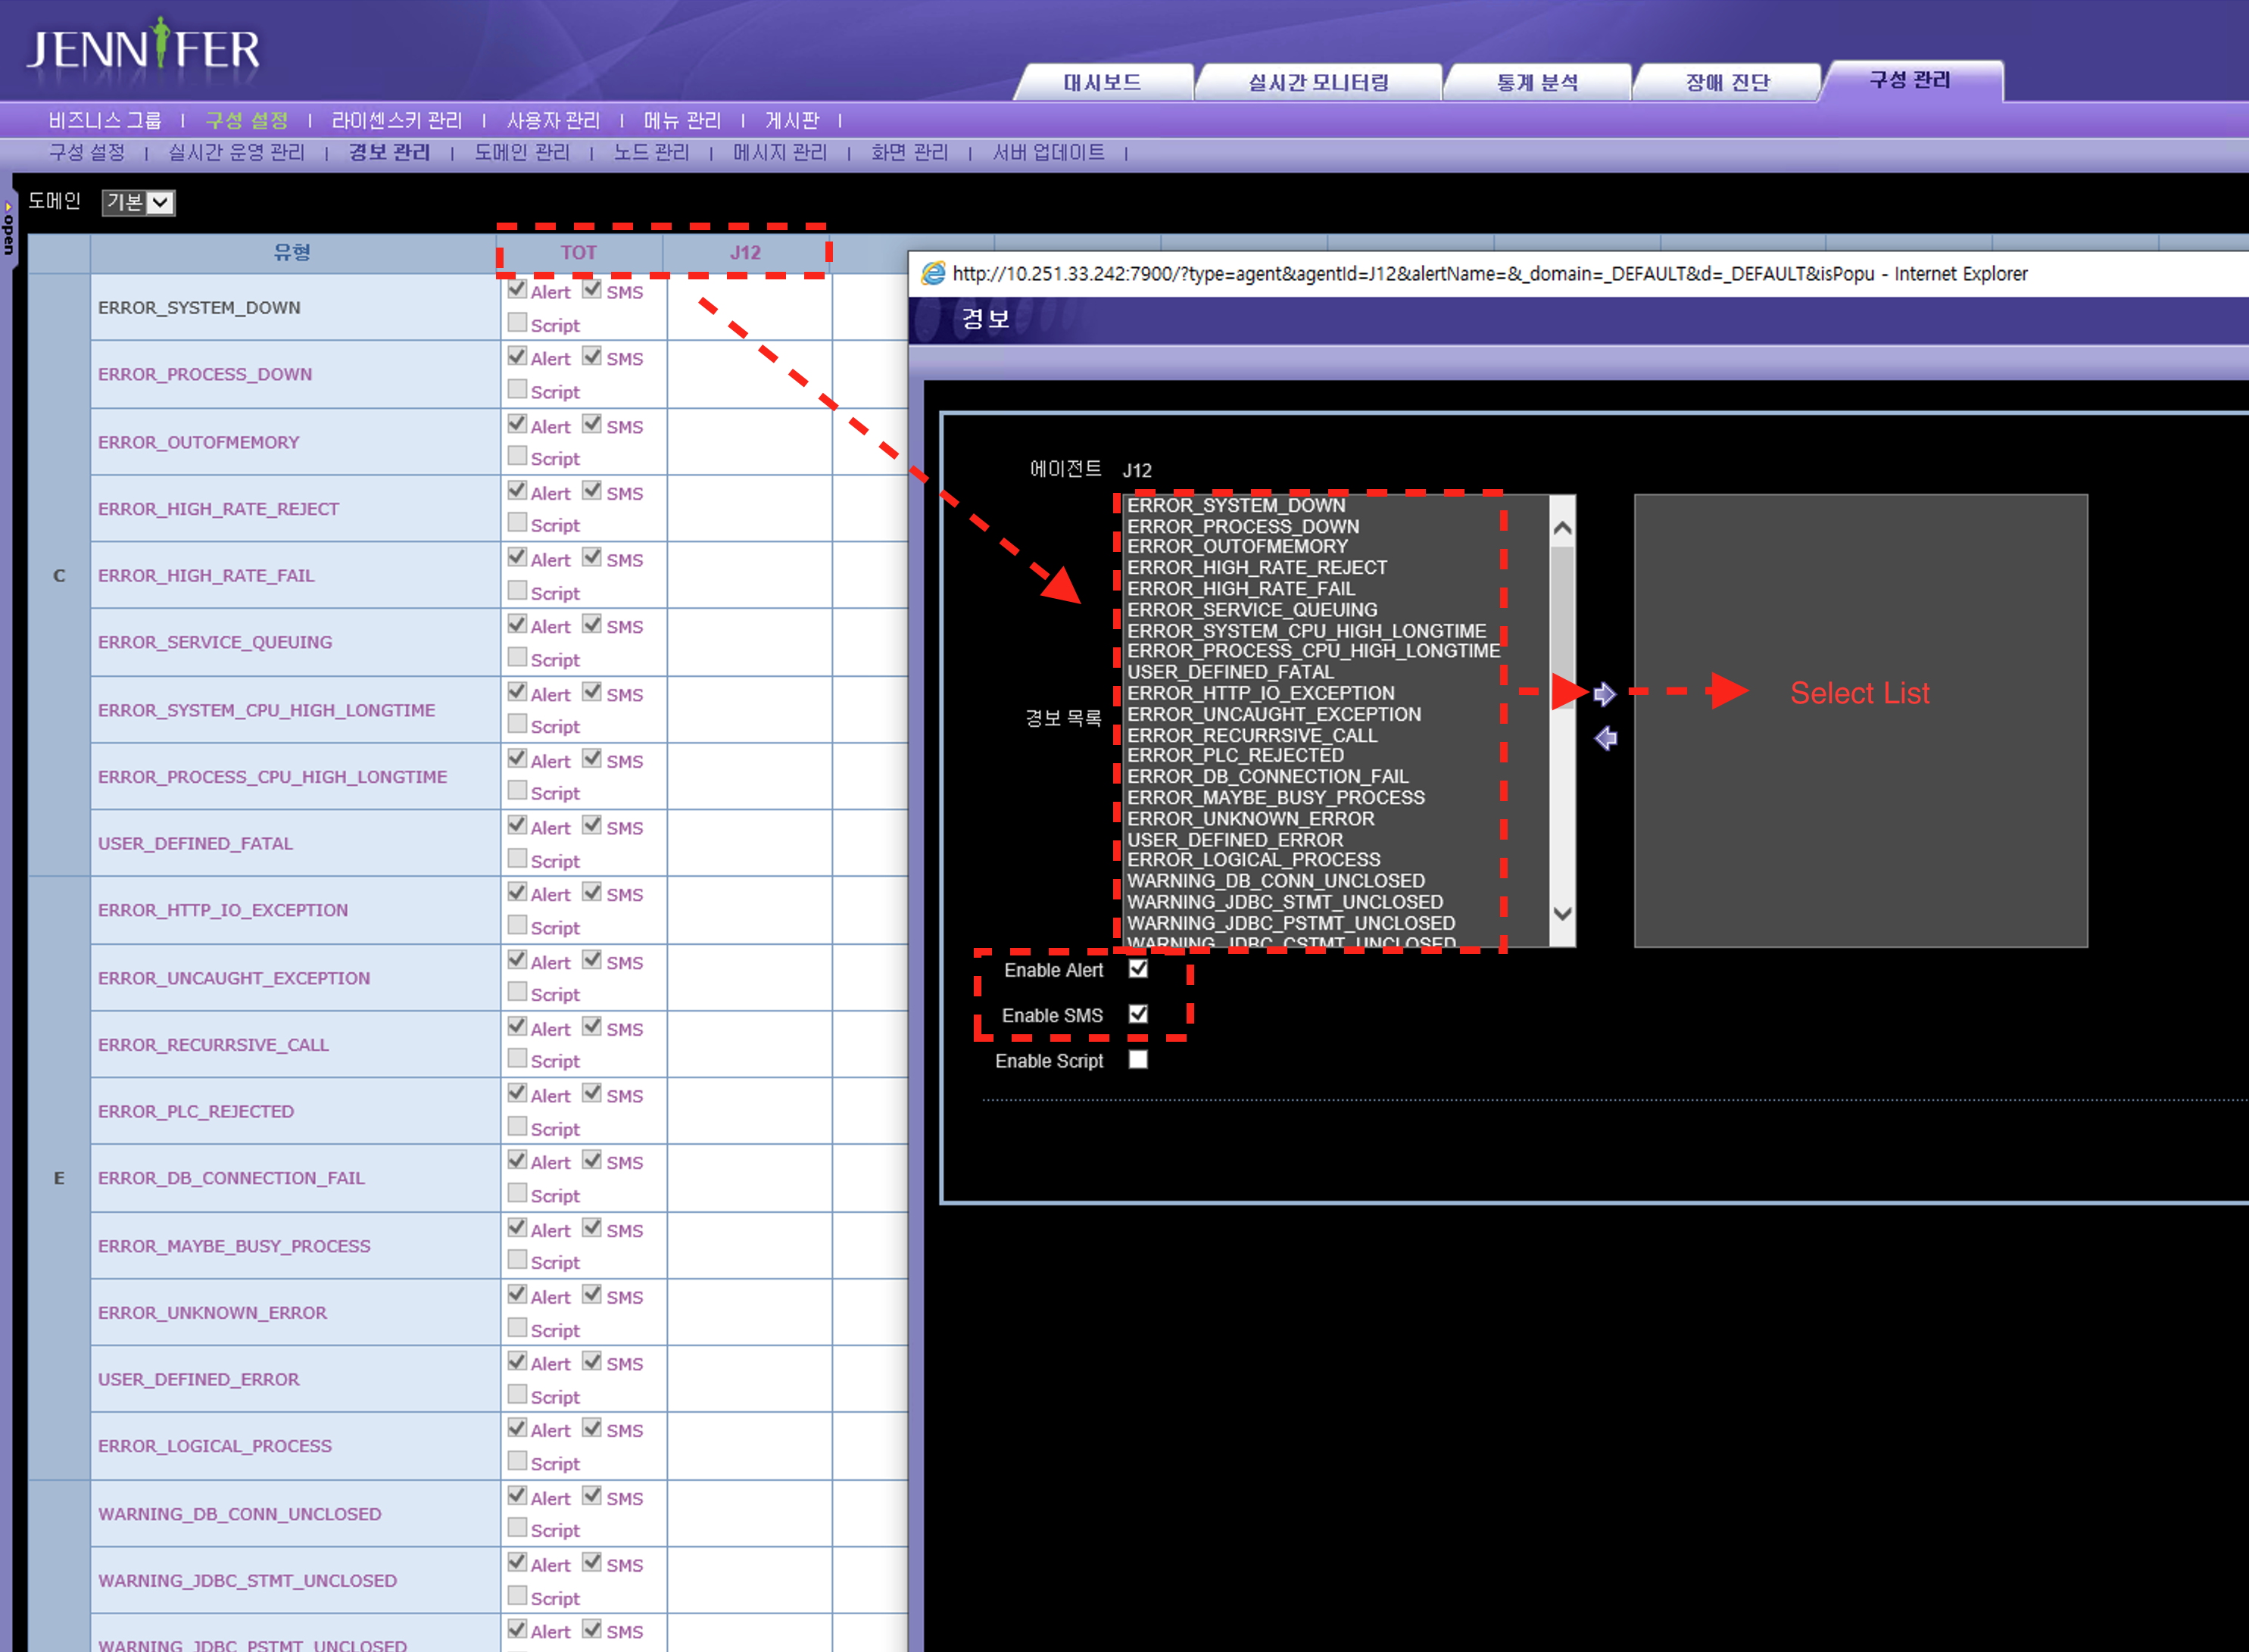
⑫ See the Log for Adapter at / {Jennifer4 Server Home}logs/catalina.out.

WhaTap
To integrate WhaTap with AlertNow, you need to configure a webhook in the WhaTap Server.
Click the [Create Integration] button located on the top-left side, and select the [WhaTap] card.
![]()
Create integration page will be displayed as below. Enter the required information and then click the [OK] button to create the integration.
![]()
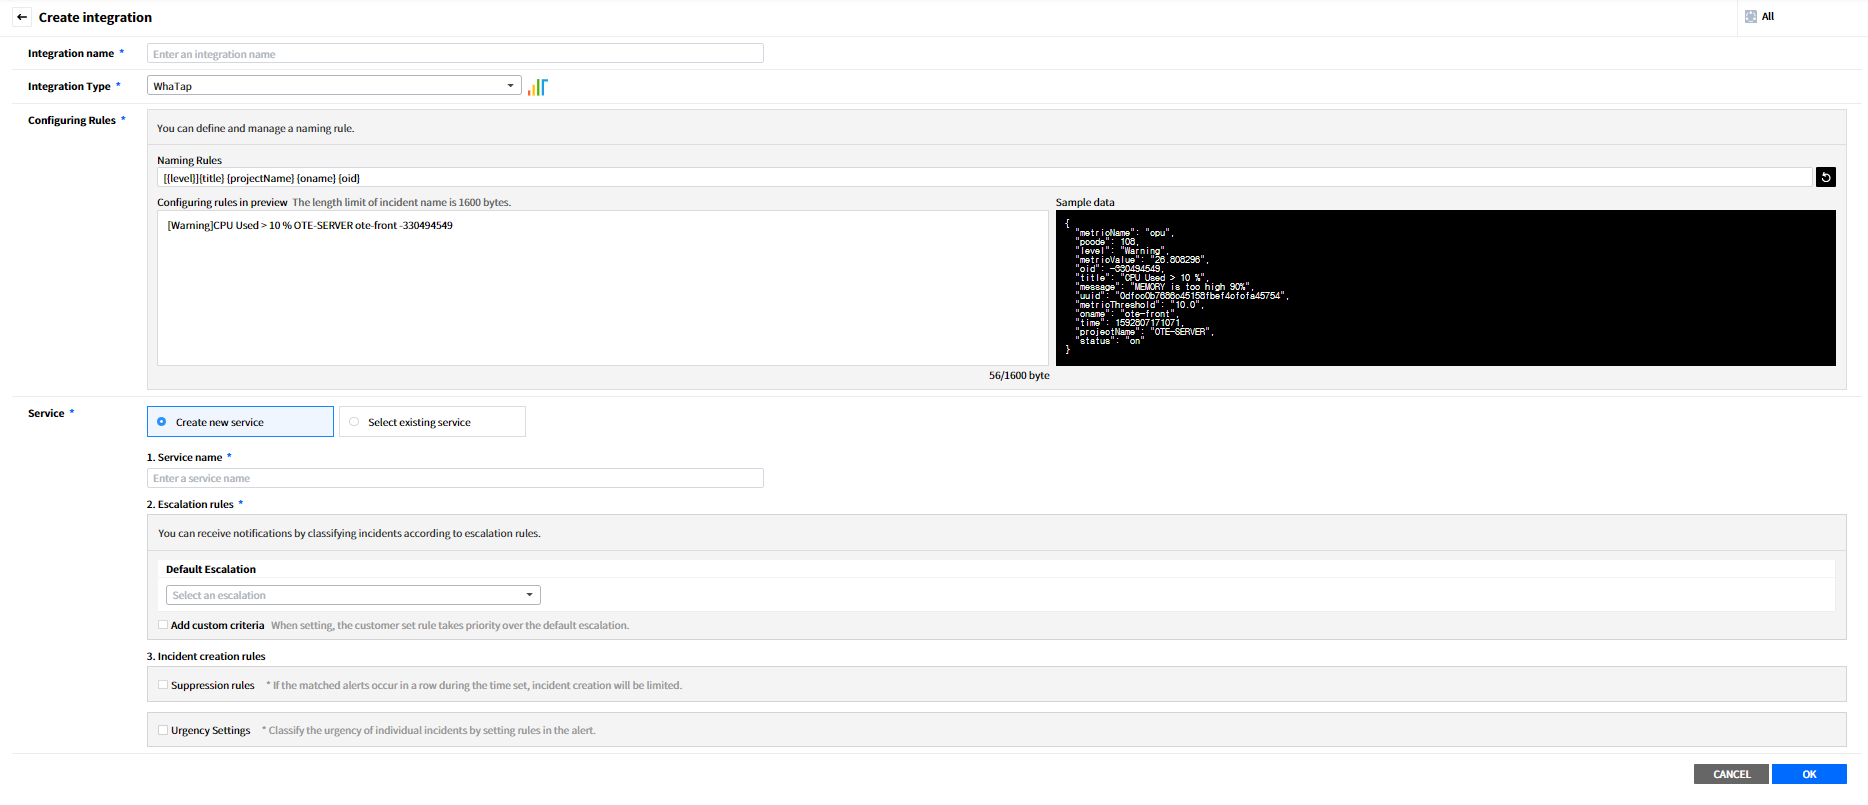
Webhook Configuration
① Sign in to WhaTap, and select the project in the project list.
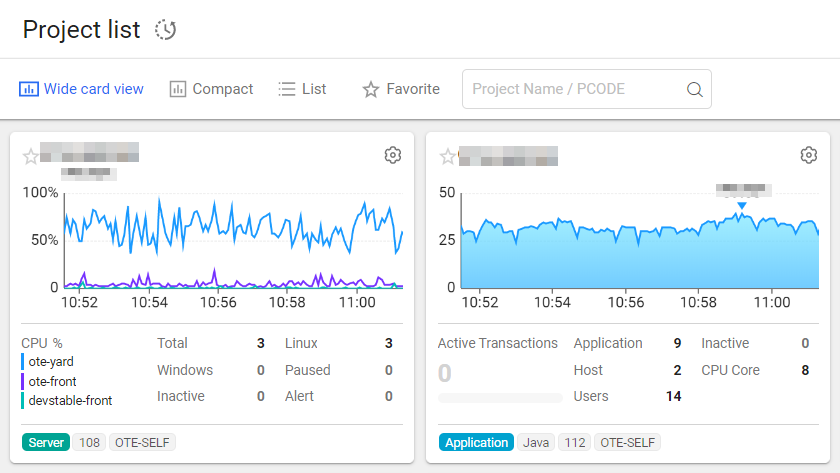
② Select Alert > Alert Reception CONF. located on the left side of the page.
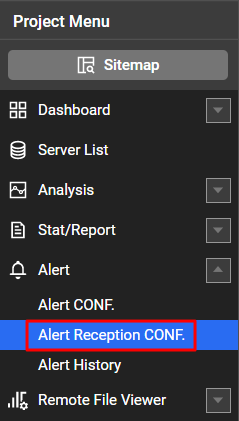
③ Click the [Add] button from the 3rd Party Plugin.
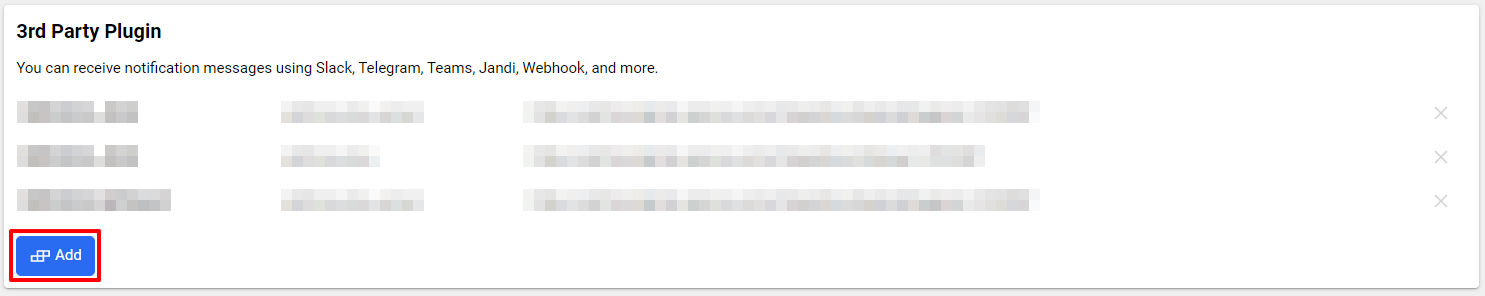
④ Select the [AlertNow] tap and enter a channel name. Then copy the URL for the integration created in AlertNow and paste it to Webhook URL field, and then click the [Add] button.
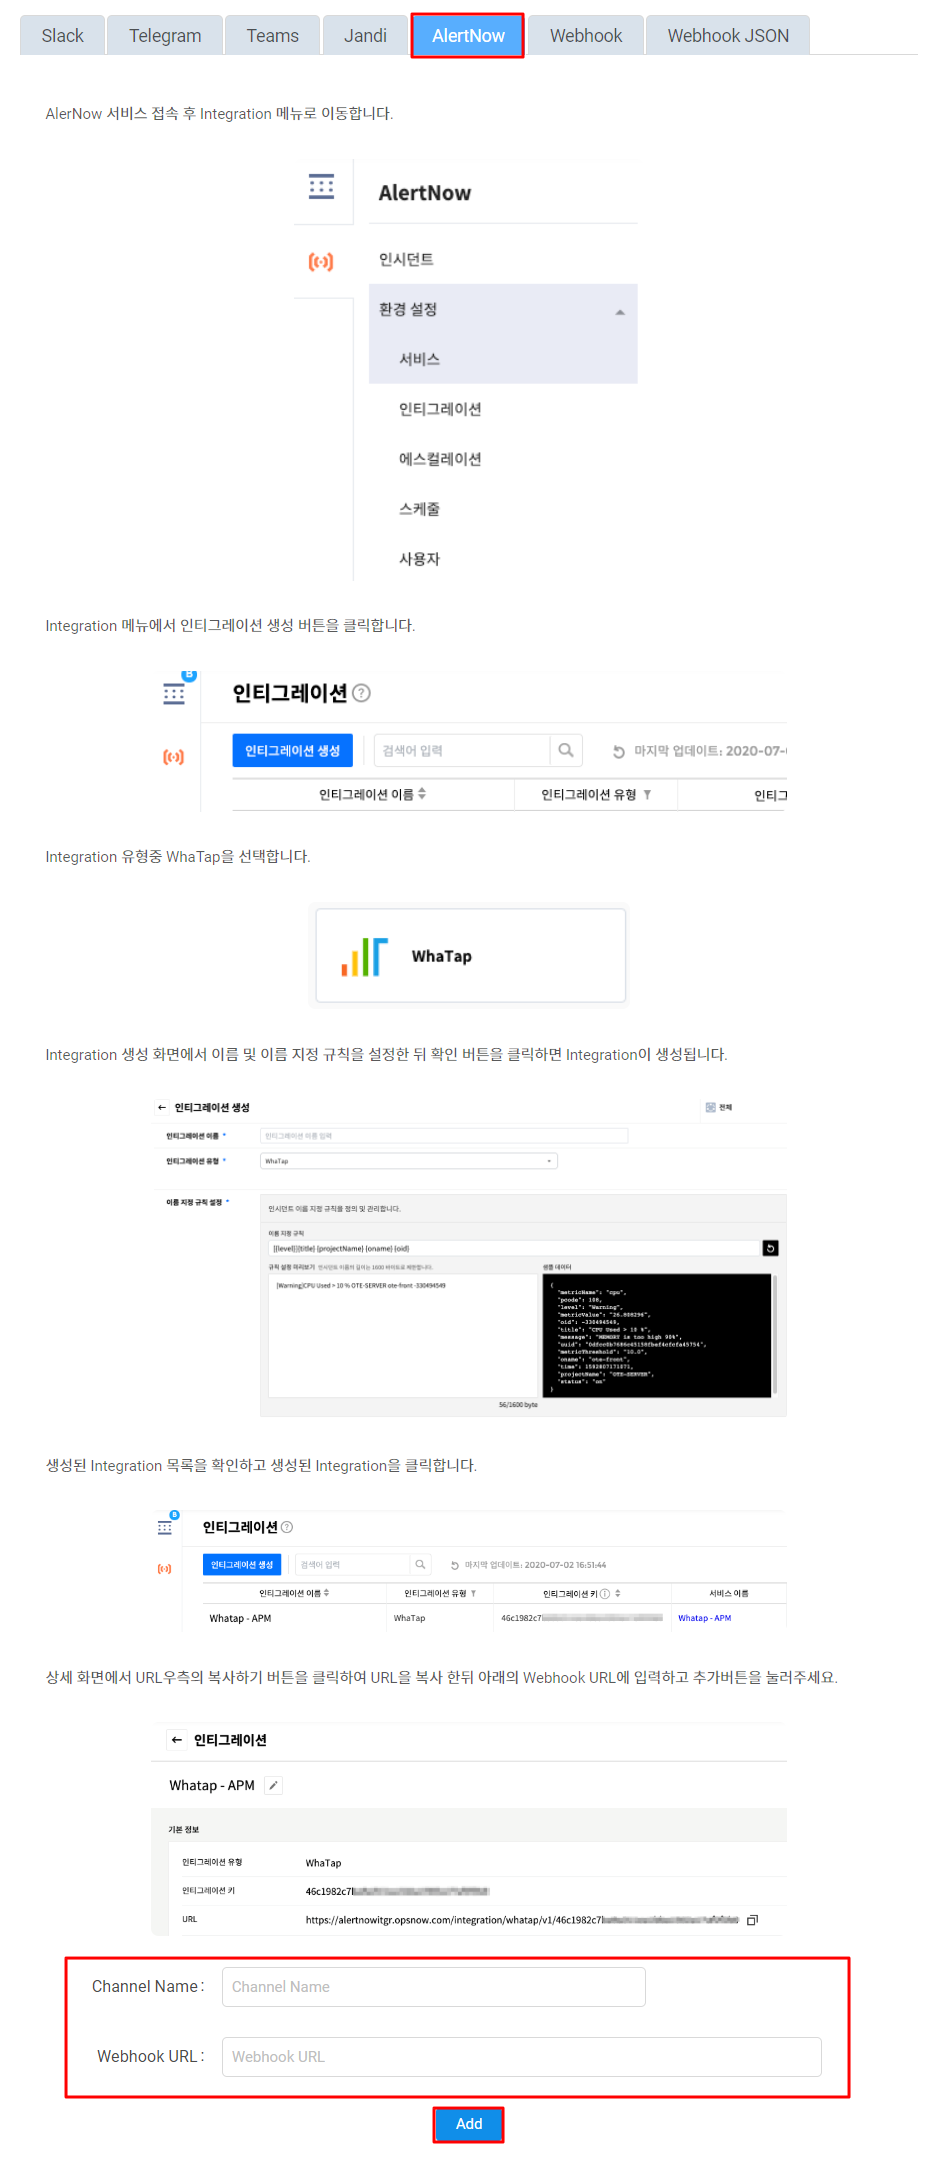
⑤ Select [Alert] > [Alert CONF.] located on the left side of the page.
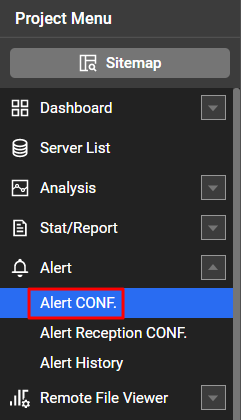
⑥ Set the alert policy, and then click the [Save] button to complete the configuration.
Zenius
To integrate Zenius with AlertNow, you need to set notifications and surveillance in the Zenius console.
Click the [Create Integration] button located on the top-left side, and select the [Zenius] card.
![]()
In the Create integration page, enter the required information and then click the [OK] button to create the integration.
![]()
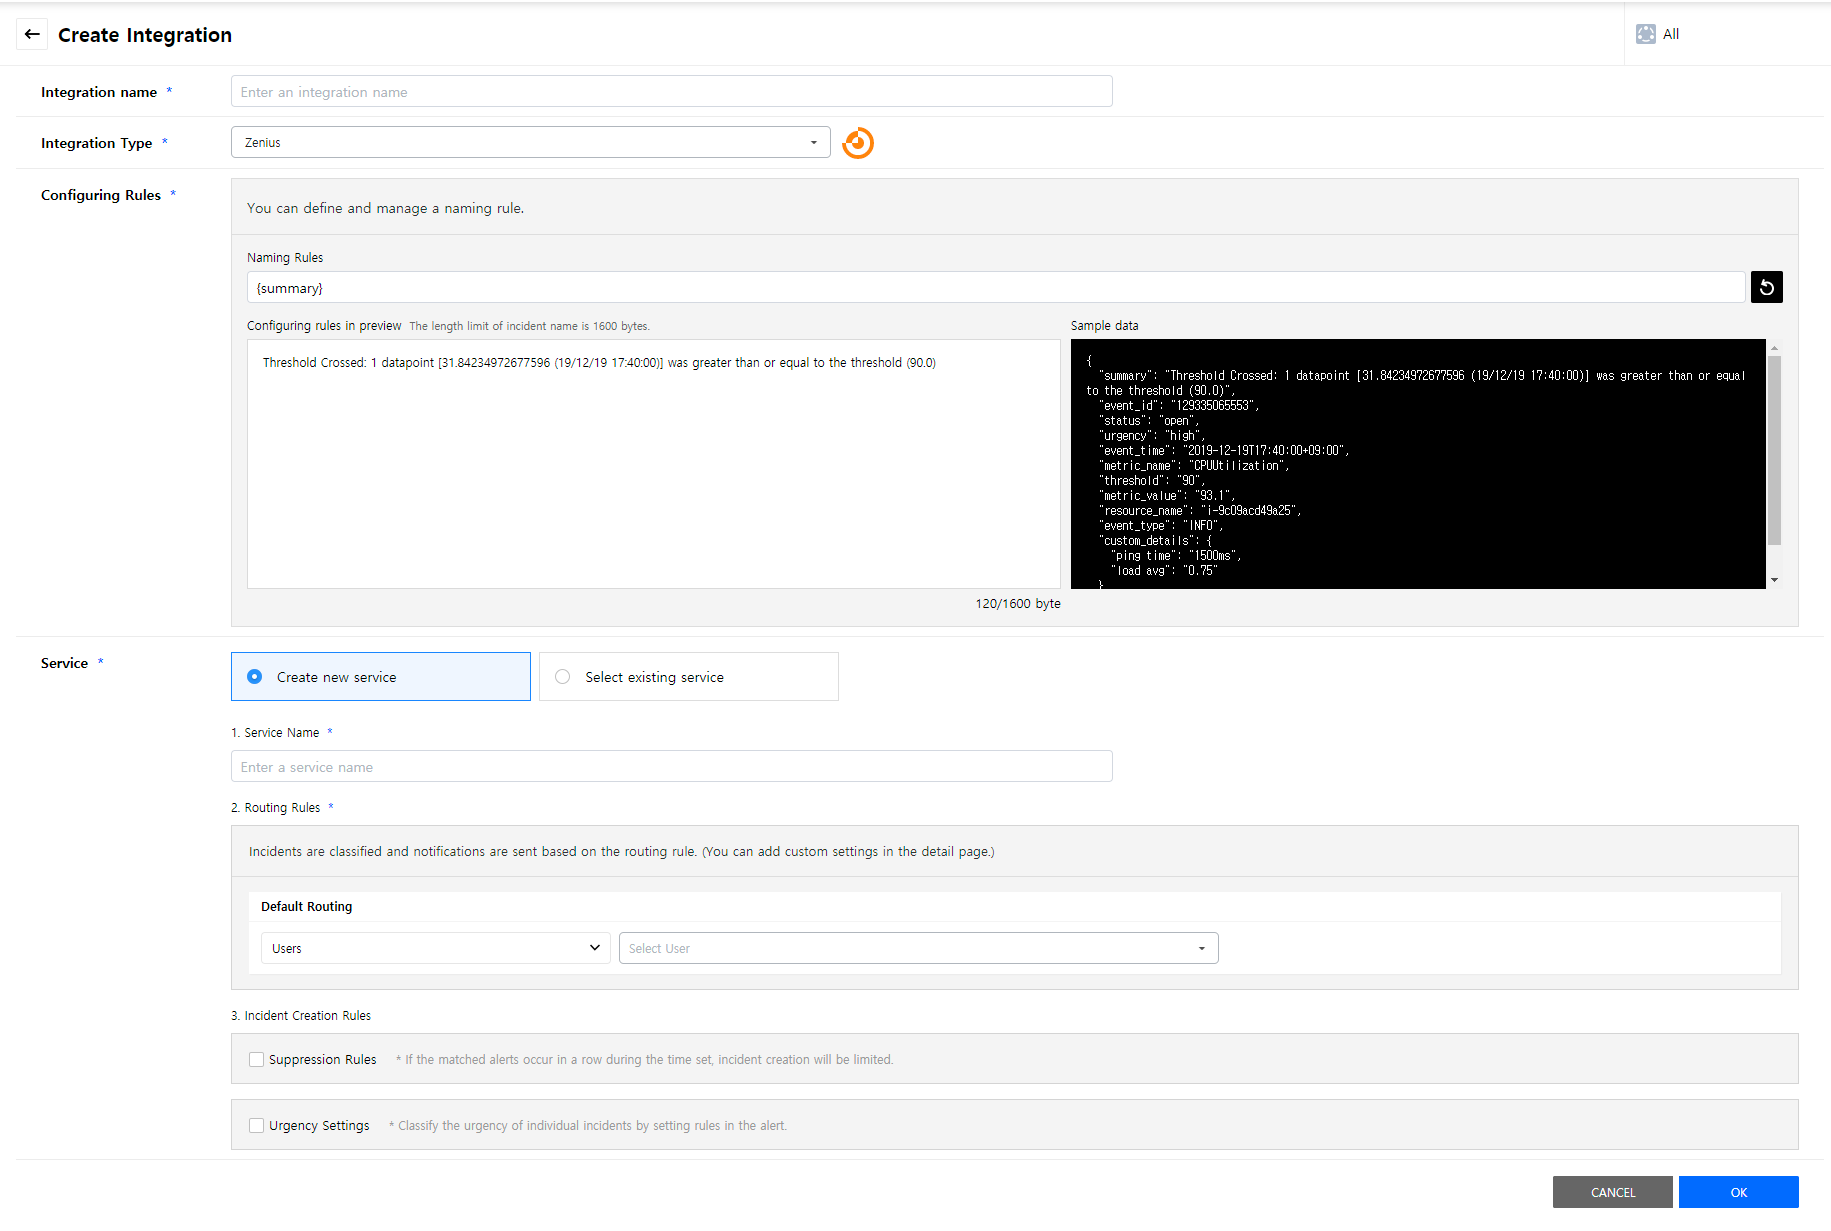
Notification Settings
① Sign in to Zenius with a Super account.
② Select [Operation] > [Environment Settings] > [Notification] from the Zenius dashboard. AlertNow is already registered, and the default is set to Not active. You need to change it to Activate. Then, register AlertNow by selecting [Register] from the notification settings.
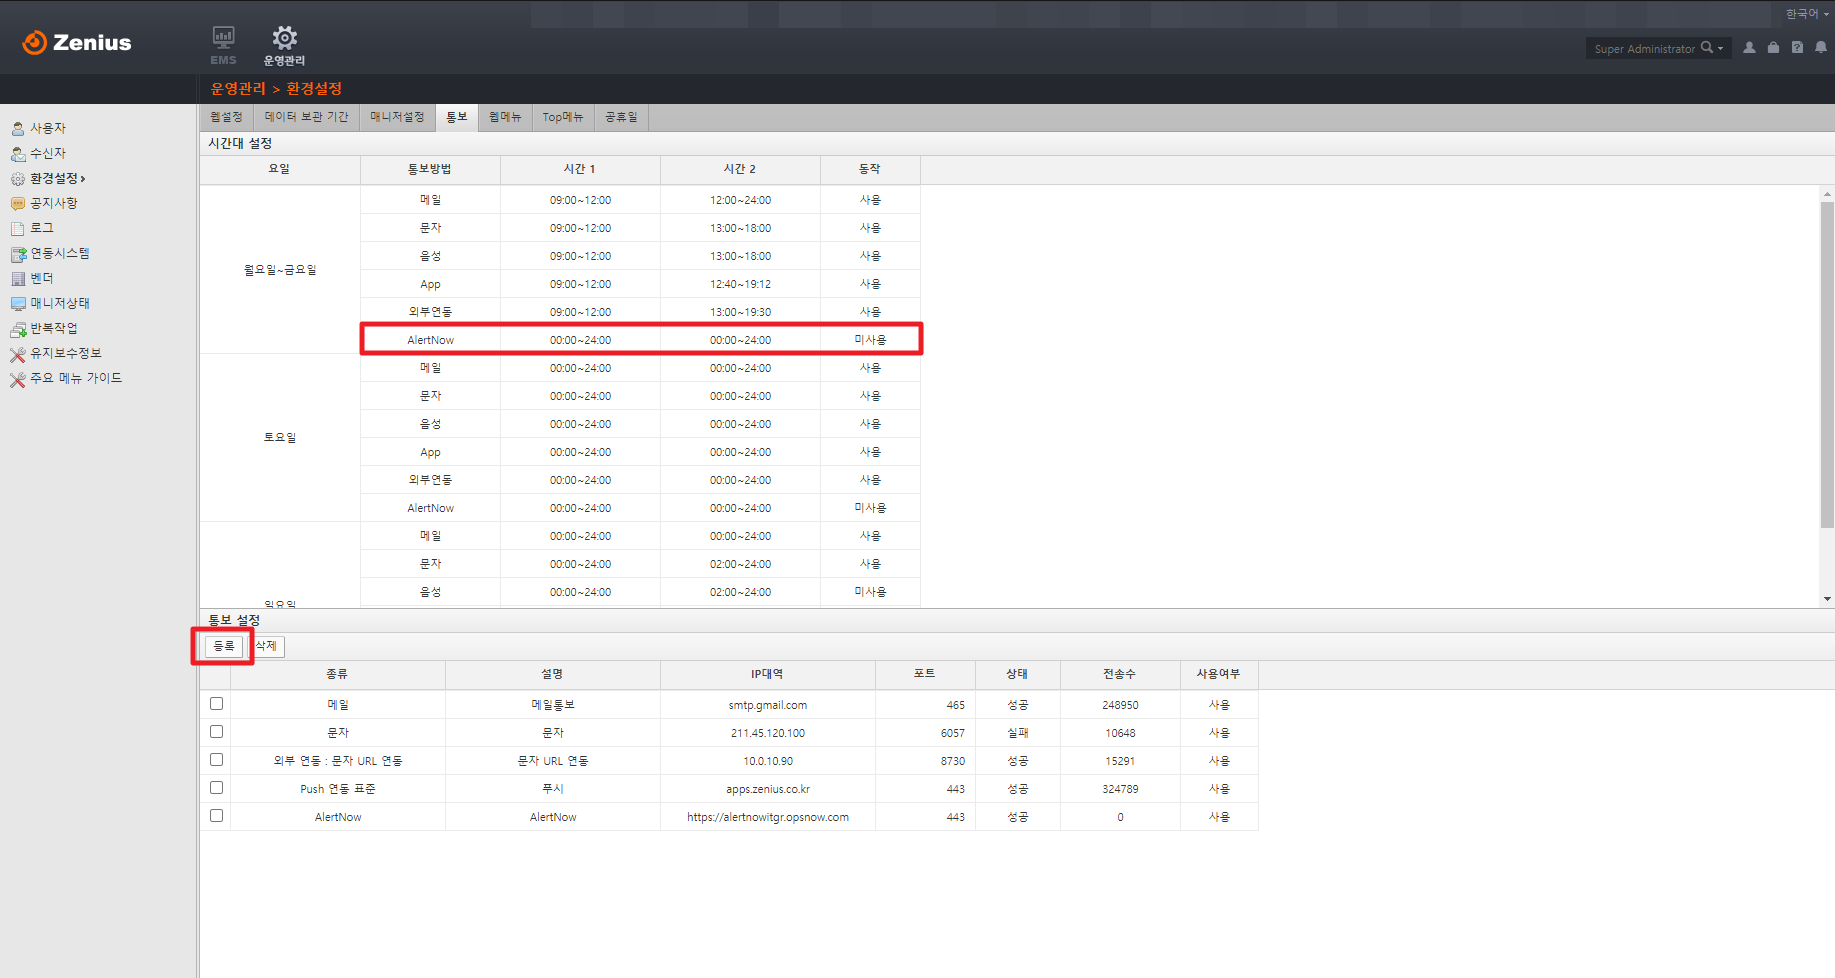
③ In the Notification Settings window, select AlertNow as type. Enter required information and click the [OK] button.
• Description: Enter a name and description (e.g.: AlertNow integration)
• Host & Port: Enter host address and port number to access (https://alertnowitgr.opsnow.com,443)
• URL: Enter the Integration URL created in AlertNow (integration/zenius/v1/b32a7d2835c65111eb1b97b70a8d4ec9fa9c)
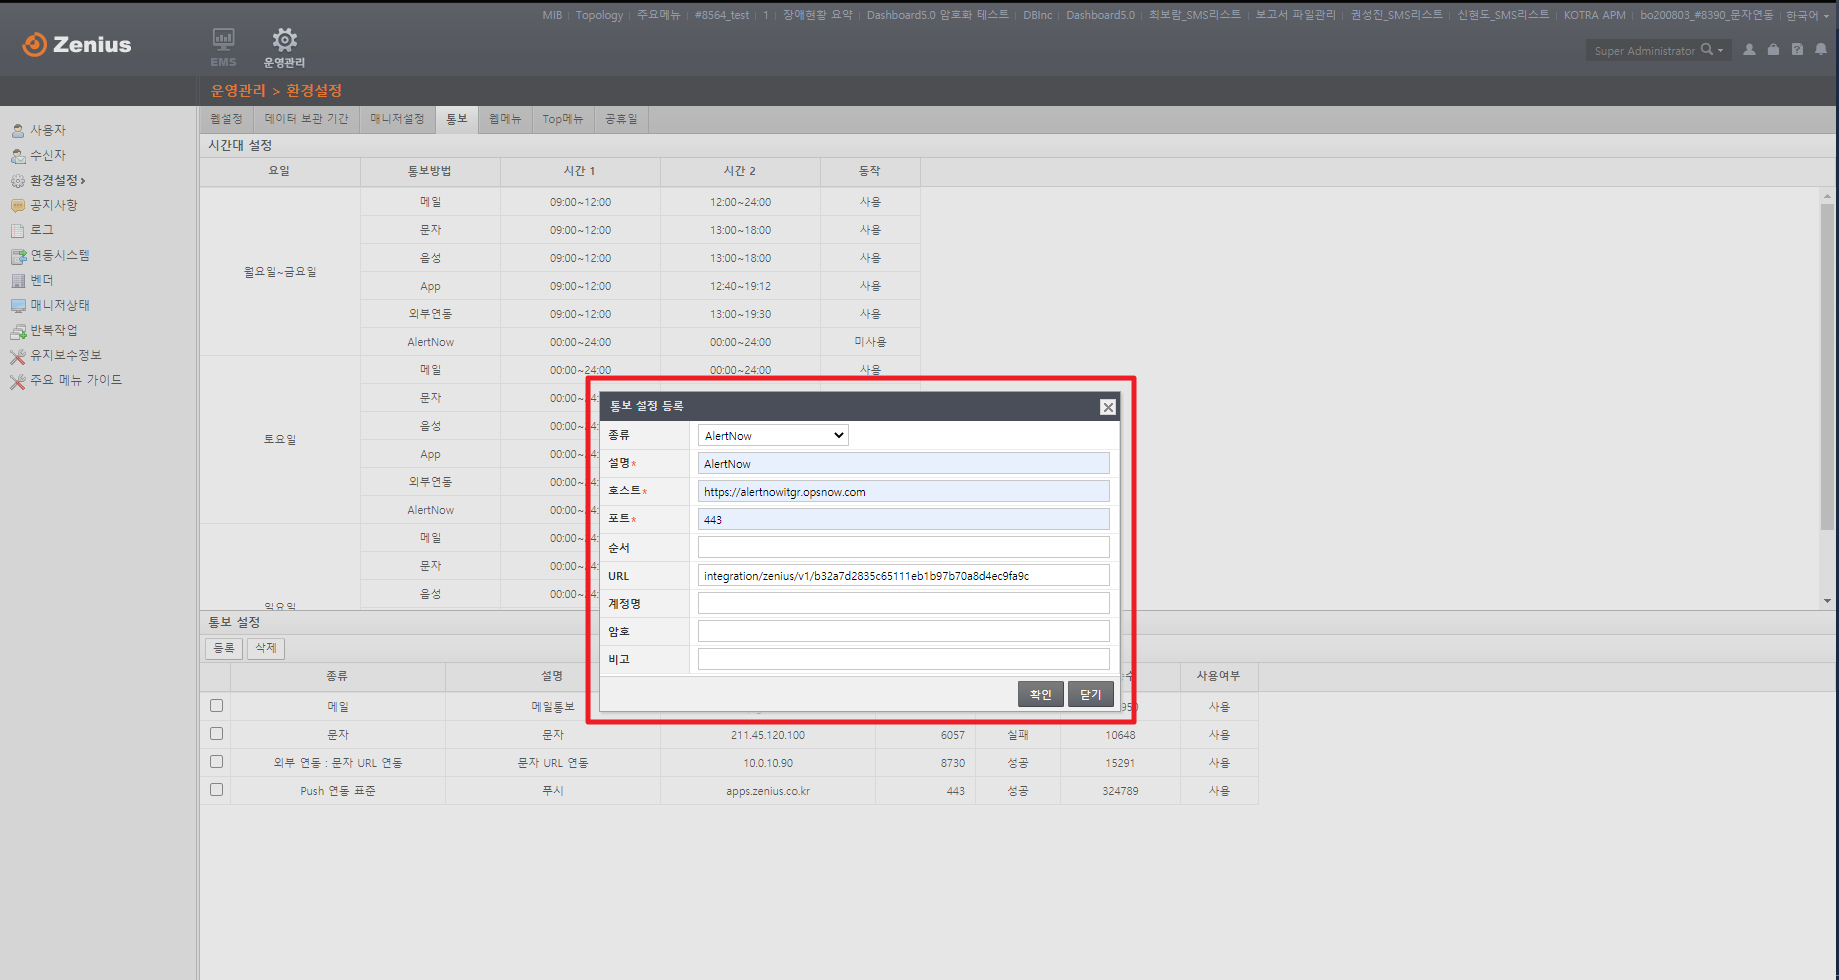
④ In the Set Time Zone, the settings popup window opens when you click a date.
• Notification Method: Select the checkbox of AlertNow to Activate Notification and unselect the checkbox to Deactivate Notification
• Time: Notify at times you set in Time 1 and Time 2
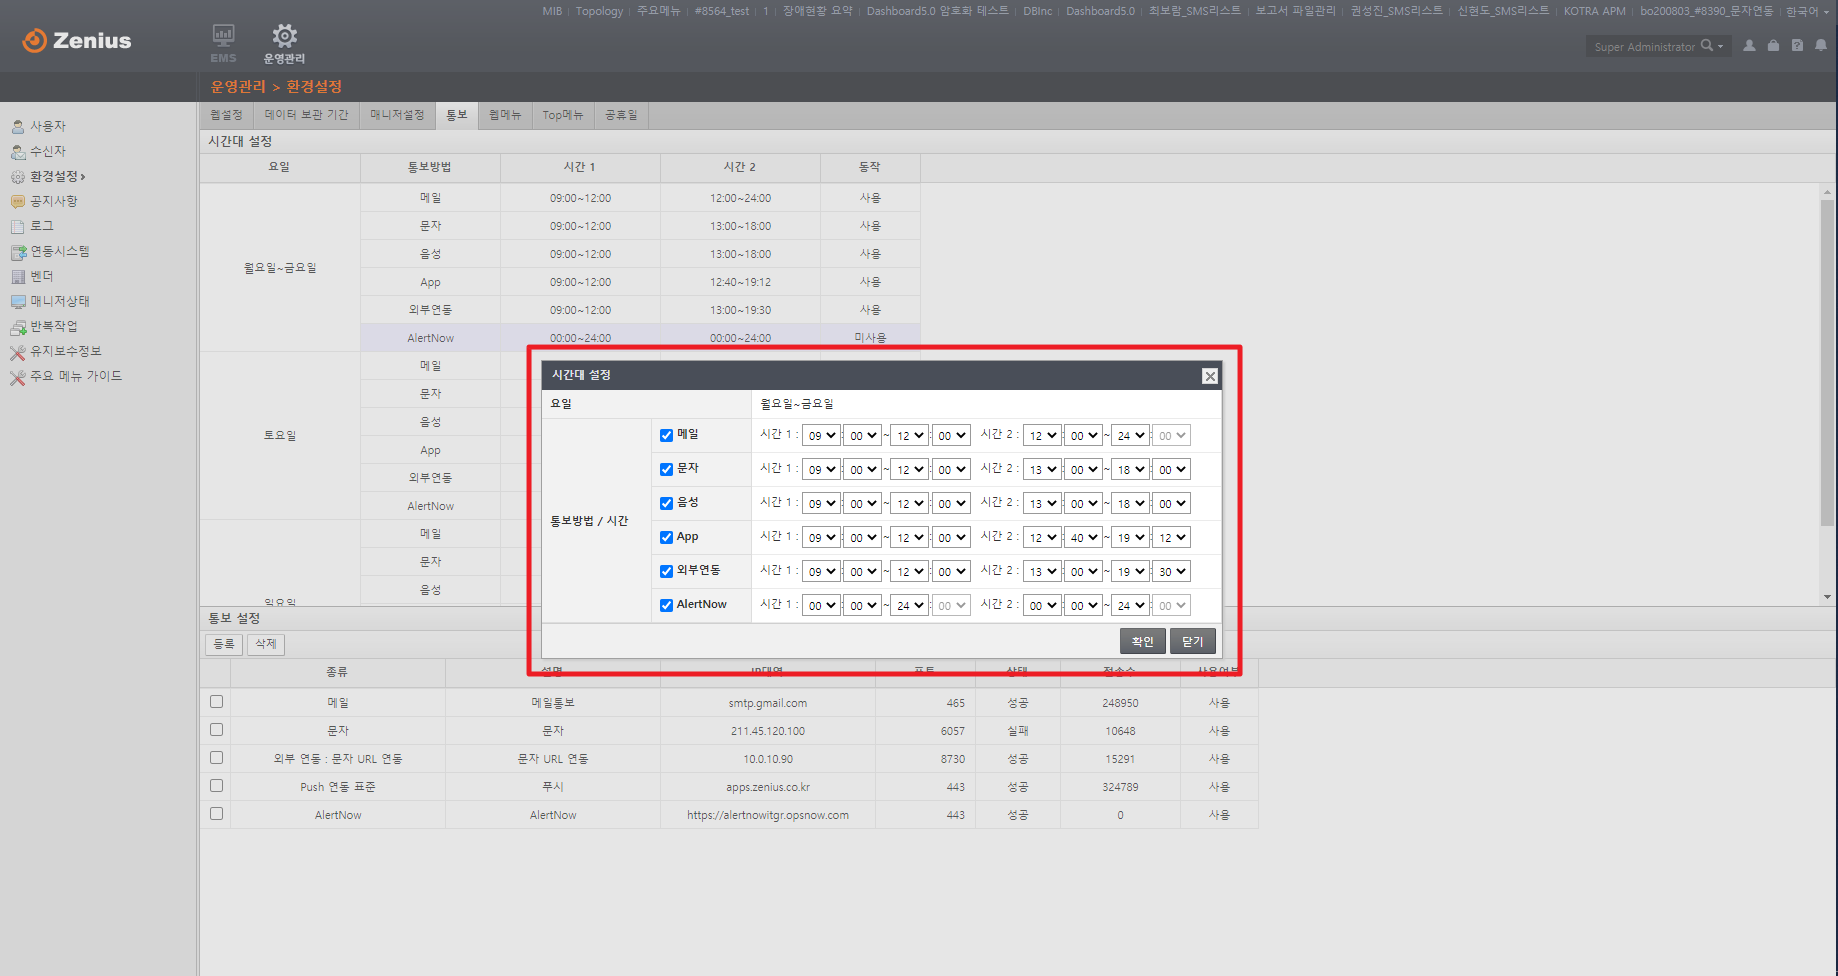
Surveillance Settings
① Sign in to Zenius with Admin account.
② Select SMS > Settings > Surveillance Settings from the Zenius dashboard. Click the [Register] and [Modify] to open Registering Surveillance Settings windows.
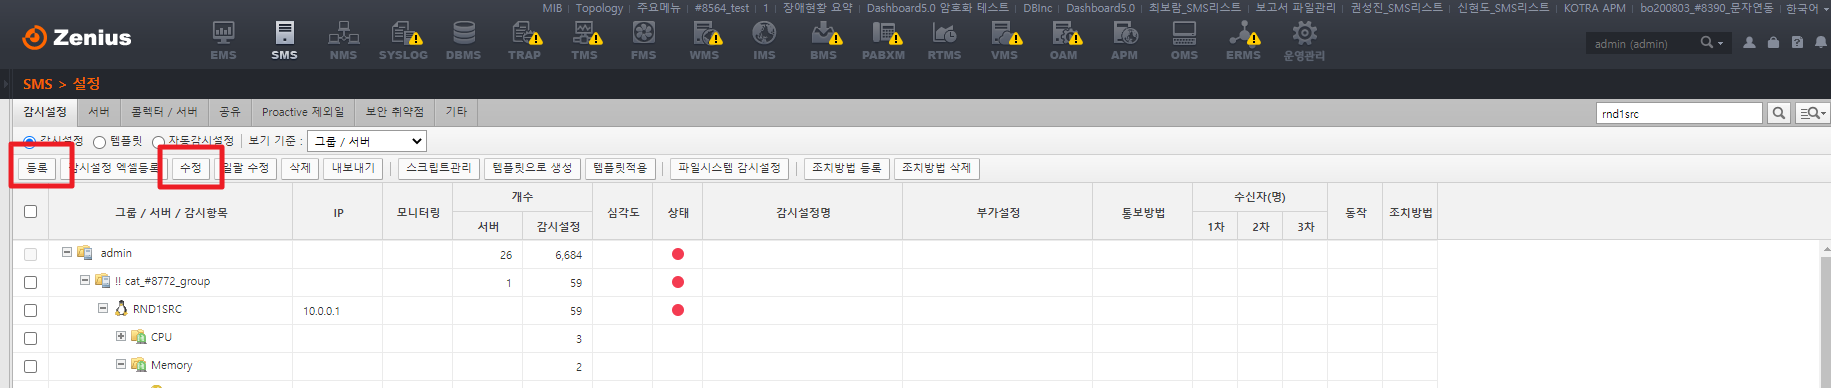
③ In Registering Surveillance Settings window, set events to surveil, server, time/date, and notification method. Select AlertNow for notification method, and choose Notify when returns to normal as a notification option.
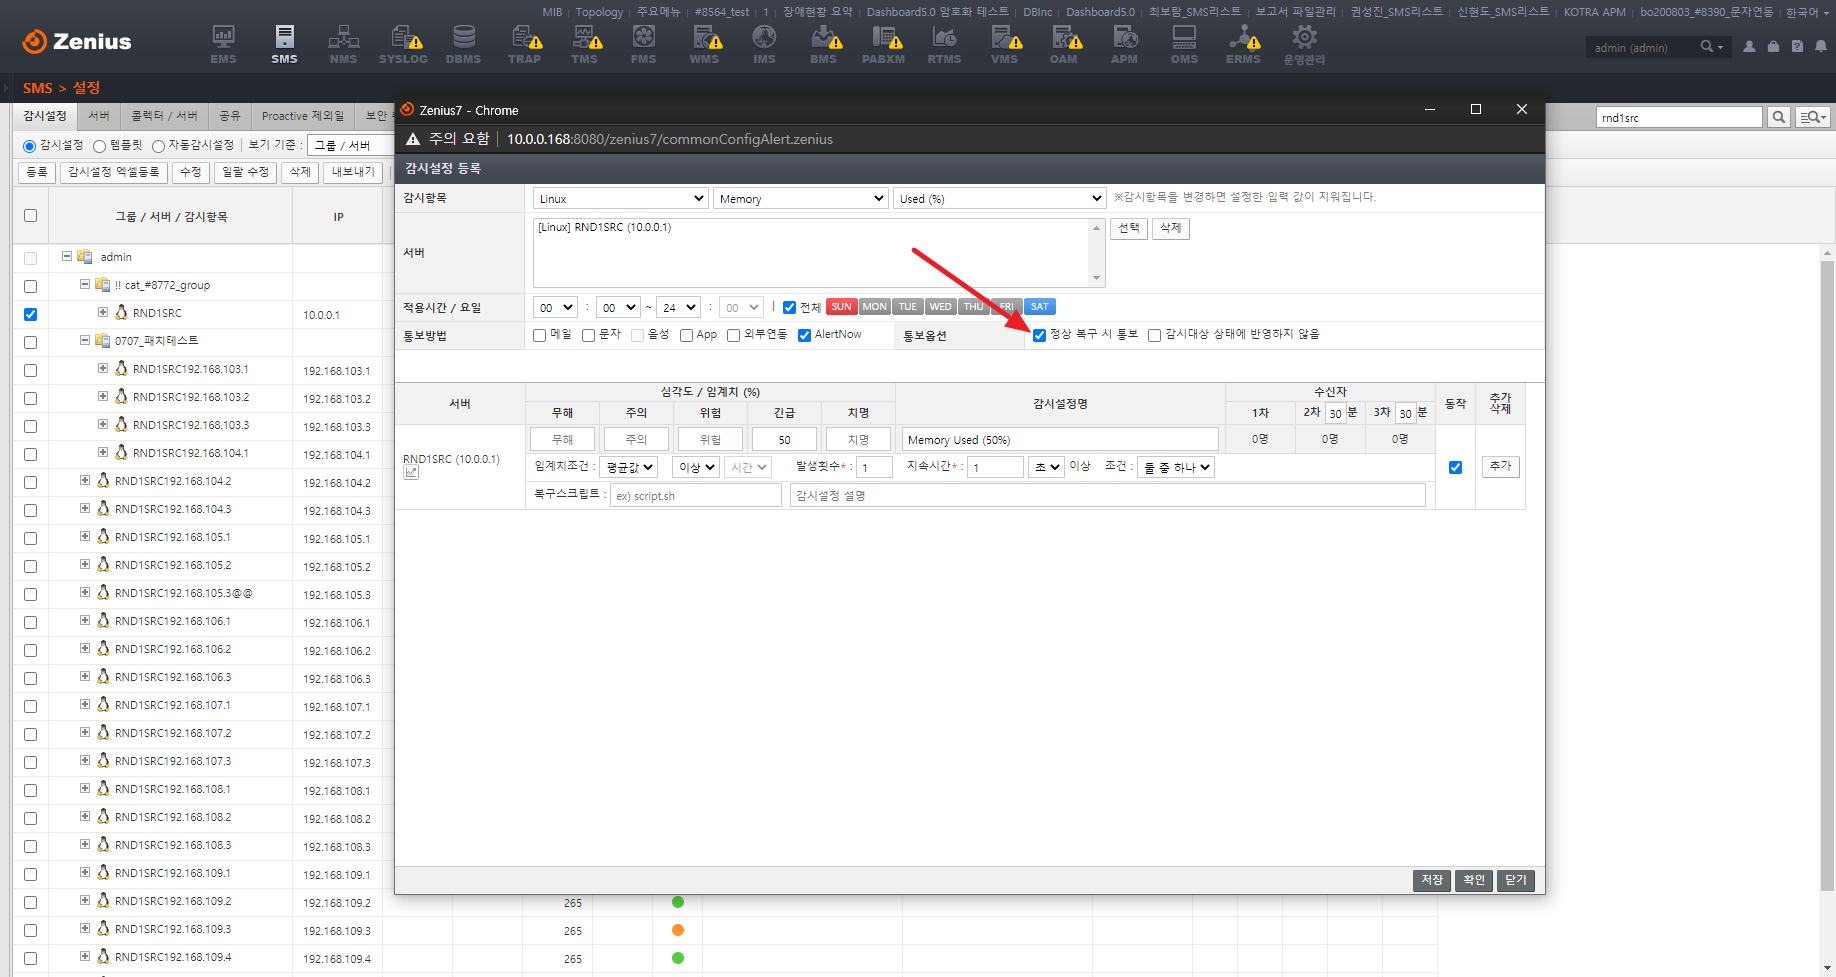
④ When AlertNow is displayed as the notification method, the settings is successfully configured.
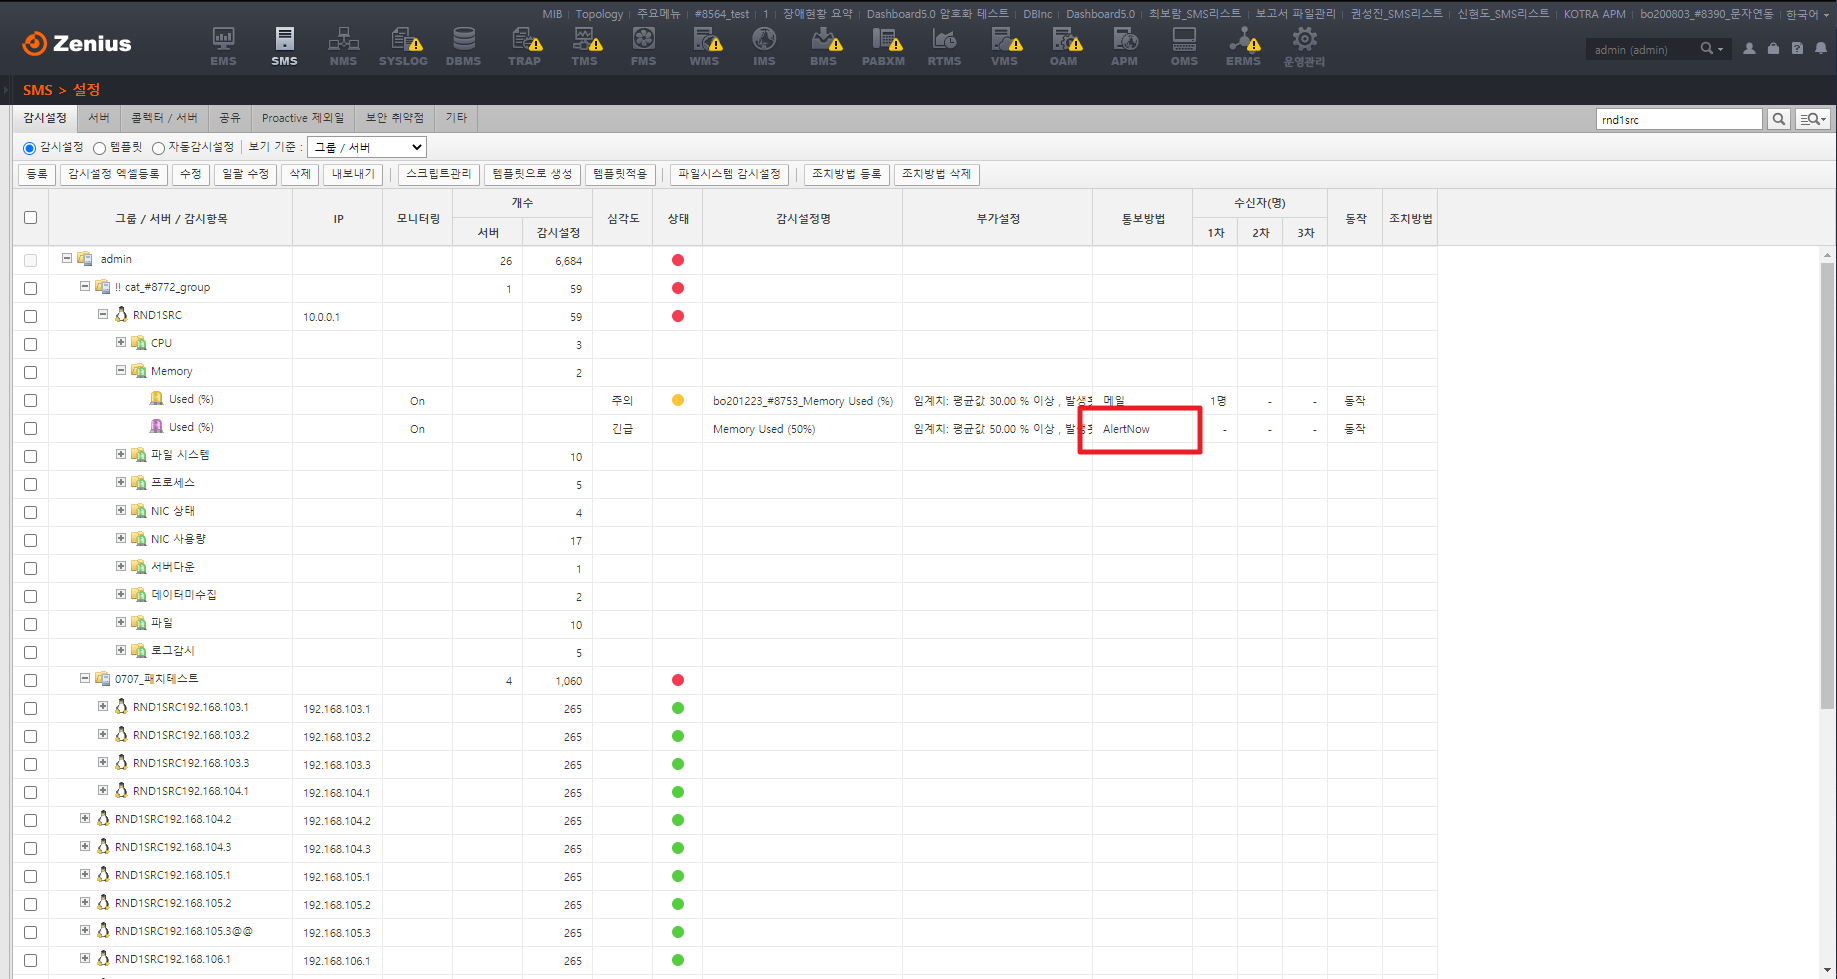
When you sign in with Admin account, you can check the history of notifications sent to AlertNow from Operations > Logs > AlertNow sent menu.
Zabbix
To integrate Zabbix with AlertNow, you need to configure Media types and Actions in the Zabbix console.
Click the [Create Integration] button located on the top-left side, and select the [Zabbix] card.
![]()
In the Create integration page, enter the required information and then click the [OK] button to create the integration.
![]()
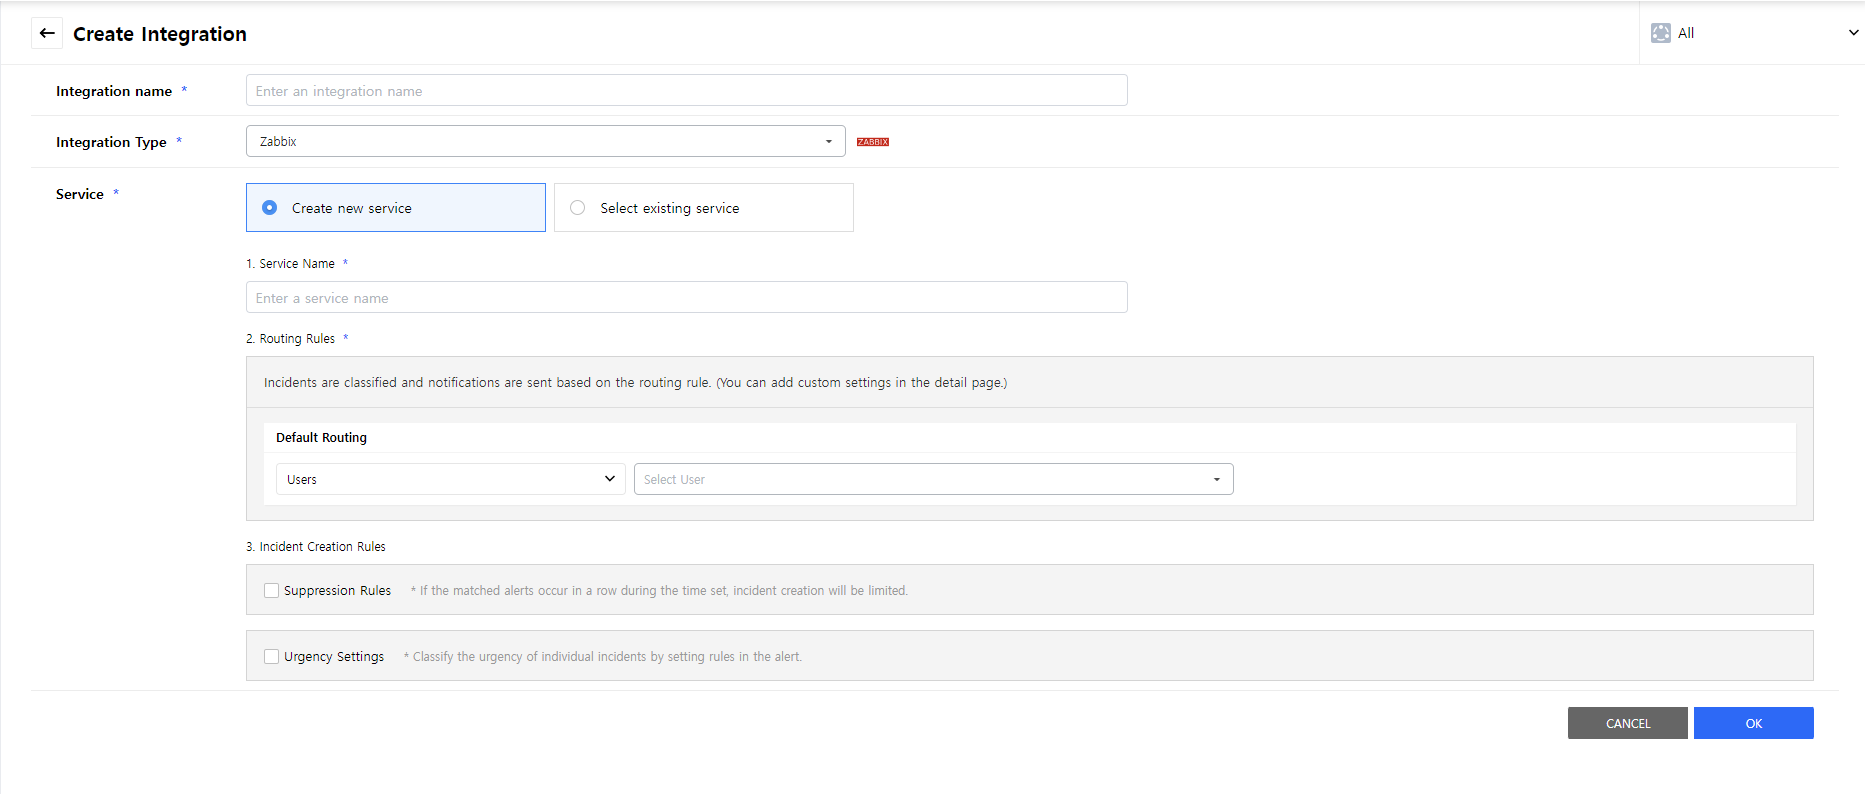
This guide explains how to send event notifications by using Custom Alertscripts and Webhook.
Using Custom Alertscript
You can use all Zabbix versions that support the Custom Alertscript feature. Details of this guide are based on Zabbix version 4.2.
⑴ Write Alert script (execute in root permission)
① Open ‘zabbix_server.conf’ file in the vi editor and check the AlertScriptsPath.
                    bash

                        vi /etc/zabbix/zabbix_server.conf
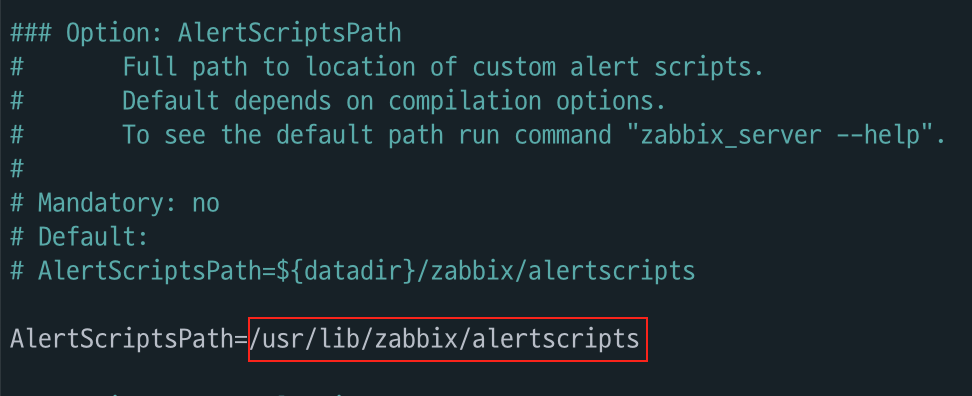
② Under /usr/lib/zabbix/alertscripts, write notify_to_alertnow.sh script and then save. The path may be different depending on your OS.
bash

                        cd /usr/lib/zabbix/alertscripts
                        vi notify_to_alertnow.sh
bash

                     #!/bin/bash

                     sendto=$1
                     subject=$2
                     message=$3
                     alertnow_url=$4

                     curl -X POST -H "Content-Type: application/json" -d "{\"subject\":\"$subject\", \"message\":$message}" $alertnow_url
③ Modify the owner of notify_to_alertnow.sh and its mode as following:
bash

                        chown zabbix.zabbix notify_to_alertnow.sh
                        chmod +x notify_to_alertnow.sh
⑵ Create Media Type
① To add Macros, go to Administration > General and select [Macros]. Click the [Add] button, and insert {$ZABBIX.URL} in Macro field and the Zabbix URL in the Value field and click the [Update] button.
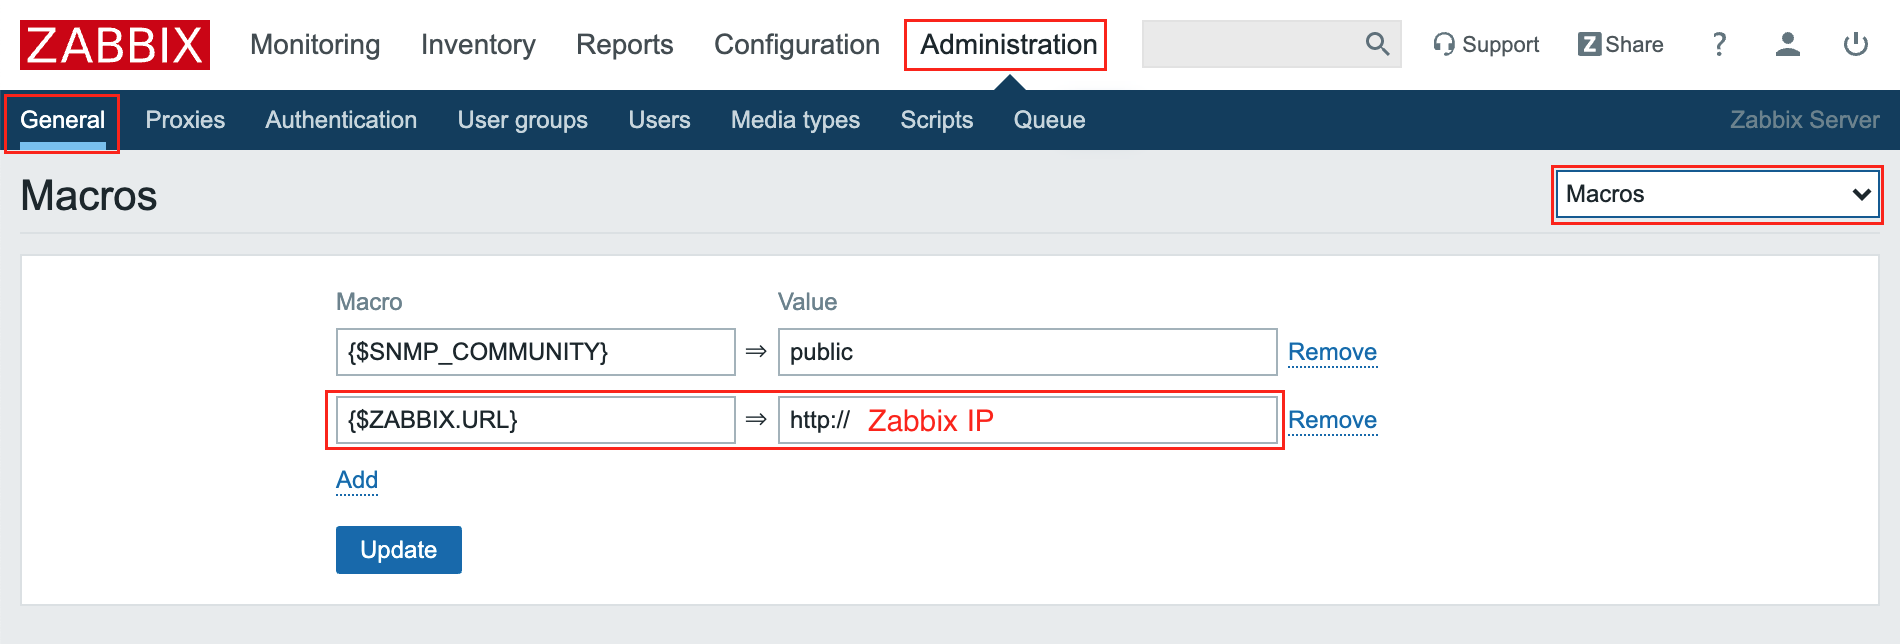
② To create Media type, go to Administration > Media types, click the [Create Media type] button on the upper-right corner.
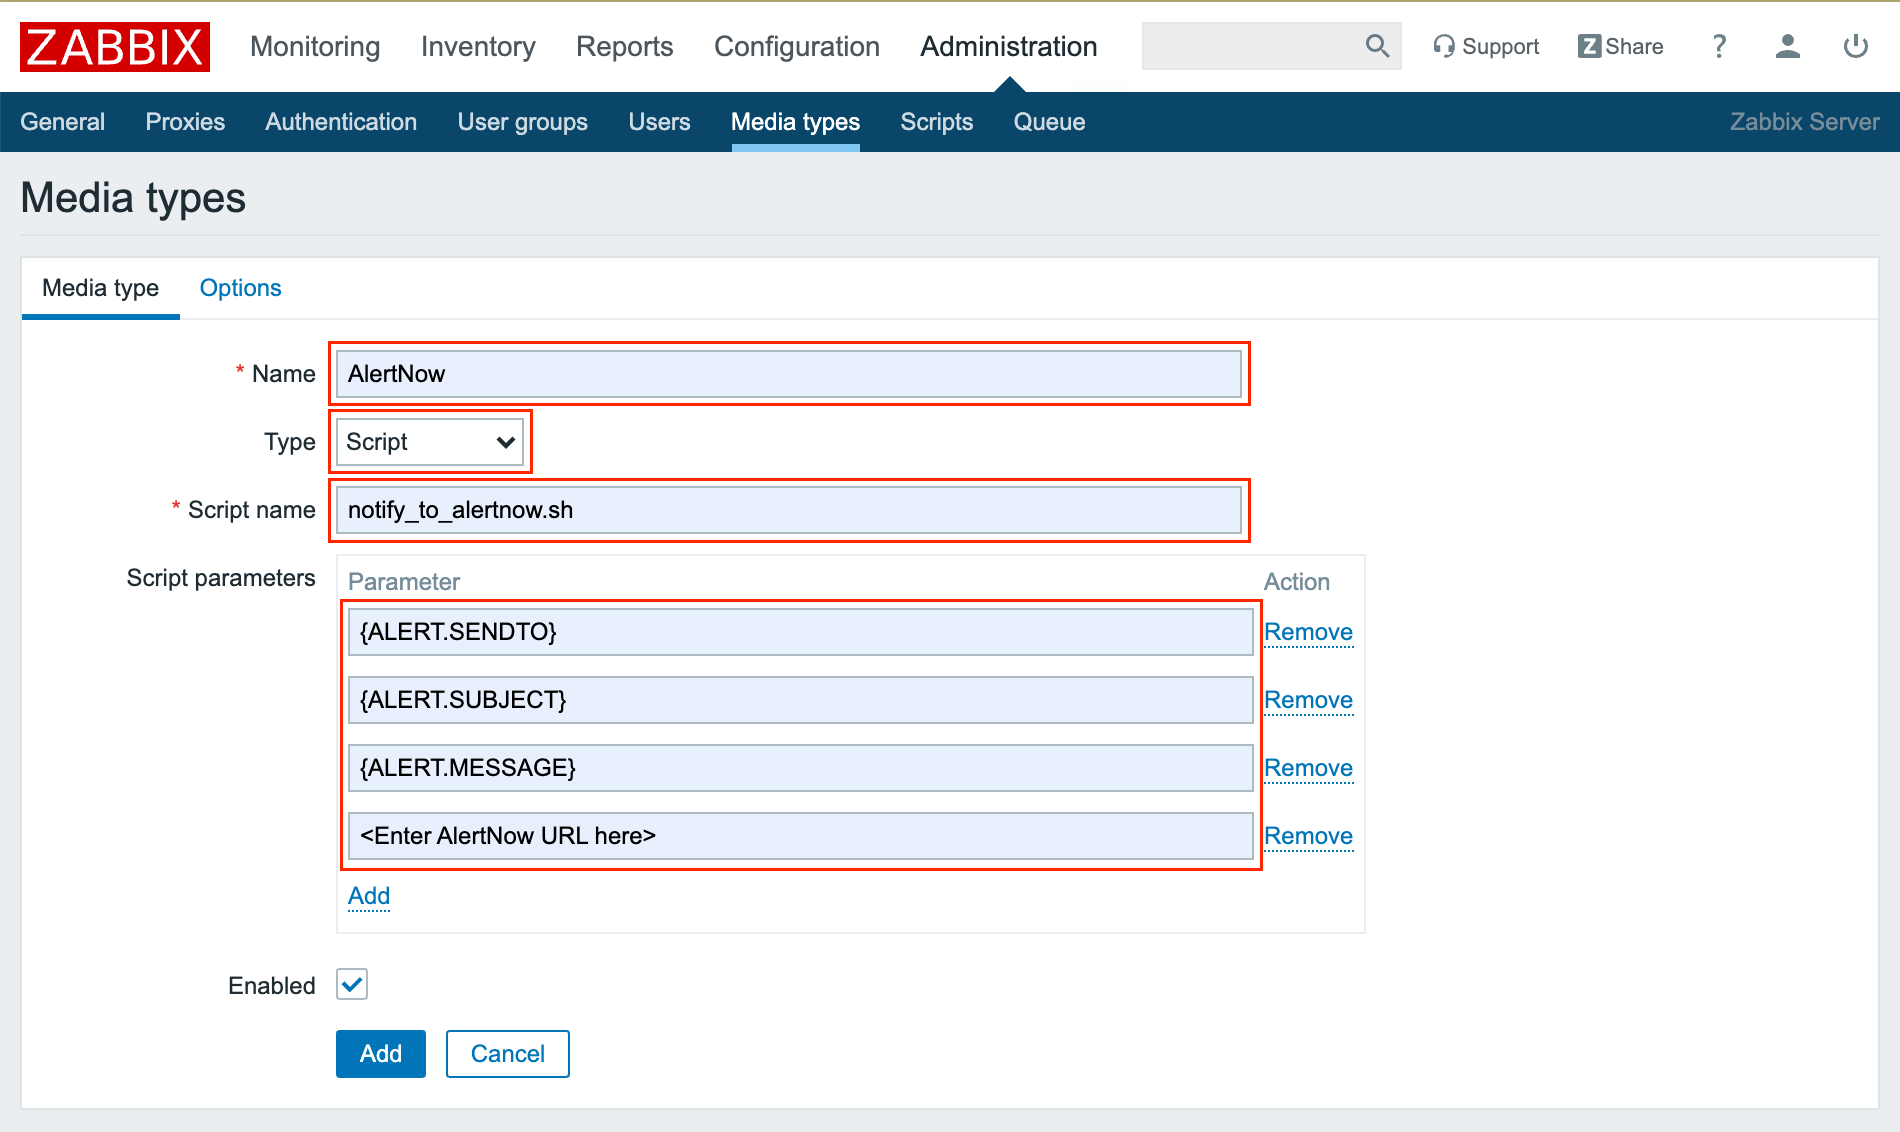
| Item | Description |
|---|---|
| Name | Enter AlertNow in the Name field. |
| Type | Select Script in the Type field. |
| Script name | Enter ‘notify_to_alertnow.sh’ in the Script name field. |
| Script parameters | Enter the following in order. {ALERT.SENDTO} {ALERT.SUBJECT} {ALERT.MESSAGE} (Enter the AlertNow URL here) - Enter the actual AlertNow URL here. |
③ Click the [Add] button to save, and click the [Test] button in the newly created AlertNow Media Type and fill in the following on the modal pop-up window.

④ Click the [Test] button to see if the notification is working properly.
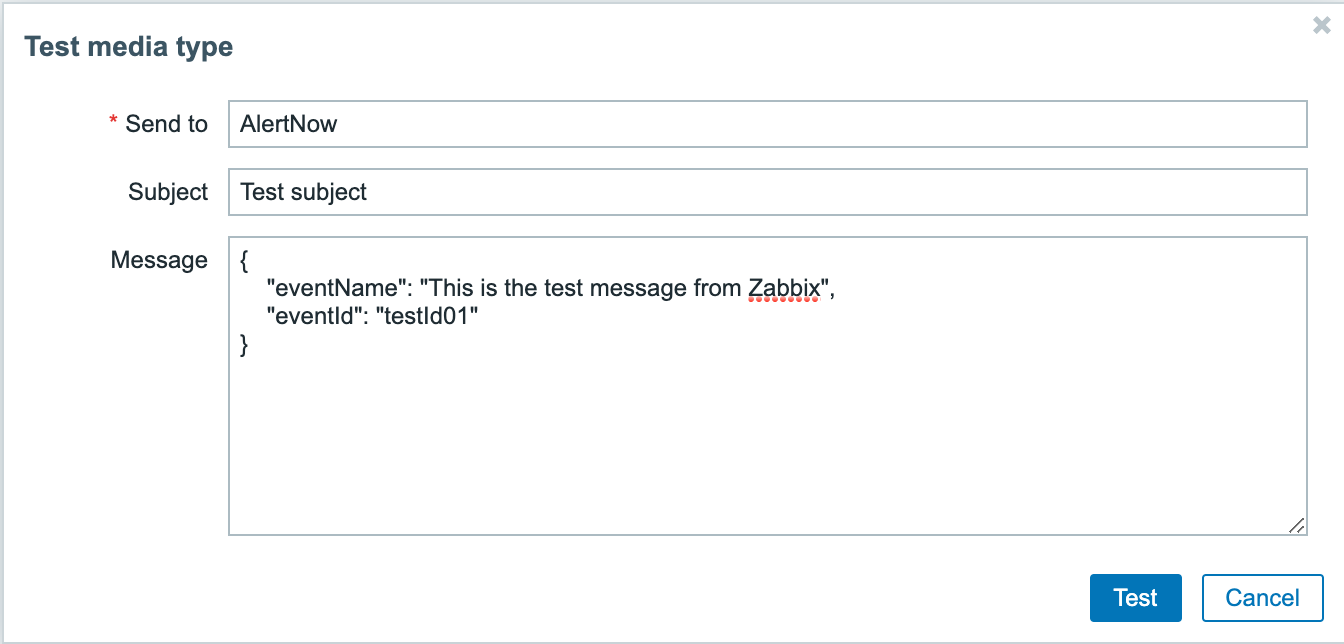
| Item | Description |
|---|---|
| Send to | Enter AlertNow in the Send to the field. |
| Subject | Enter Test subject in the Subject field. |
| Message | Enter { “eventName”: “This is the test message from Zabbix”, “eventId”: “testId01” } in the Message field, and enter different eventId values for each test. |
⑶ Create Users
① Under Administration > Users menu, click the [Create user] button on the upper-right corner. Enter the following in the User tab menu.
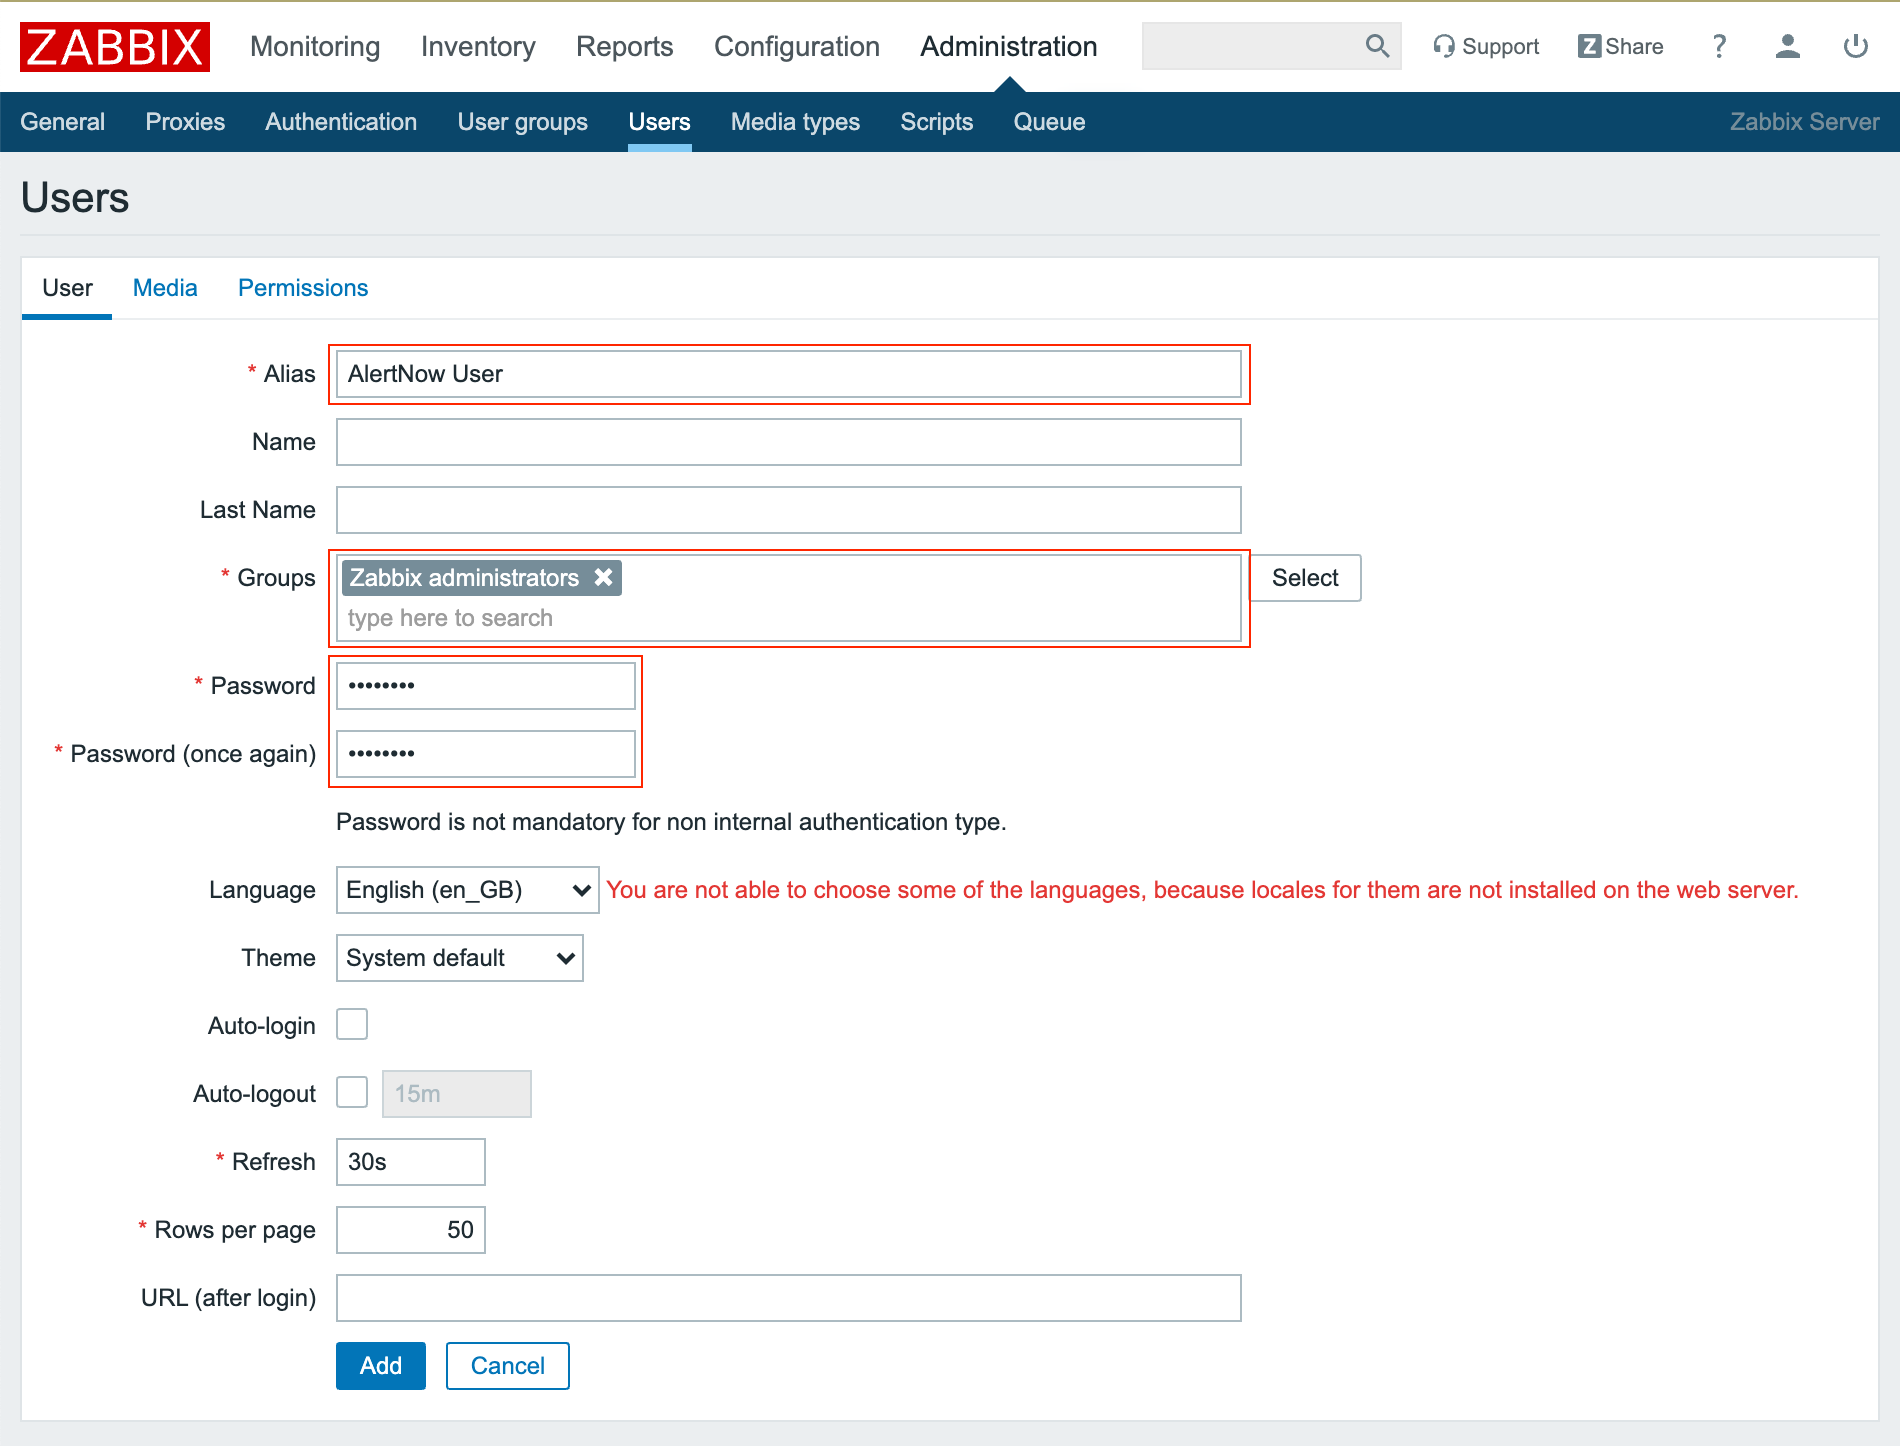
② Click Media tab and Click the [Add] button.
③ Enter each item on the popup window. When active sets the date and time period when you will be receiving notifications, and Use if severity lets you select severity levels of notifications that you want to be notified of.
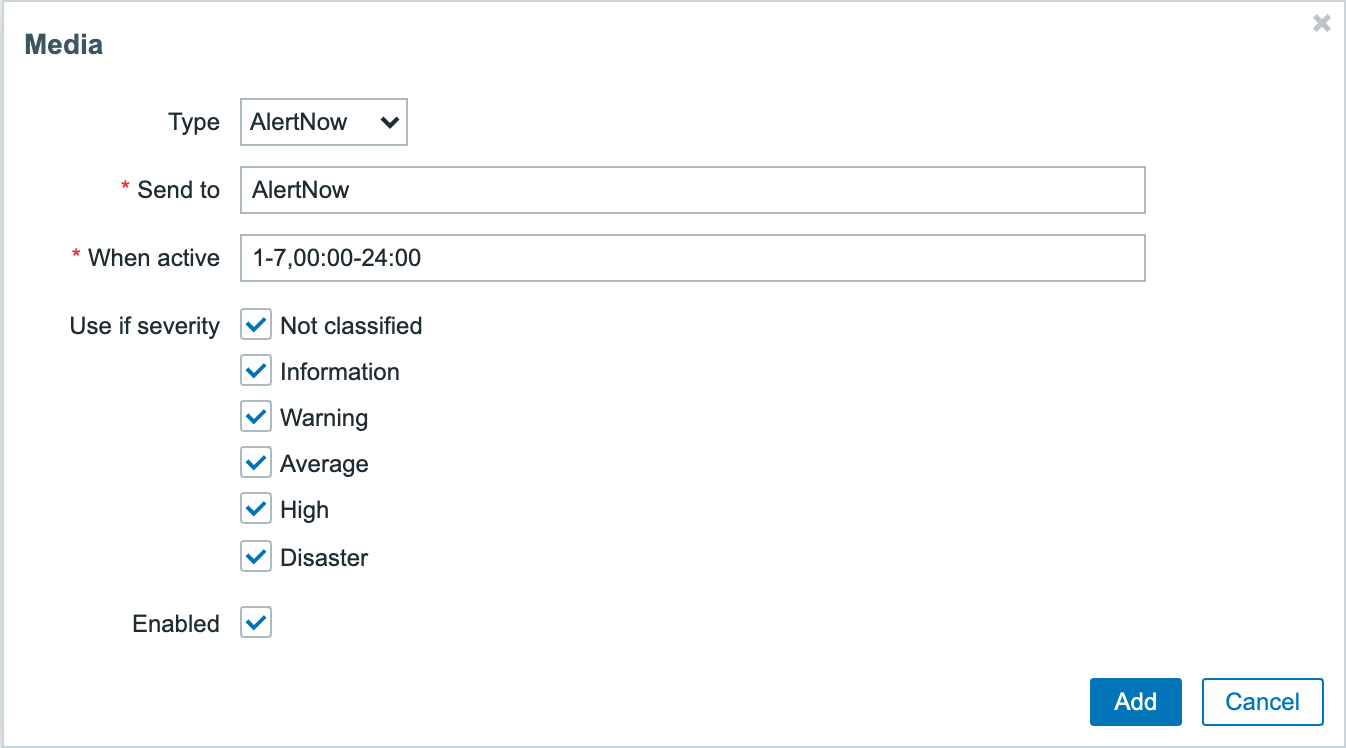
④ Click the Permission tab to see if you have Read permission or higher. To create a User, click the [Add] button to save.
⑤ If proper permissions are not granted, go to the added User groups and grant the permission of Read or higher for Host group’s permissions under the Permissions tab.
⑷ Create Actions
① Under Configuration > Actions menu, click the [Create action] button on your upper-right corner. Enter AlertNow Action in the Name field in the Action tab menu.
② Enter each item in the Operations tab, and click the [Add] button to save.
📑 Note: In the case of a default message, you must enter them according to the given JSON standard.
③ If there is a Macro that is not supported by Zabbix’s previous versions, use {EVENT.NAME} → {TRIGGER.NAME}, {EVENT.SEVERITY} → {TRIGGER.SEVERITY} instead.
- Default message
                     {
                     "eventDt": "Problem started at {EVENT.TIME} on {EVENT.DATE}",
                     "eventName": "{EVENT.NAME}",
                     "host": "{HOST.NAME}",
                     "severity": "{EVENT.SEVERITY}",
                     "eventId": "{EVENT.ID}",
                     "eventStatus": "open",
                     "triggerUrl": "{$ZABBIX.URL}/tr_events.php?triggerid={TRIGGER.ID}&eventid={EVENT.ID}"
                     }
④ Enter each item in the Recovery operations tab, and click the [Add] button to add Operation details.
📑 Note: In the case of a default message, you must enter them according to the given JSON standard.
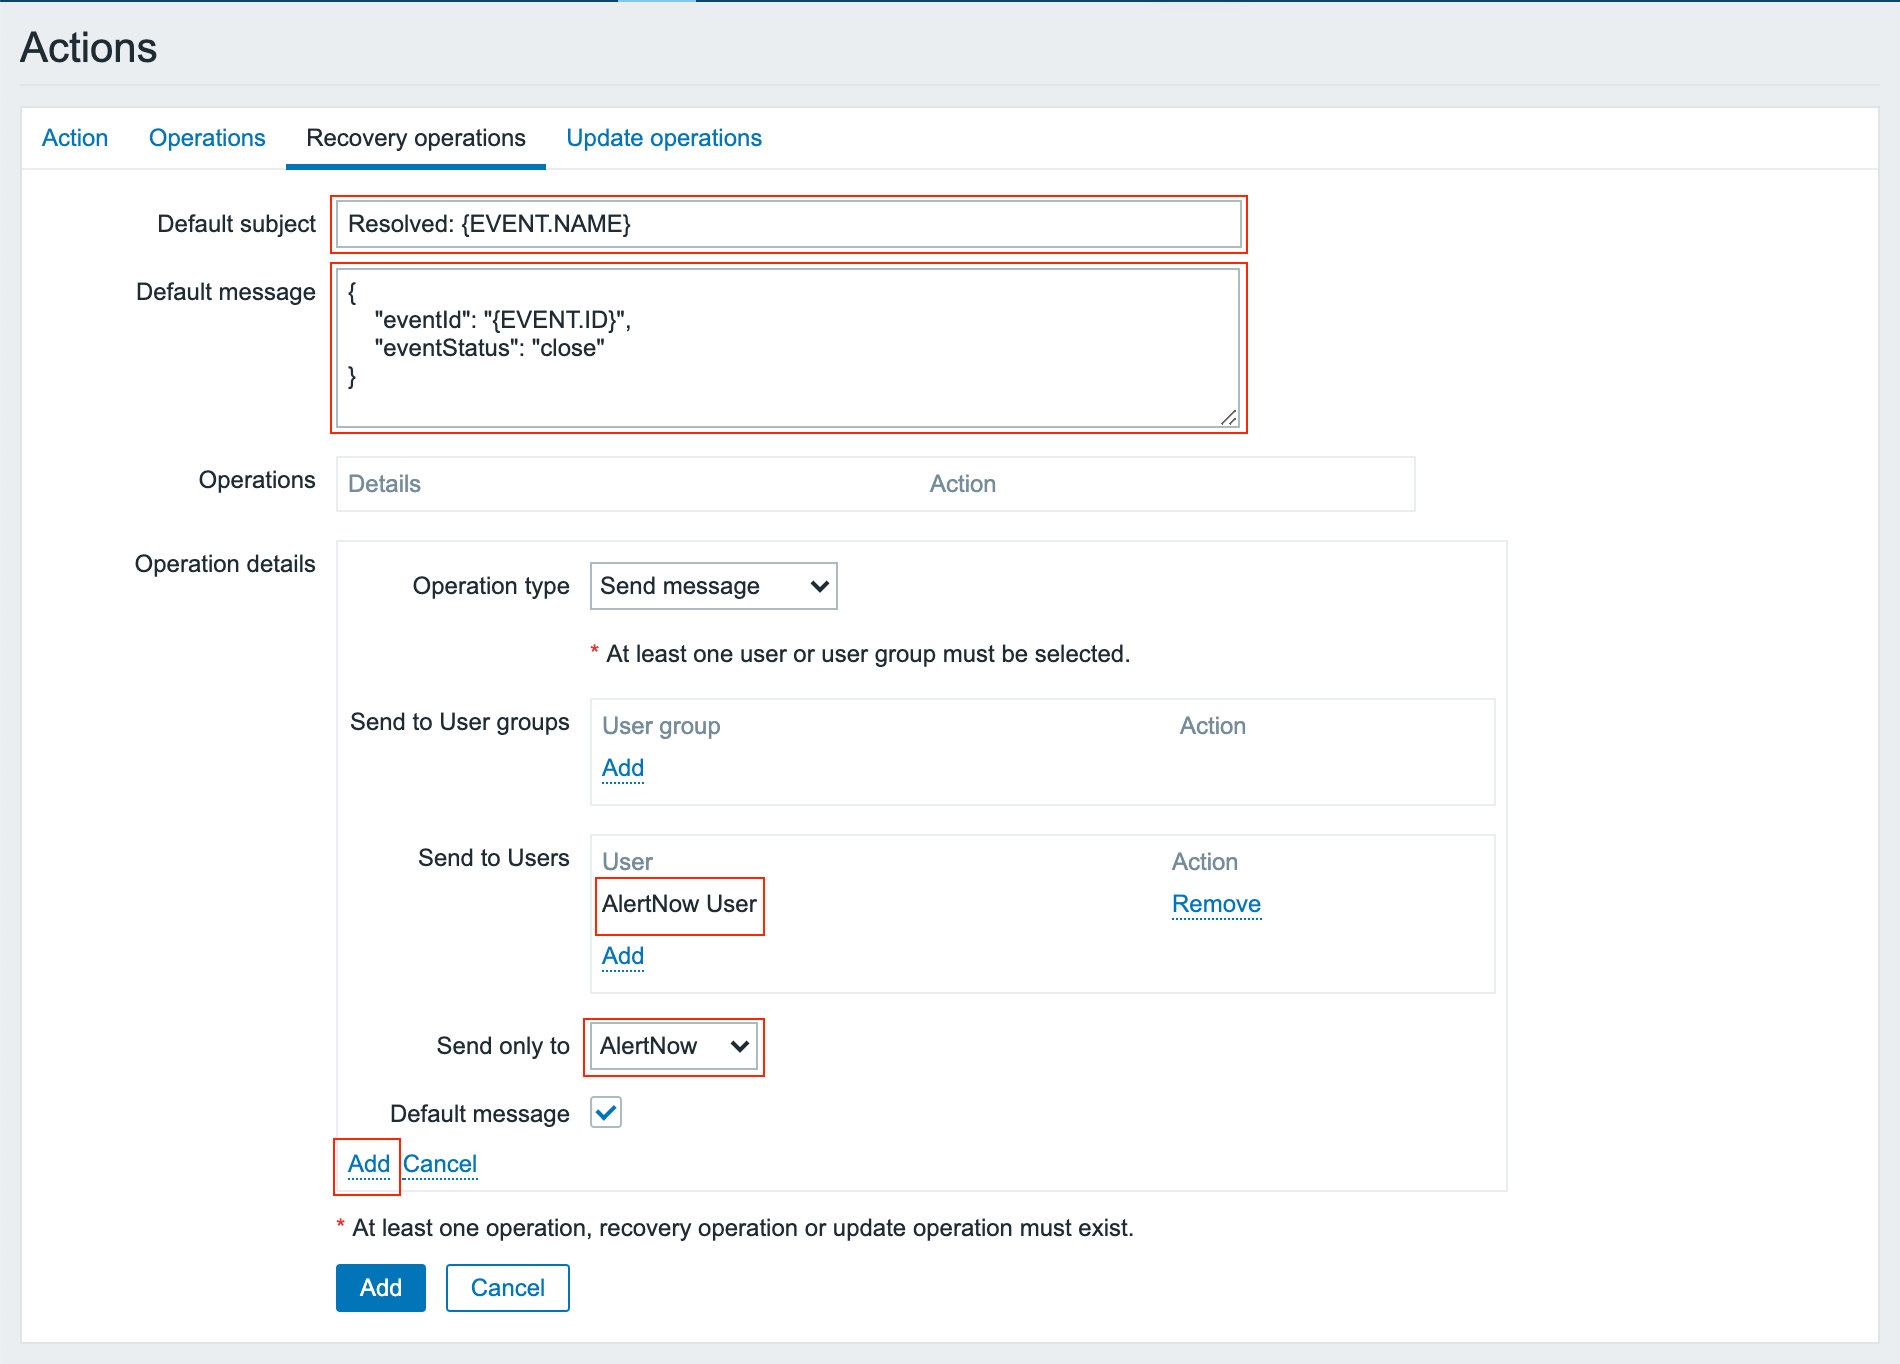
- Default message
⑤ To create Actions, click the [Add] button to save.
⑸ Check Incident Creation in AlertNow
Modify Trigger configuration in Zabbix and directly create a test event and see if incidents were properly created in AlertNow by checking SMS, email, Voice Call, or Slack notifications.
Using Webhook
You can use all Zabbix versions 4.4 or higher that support the Webhook feature. Details of this guide are based on the Zabbix 5.0 LTS version.
⑴ Create Media type
① To create Macros, go to Administration > General menu, and select Macros from the upper-left select box. Click the [Add] button and insert {$ZABBIX.URL} in the Macro field and the Zabbix URL in the Value field and click the [Update] button.
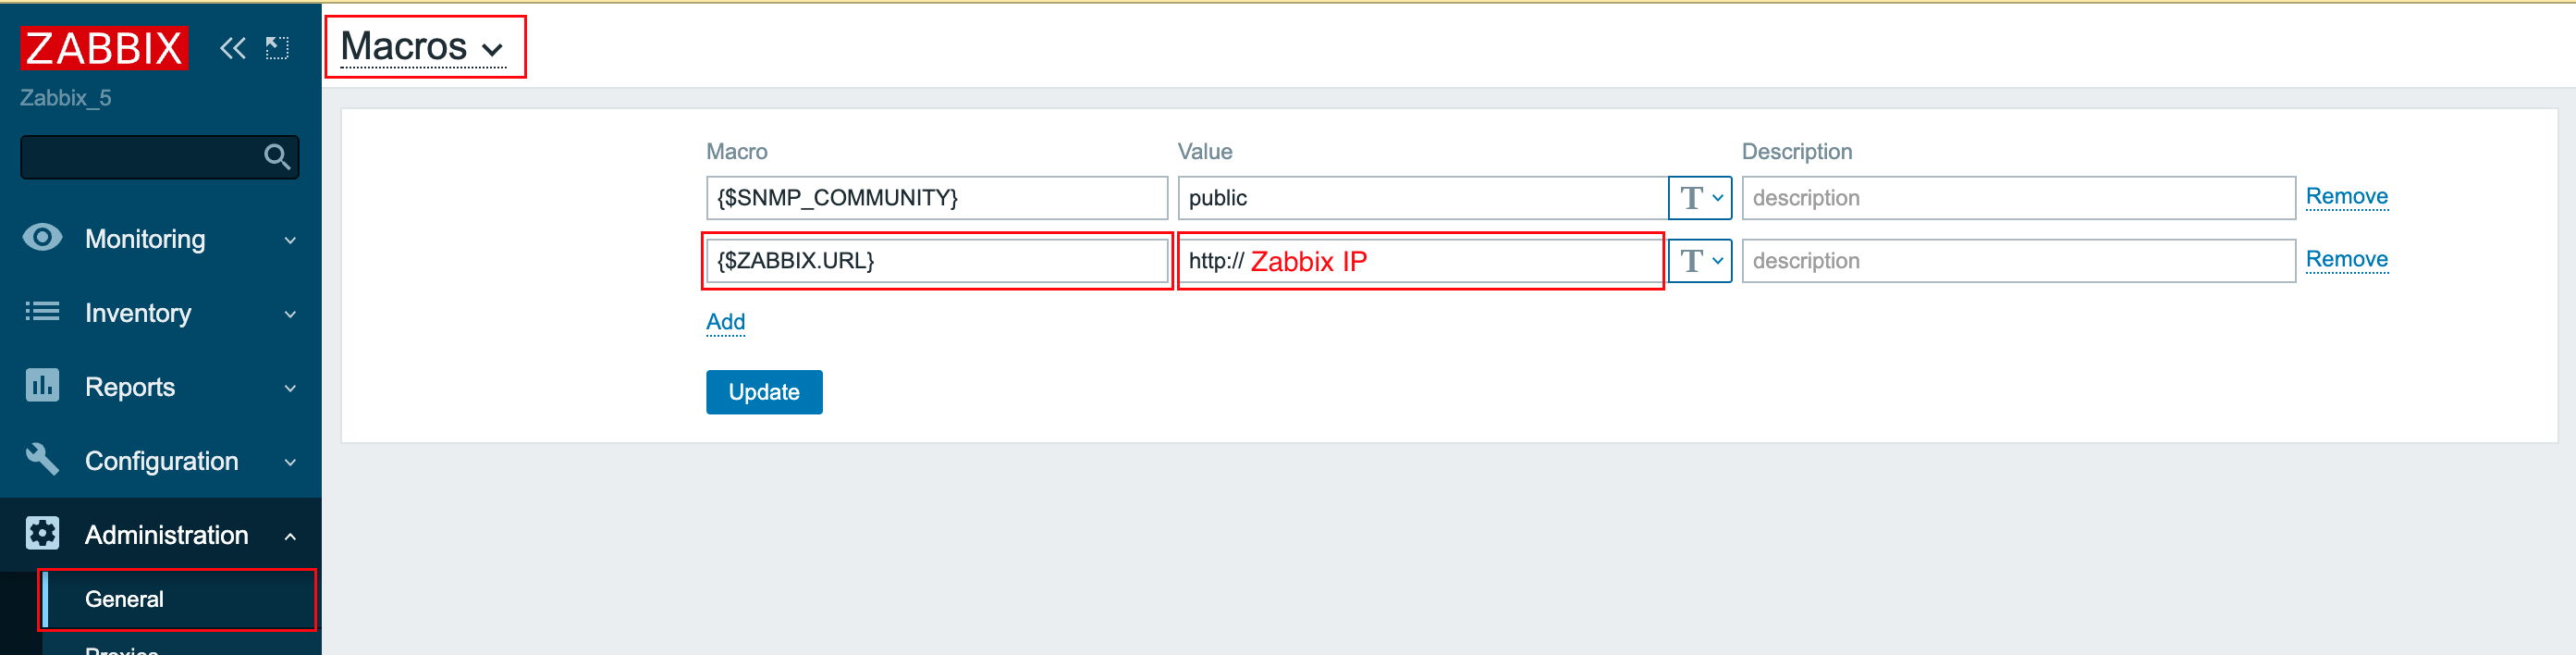
② To select Media type, go to Administration > Media types menu, and click the [Create media type] button on the upper-right corner.
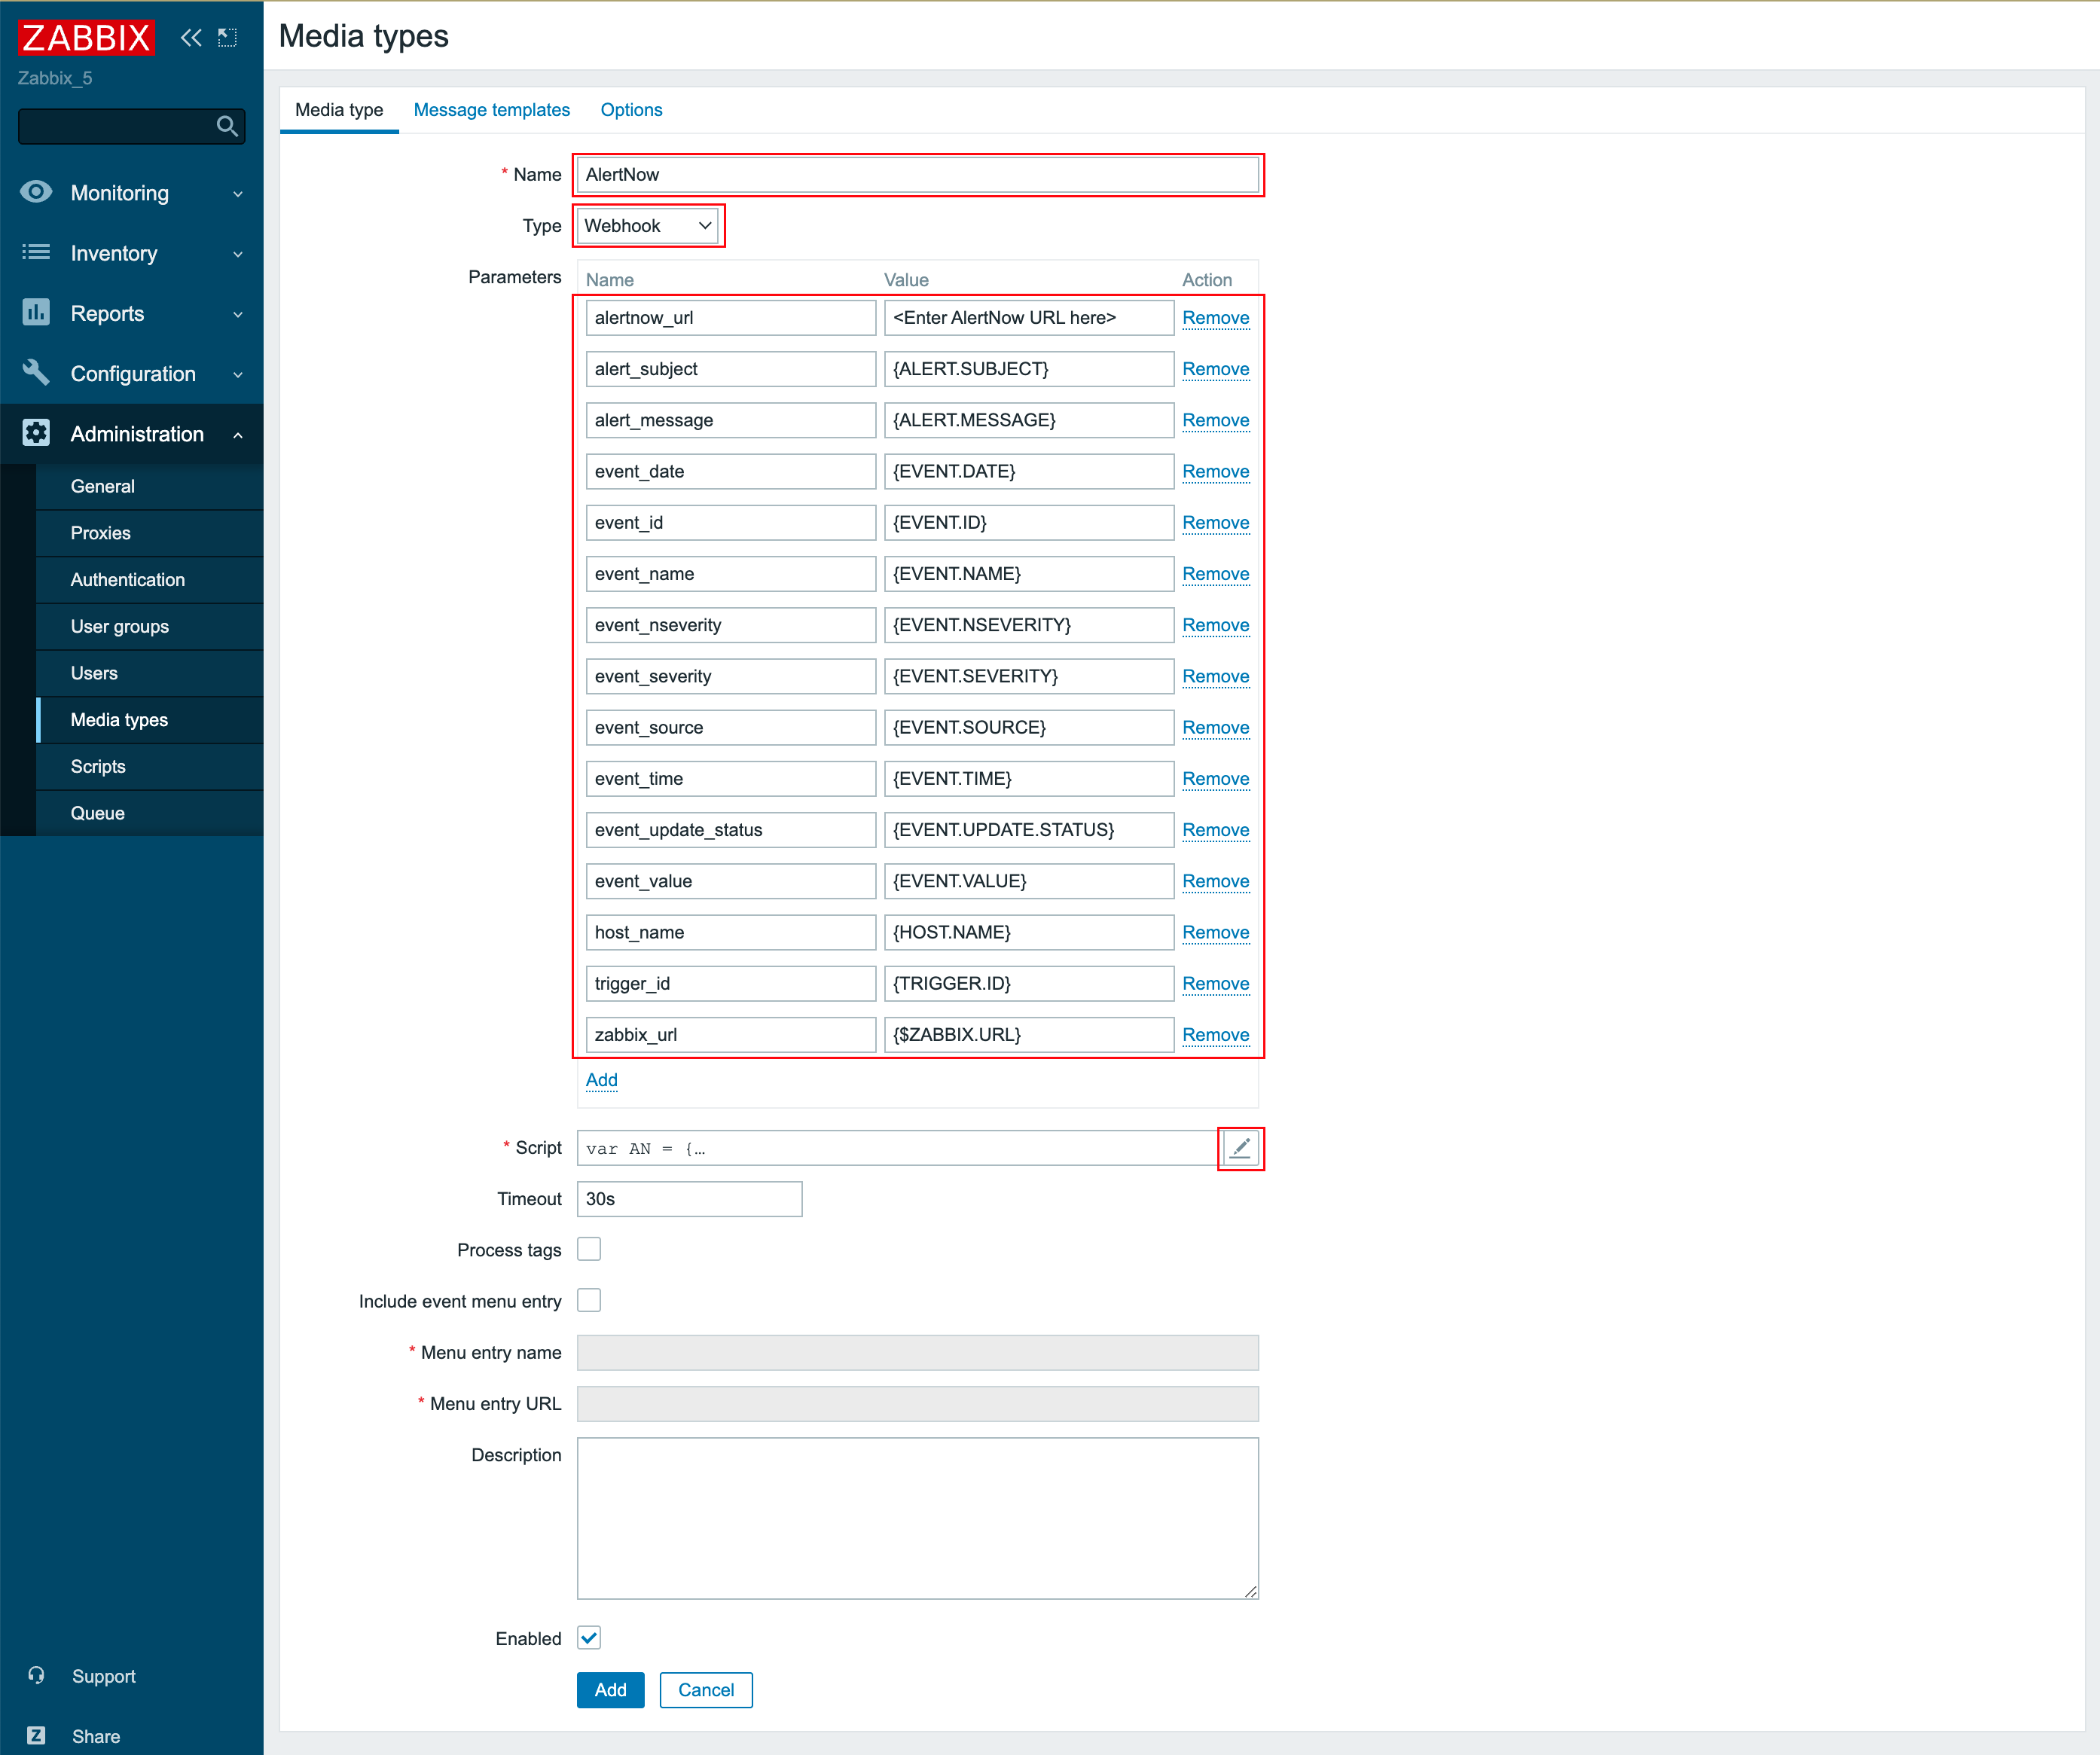
③ Enter AlertNow in the Name field, and select Webhook in Type. Then, enter Name and Value in the parameter fields.
| Name | Value |
|---|---|
| alertnow_url | Enter the actual AlertNow URL here |
| alert_message | {ALERT.MESSAGE} |
| alert_subject | {ALERT.SUBJECT} |
| event_date | {EVENT.DATE} |
| event_id | {EVENT.ID} |
| event_name | {EVENT.NAME} |
| event_nseverity | {EVENT.NSEVERITY} |
| event_severity | {EVENT.SEVERITY} |
| event_source | {EVENT.SOURCE} |
| event_time | {EVENT.TIME} |
| event_update_status | {EVENT.UPDATE.STATUS} |
| event_value | {EVENT.VALUE} |
| host_name | {HOST.NAME} |
| trigger_id | {TRIGGER.ID} |
| zabbix_url | {$ZABBIX.URL} |
④ Click the pencil icon to modify Script, and enter javascript as below and then save.
AlertNow Javascript
                     var AN = {
                      payload: {},

                      validateParams: function (params) {
                        if (isNaN(params.event_id) || params.event_id < 1) {
                          throw 'Field "event_id" is not a positive number';
                        }

                        if (params.alert_subject.length < 1) {
                          throw 'incorrect value for variable "alert_subject". The value must be a non-empty string.';
                        }

                        if ([0, 1, 2, 3].indexOf(parseInt(params.event_source)) === -1) {
                          // 0 - Trigger, 1 - Discovery, 2 - Autoregistration, 3 - Internal
                          throw 'Incorrect "event_source" parameter given: "' + params.event_source + '".\nMust be 0-3.';
                        }

                        if (params.event_source !== '0') {
                          params.event_nseverity = '0';
                          params.event_severity = 'Not classified';
                          params.event_update_status = '0';
                        }

                        if (params.event_source === '1' || params.event_source === '2') {
                          params.event_value = '1';
                        }

                        if ([0, 1, 2, 3, 4, 5].indexOf(parseInt(params.event_nseverity)) === -1) {
                          // 0 - Not classified, 1 - Information, 2 - Warning, 3 - Average, 4 - High, 5 - Disaster
                          throw 'Incorrect "event_nseverity" parameter given: ' + params.event_nseverity + '\nMust be 0-5.';
                        }

                        if (typeof params.event_severity !== 'string' || params.event_severity.trim() === '') {
                          throw 'Field "event_severity" cannot be empty';
                        }

                        if (params.event_update_status !== '0' && params.event_update_status !== '1') {
                          // 0 - Webhook was called because of problem/recovery event, 1 - Update operation
                          throw 'Incorrect "event_update_status" parameter given: ' + params.event_update_status + '\nMust be 0 or 1.';
                        }

                        if (params.event_value !== '0' && params.event_value !== '1') {
                          // 1 for problem, 0 for recovering
                          throw 'Incorrect "event_value" parameter given: ' + params.event_value + '\nMust be 0 or 1.';
                        }

                        if (typeof params.host_name !== 'string' || params.host_name.trim() === '') {
                          throw 'Field "host_name" cannot be empty';
                        }

                        if (isNaN(params.trigger_id) && params.event_source === '0') {
                          throw 'field "trigger_id" is not a number';
                        }

                        if (typeof params.zabbix_url !== 'string' || params.zabbix_url.trim() === '') {
                          throw 'Field "zabbix_url" cannot be empty';
                        }

                        if (!/^(http|https):\/\/.+/.test(params.zabbix_url)) {
                          throw 'Field "zabbix_url" must contain a schema';
                        }
                      },
                      buildPayload: function (params) {
                        AN.payload.subject = params.alert_subject;

                        var dtPrefix = '';
                        switch (params.event_source) {
                          case '0':
                            if (params.event_update_status === '0') {
                              if (params.event_value === '1') {
                                dtPrefix = 'Problem started at ';
                                AN.payload.message = {
                                  'eventDt': dtPrefix + params.event_time + ' on ' + params.event_date,
                                  'eventName': params.event_name,
                                  'host': params.host_name,
                                  'severity': params.event_severity,
                                  'nseverity': params.event_nseverity,
                                  'eventId': params.event_id,
                                  'eventStatus': 'open',
                                  'triggerUrl': params.zabbix_url + '/tr_events.php?triggerid=' + params.trigger_id + '&eventid=' + params.event_id
                                };
                              } else {
                                AN.payload.message = {
                                  'eventId': params.event_id,
                                  'eventStatus': 'close'
                                };
                              }
                            }
                            break;
                          case '1':
                            dtPrefix = 'Discovery: at ';
                            AN.payload.message = {
                              'eventDt': dtPrefix + params.event_time + ' on ' + params.event_date,
                              'eventId': String(new Date().getTime()),
                              'eventStatus': 'open'
                            };
                            AN.payload.detail = params.alert_message;
                            break;
                          case '2':
                            dtPrefix = 'Autoregistration: at ';
                            AN.payload.message = {
                              'eventDt': dtPrefix + params.event_time + ' on ' + params.event_date,
                              'eventId': String(new Date().getTime()),
                              'eventStatus': 'open'
                            };
                            AN.payload.detail = params.alert_message;
                            break;
                          case '3':
                            dtPrefix = 'Internal problem started at ';
                            AN.payload.message = {
                              'eventDt': dtPrefix + params.event_time + ' on ' + params.event_date,
                              'eventId': String(new Date().getTime()),
                              'eventStatus': 'open'
                            };
                            AN.payload.detail = params.alert_message;
                            break;
                        }
                      },
                      request: function (url) {
                        var req = new CurlHttpRequest();
                        req.AddHeader('Content-Type: application/json');

                        if (typeof AN.payload.HTTPProxy === 'string' && AN.payload.HTTPProxy.trim() !== '') {
                          req.SetProxy(AN.payload.HTTPProxy);
                        }

                        req.Post(url, JSON.stringify(AN.payload));

                        return req.Status();
                      }
                     }

                     try {
                      Zabbix.Log(4, 'AlertNow notification value : ' + value);
                      var params = JSON.parse(value);

                      if (params.event_source === '0' && params.event_update_status === '1') {
                        throw 'Update operation is not called through webhook.';
                      }

                      AN.validateParams(params);

                      var result = {tags: {}},
                        resp = {};

                      AN.buildPayload(params);

                      resp = AN.request(params.alertnow_url);

                      if (resp !== 200) {
                        throw 'Response code: ' + resp;
                      }

                      result.tags.endpoint = 'AlertNow';
                    } catch (error) {
                      Zabbix.Log(3, '[ AlertNow Webhook ] AlertNow notification failed payload : ' + JSON.stringify(AN.payload));
                      Zabbix.Log(3, 'AlertNow notification failed : ' + error);

                      result = {};
                     }

                     return JSON.stringify(result);
⑤ Go to the Message templates tab, and click the [Add] button.
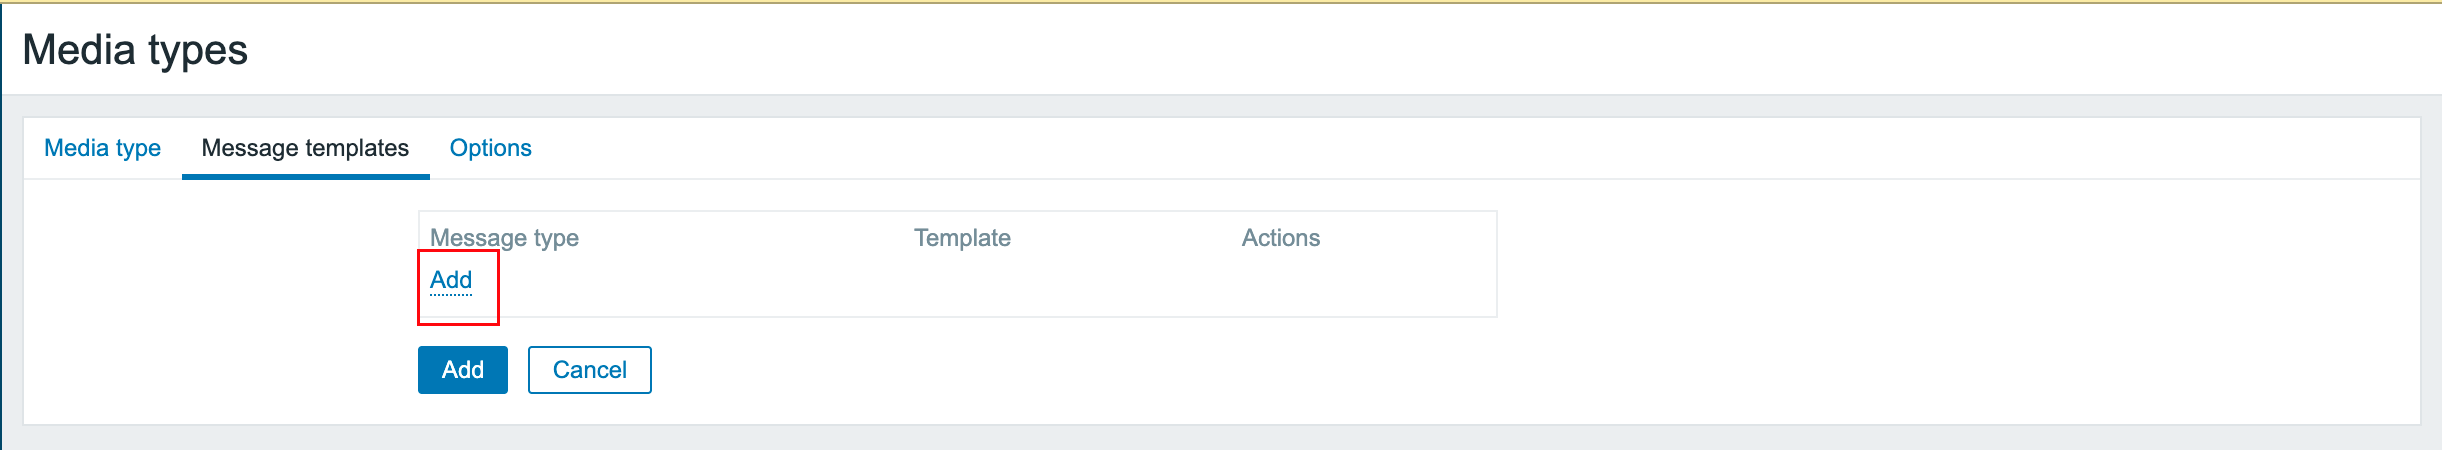
⑥ Select Problem, Problem recovery, Discovery, and Autoregistration for each of Message types from the popup window to register a total of four Message templates. Click the [Add] button to save.
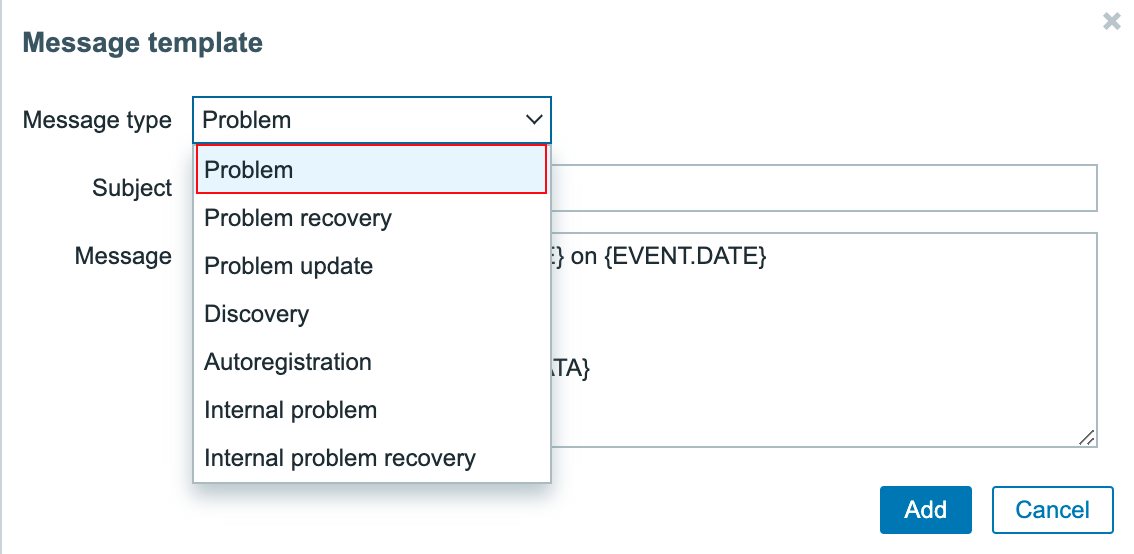
➆ Click the [Add] button of the Media type to save.
⑵ Create User
① Under Administration > Users menu, click the [Create User] button on the upper-right side. Enter each item under the User tab.
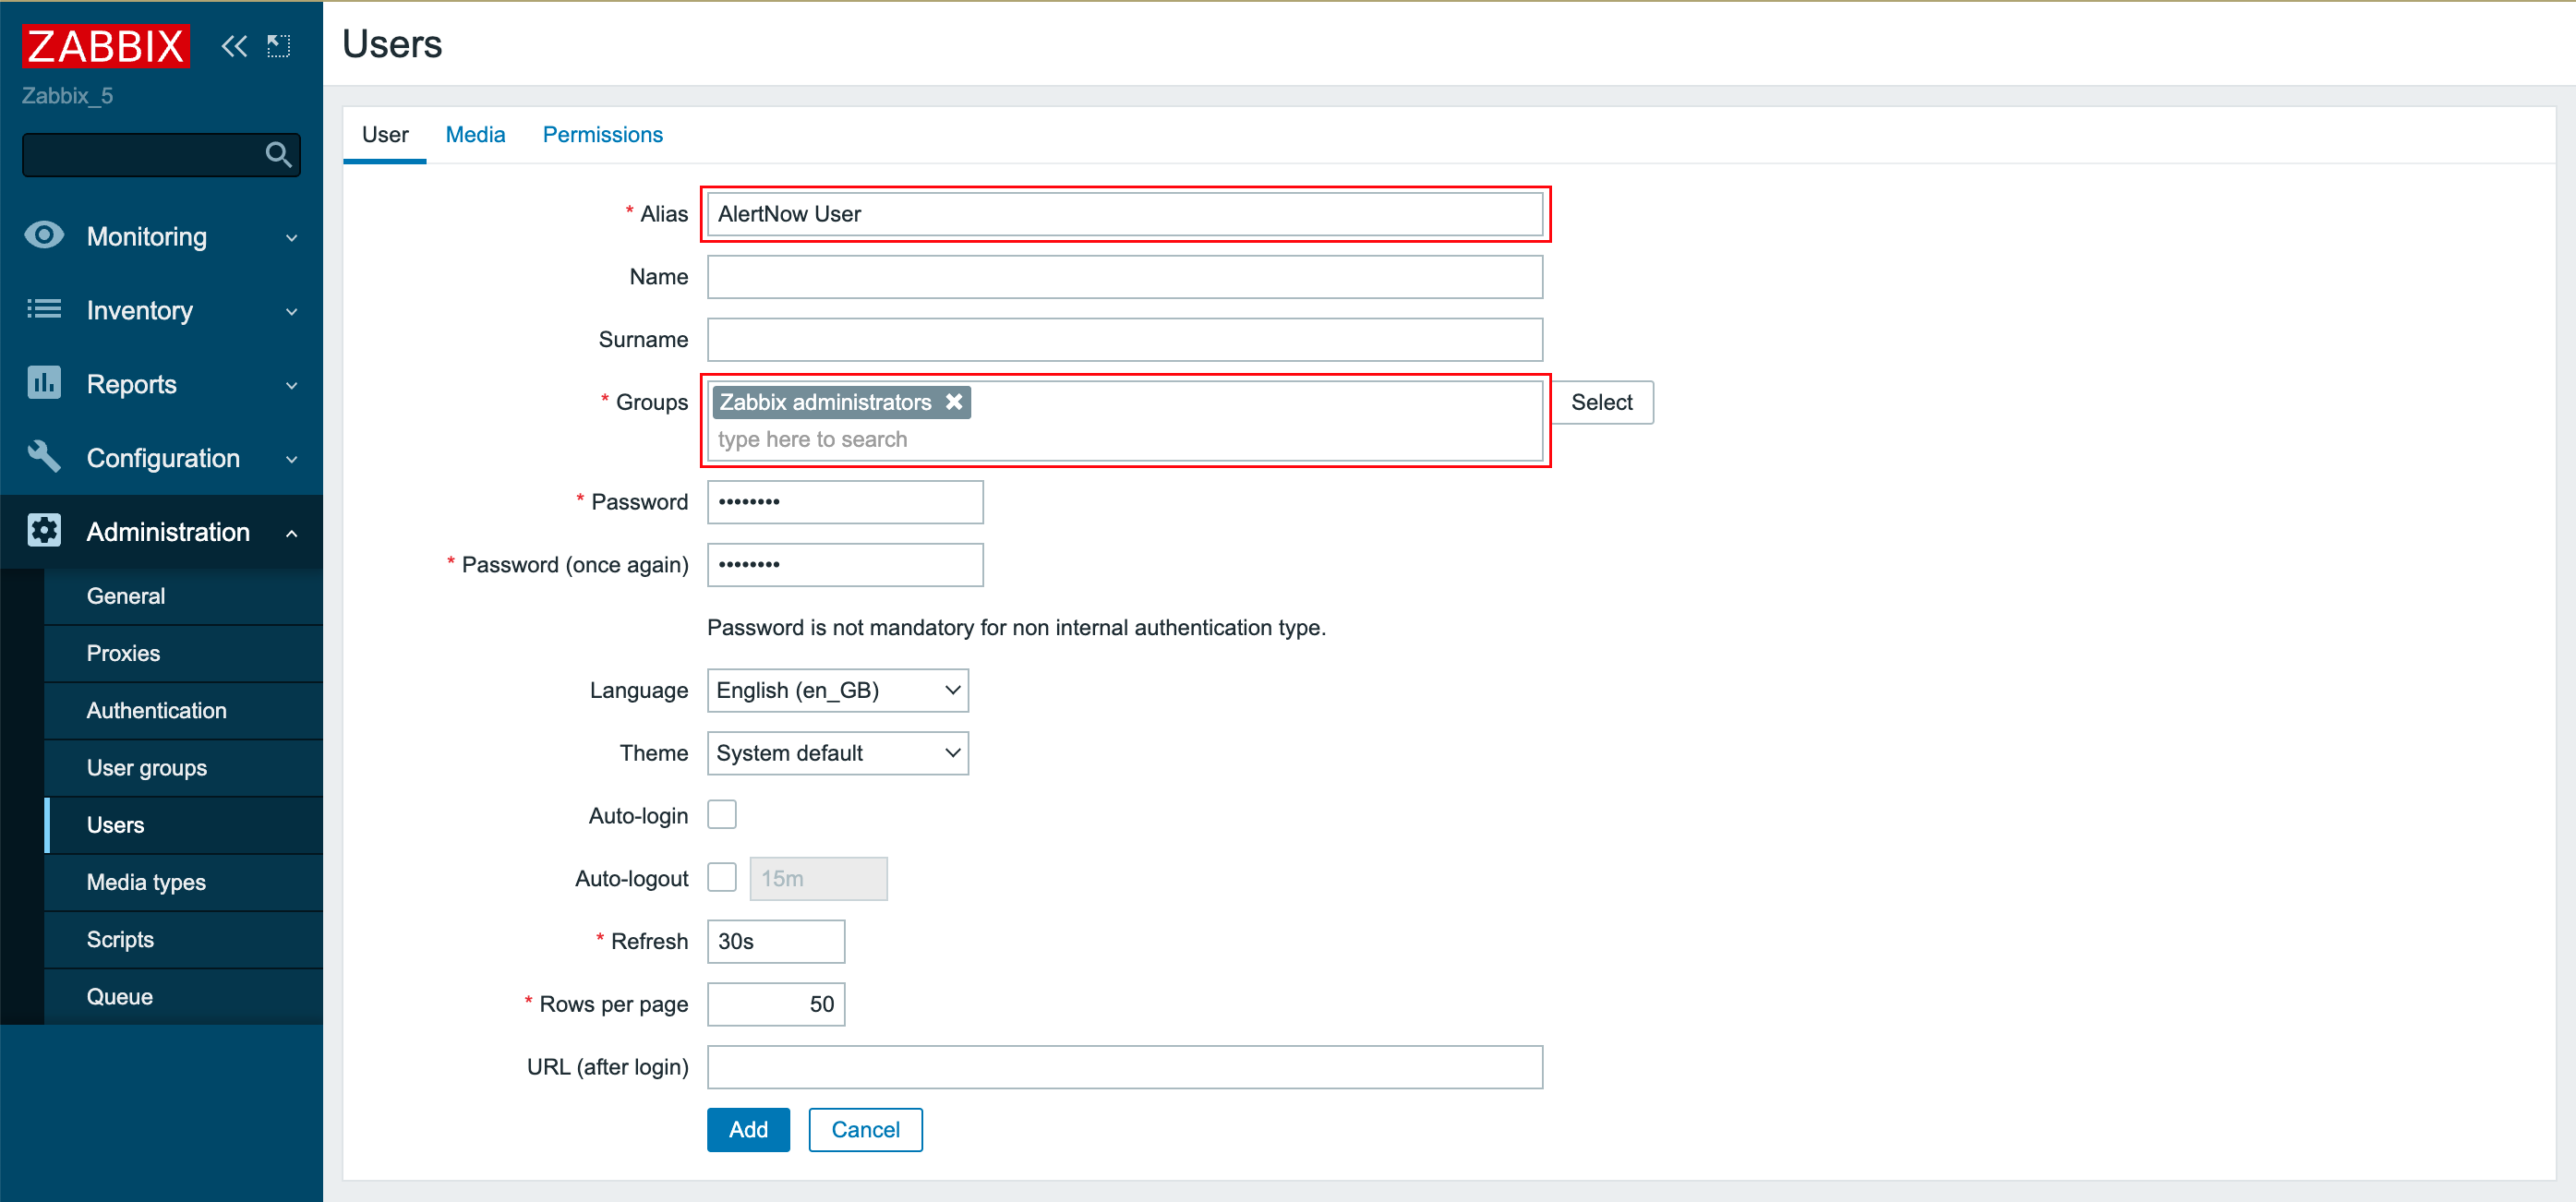
② Select Media tab, and click the [Add] button.
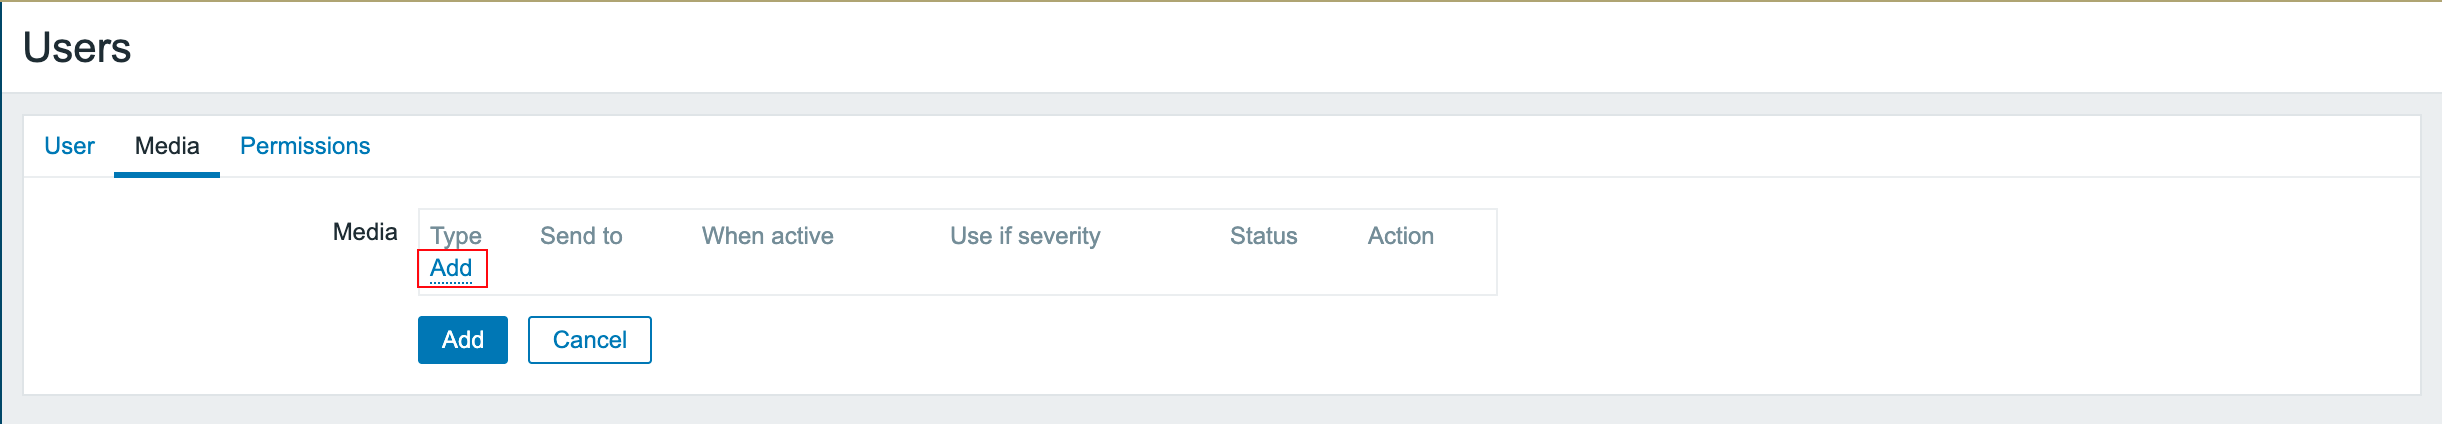
③ Enter each item on the popup window. When active sets the date and time period when you will be receiving notifications, and Use if severity lets you select severity level notifications that you want to be notified of.
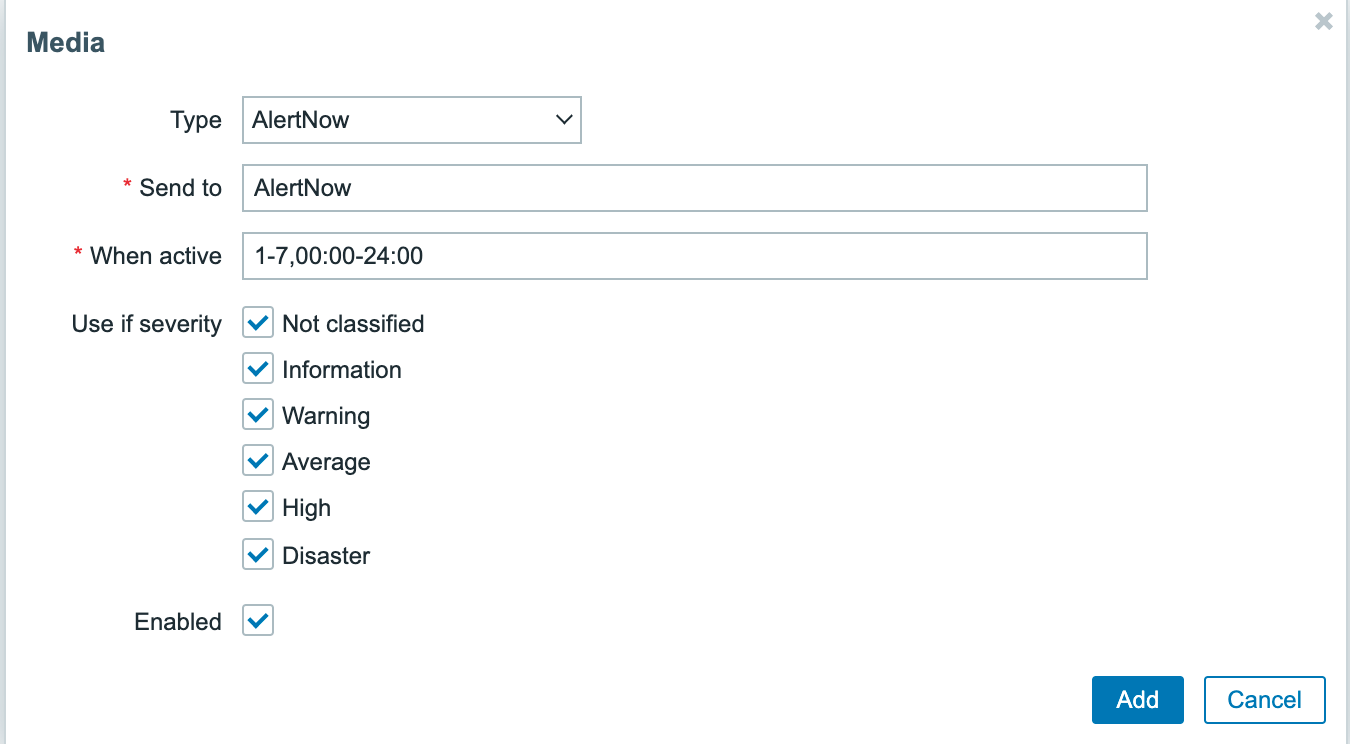
④ Click the Permission tab to see if you have Read permission or higher. To create a User, click the [Add] to save.
⑤ If proper permissions are not granted, go to the added User groups and grant permissions of Read or higher for Host group’s permissions under the Permissions tab.
⑶ Create Actions
① Under Configuration > Actions menu, click the [Create action] button on your upper-right corner. Enter AlertNow Action in the Name field under the Action tab.
② Enter each item of Operations and Recovery operations in the Operations tab in the modal popup window. Click the [Add] button to save.
③ Select AlertNow User in the Send to field and select AlertNow in the Send only to field. Click the [Add] button to save and to create AlertNow Actions. Finally, click the [Add] button to save.
⑷ Check Incident Creation in AlertNow
Modify the Trigger configuration in Zabbix and directly create a test event, and see if incidents were properly created in AlertNow by checking SMS, email, Voice Call, KakaoTalk or Slack message notifications.
Cloud Insight
To integrate Cloud Insight with AlertNow, you need to set Event Rules in the Cloud Insight console.
Click the [Create Integration] button located on the top-left side, and select the [Cloud Insight] card.
![]()
In the Create integration page, enter the required information and then click the [OK] button to create the integration.
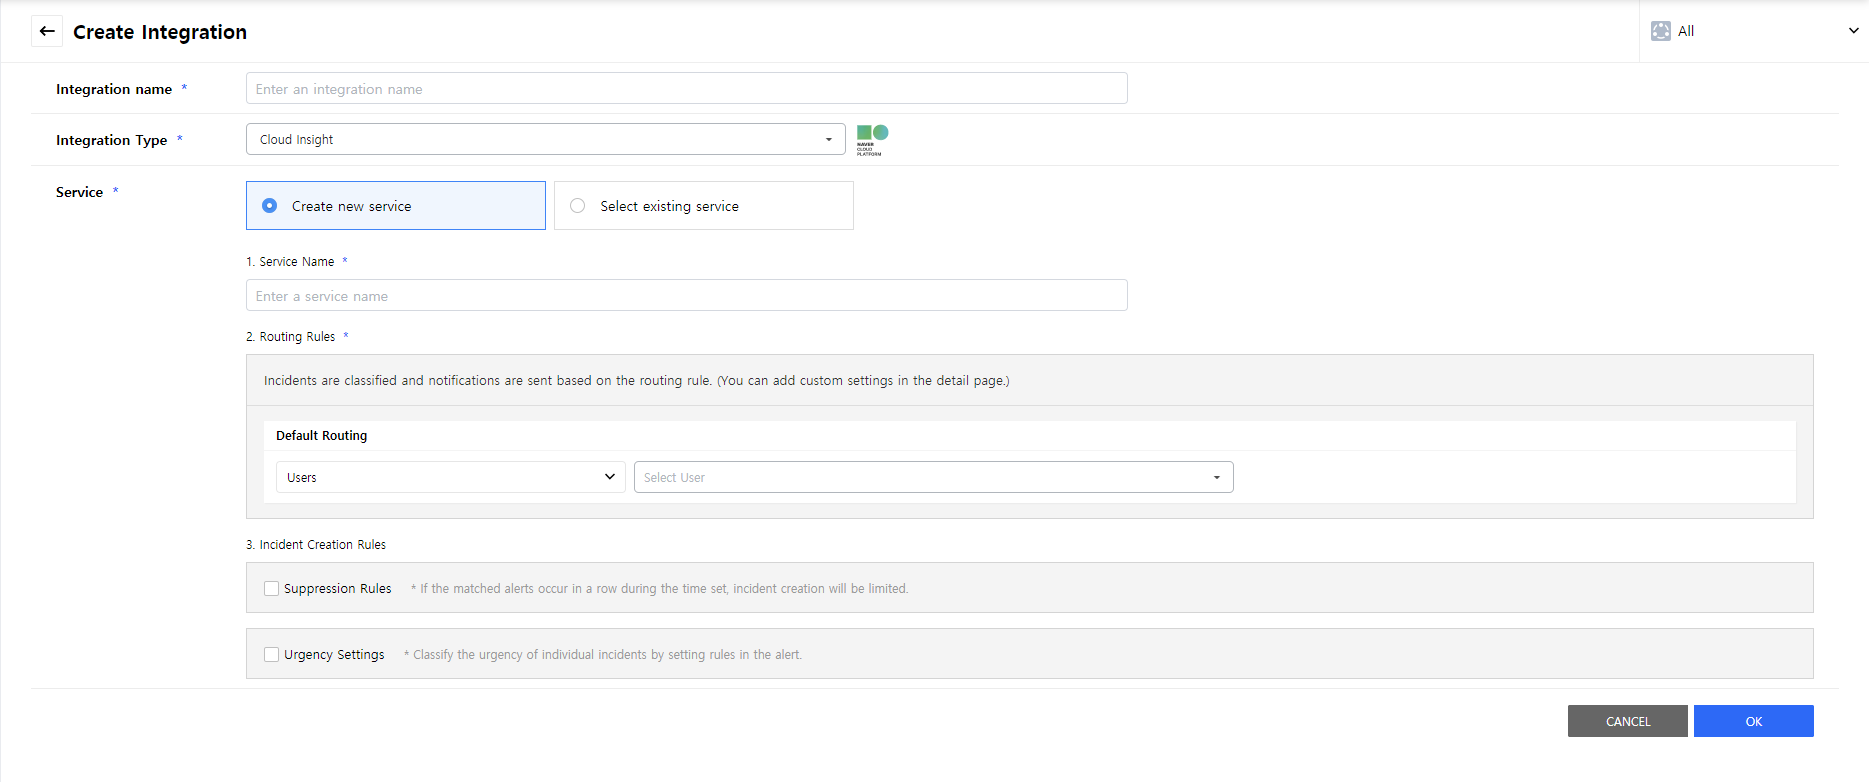
Event Rules Settings
📑 Note: Refer to Cloud Insight User Guide for detailed instructions on how to collect various performance indicators of monitoring targets and set thresholds via Cloud Insight.
① Go to Configuration > Event Rule of Cloud Insight, and click the [Create Event Rule] button.
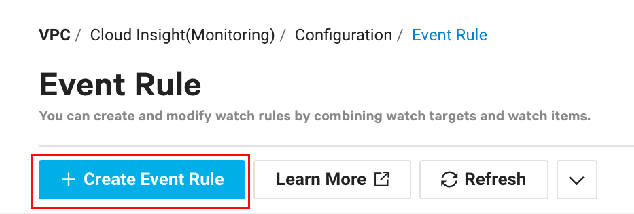
② Choose monitoring product and click the [Next] button.
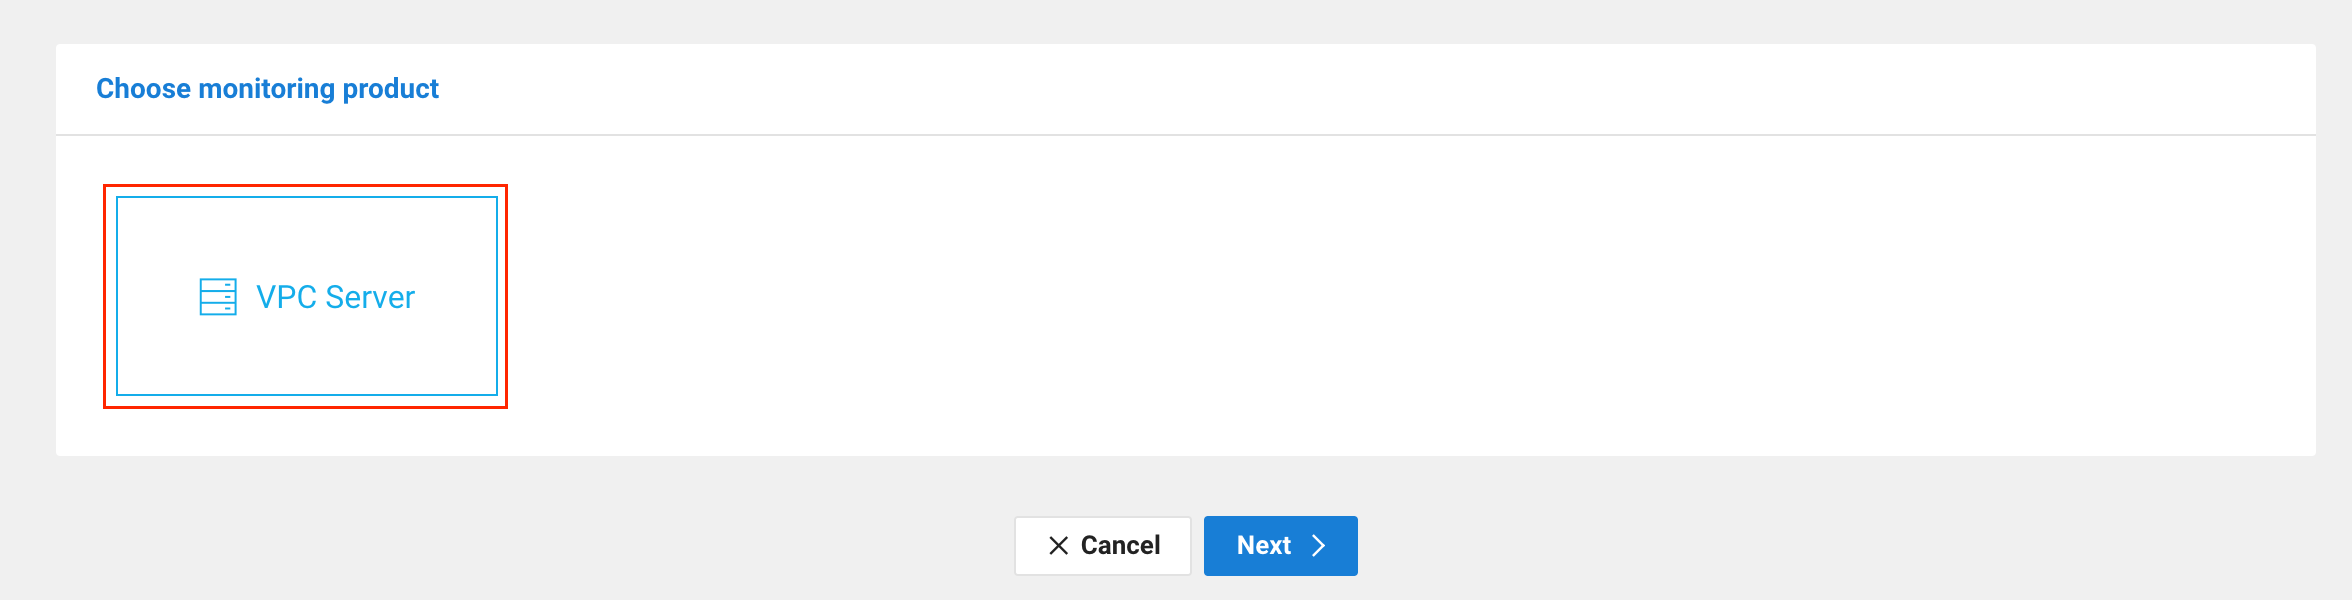
③ Choose a monitoring target. If there is not monitoring target, click the [Create Group] and select the target.
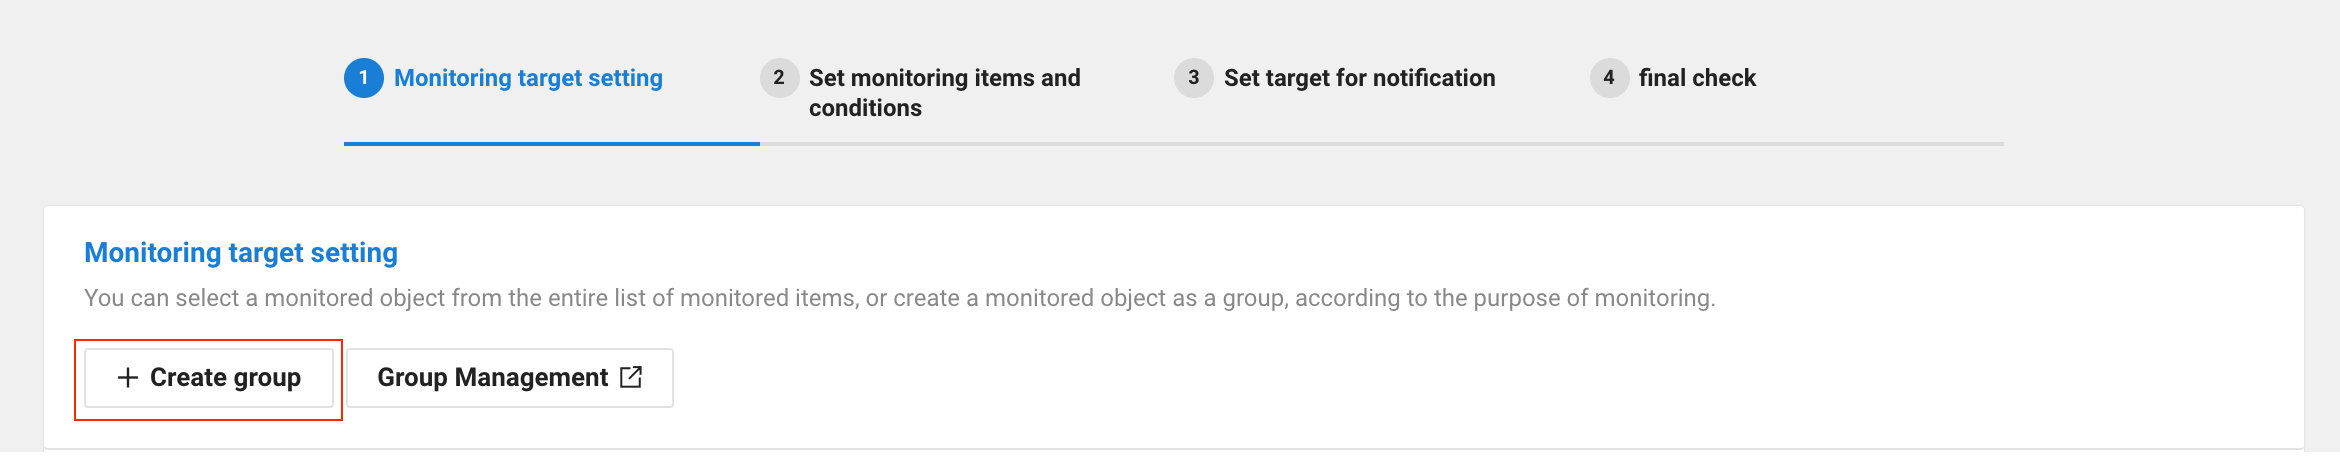
④ Set monitoring items and conditions. If there is no monitoring item, click the [Create Template] and select the items.
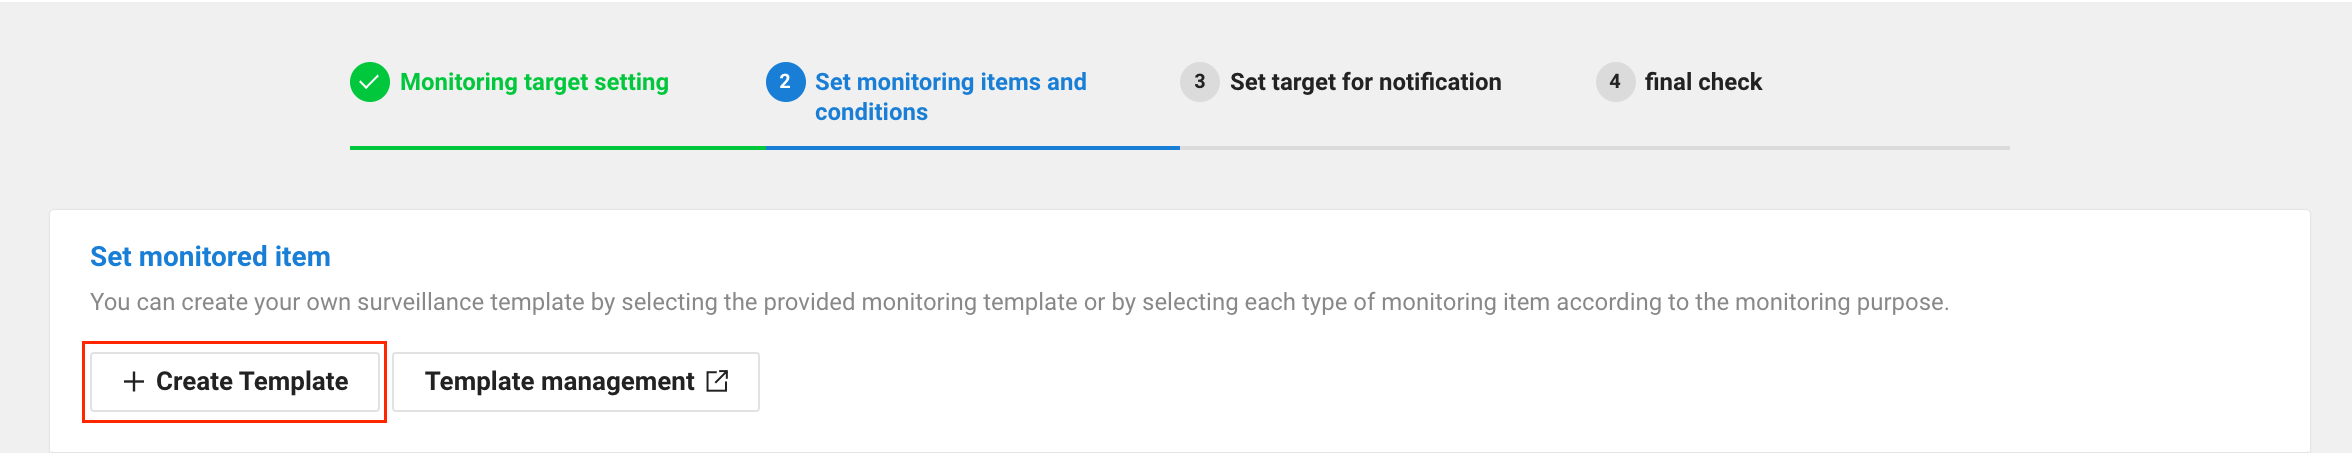
⑤ Set actions to be executed when an event occurs. Click the [Create Channel] button from the Integration tab, and create a channel using the AlertNow URL.
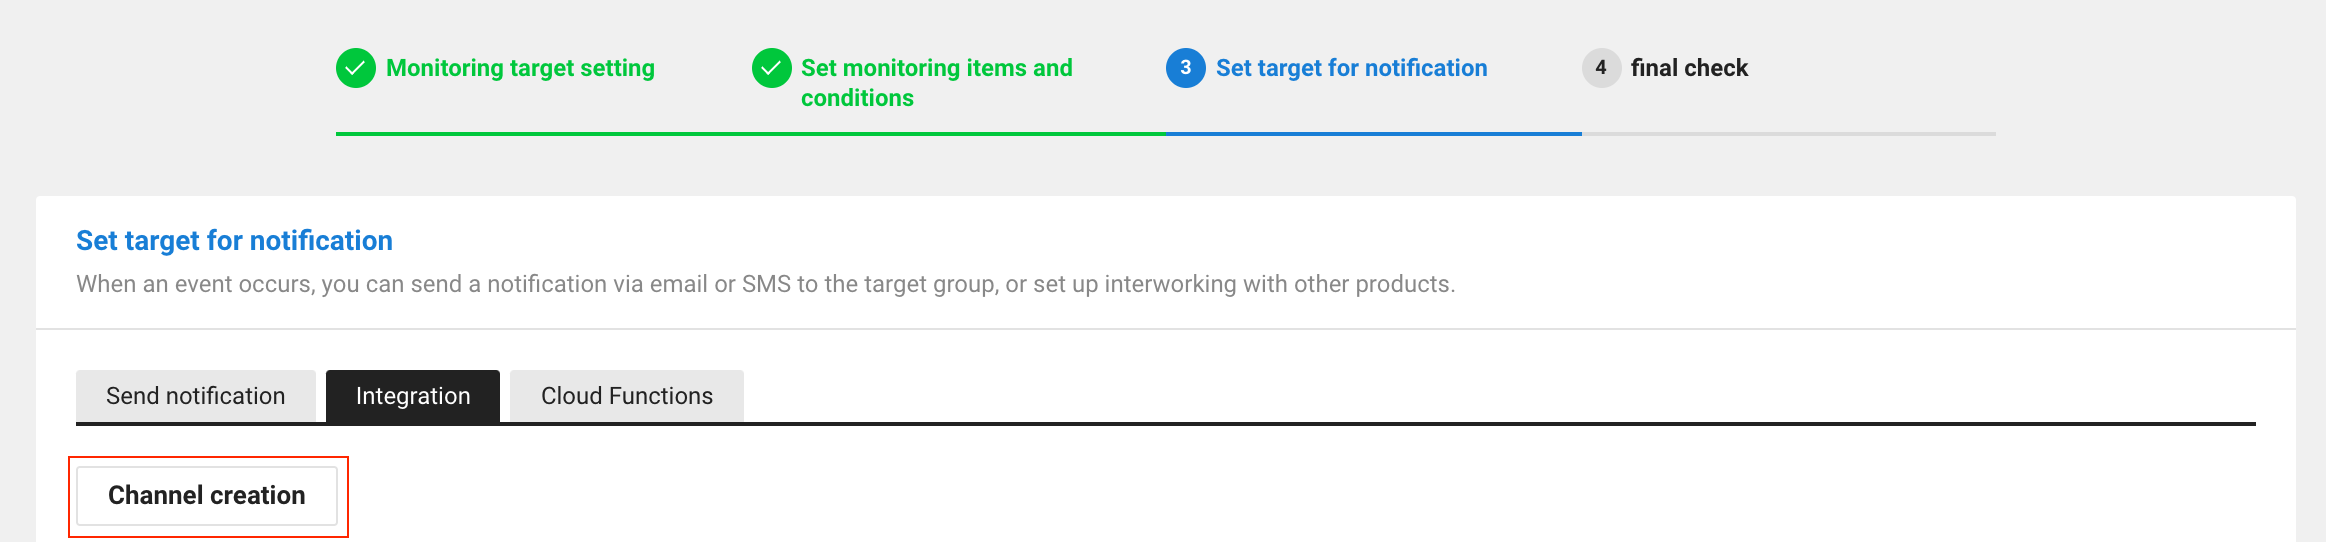
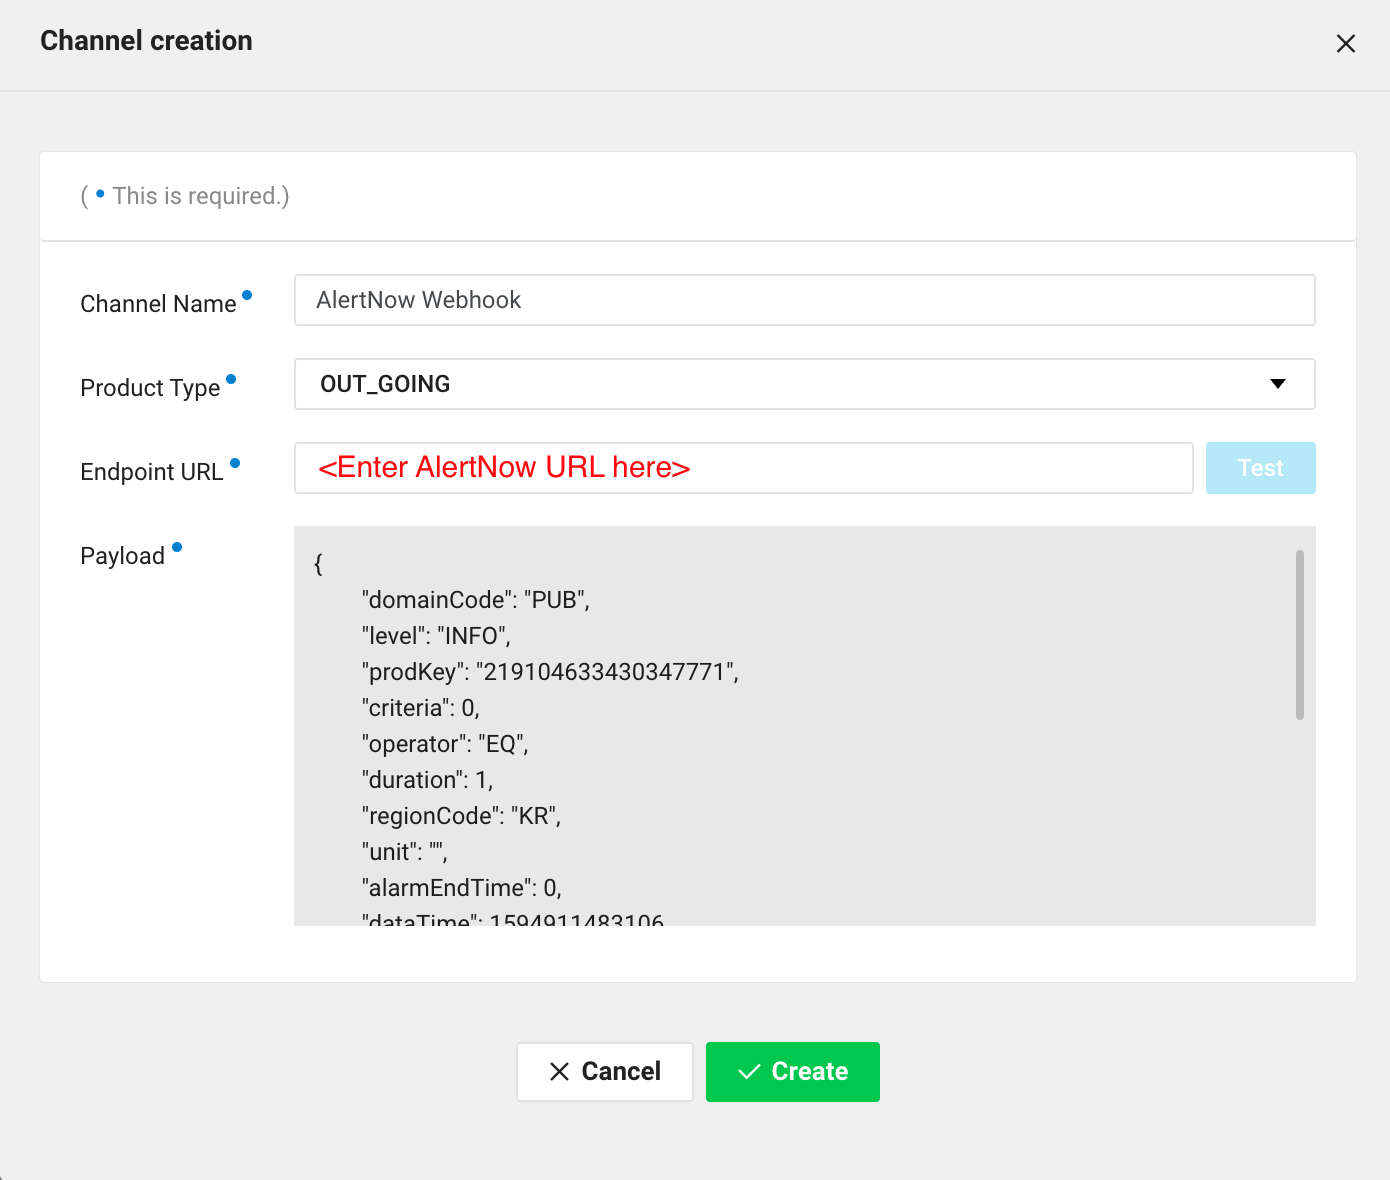
⑥ Enter a rule name and click Create button.
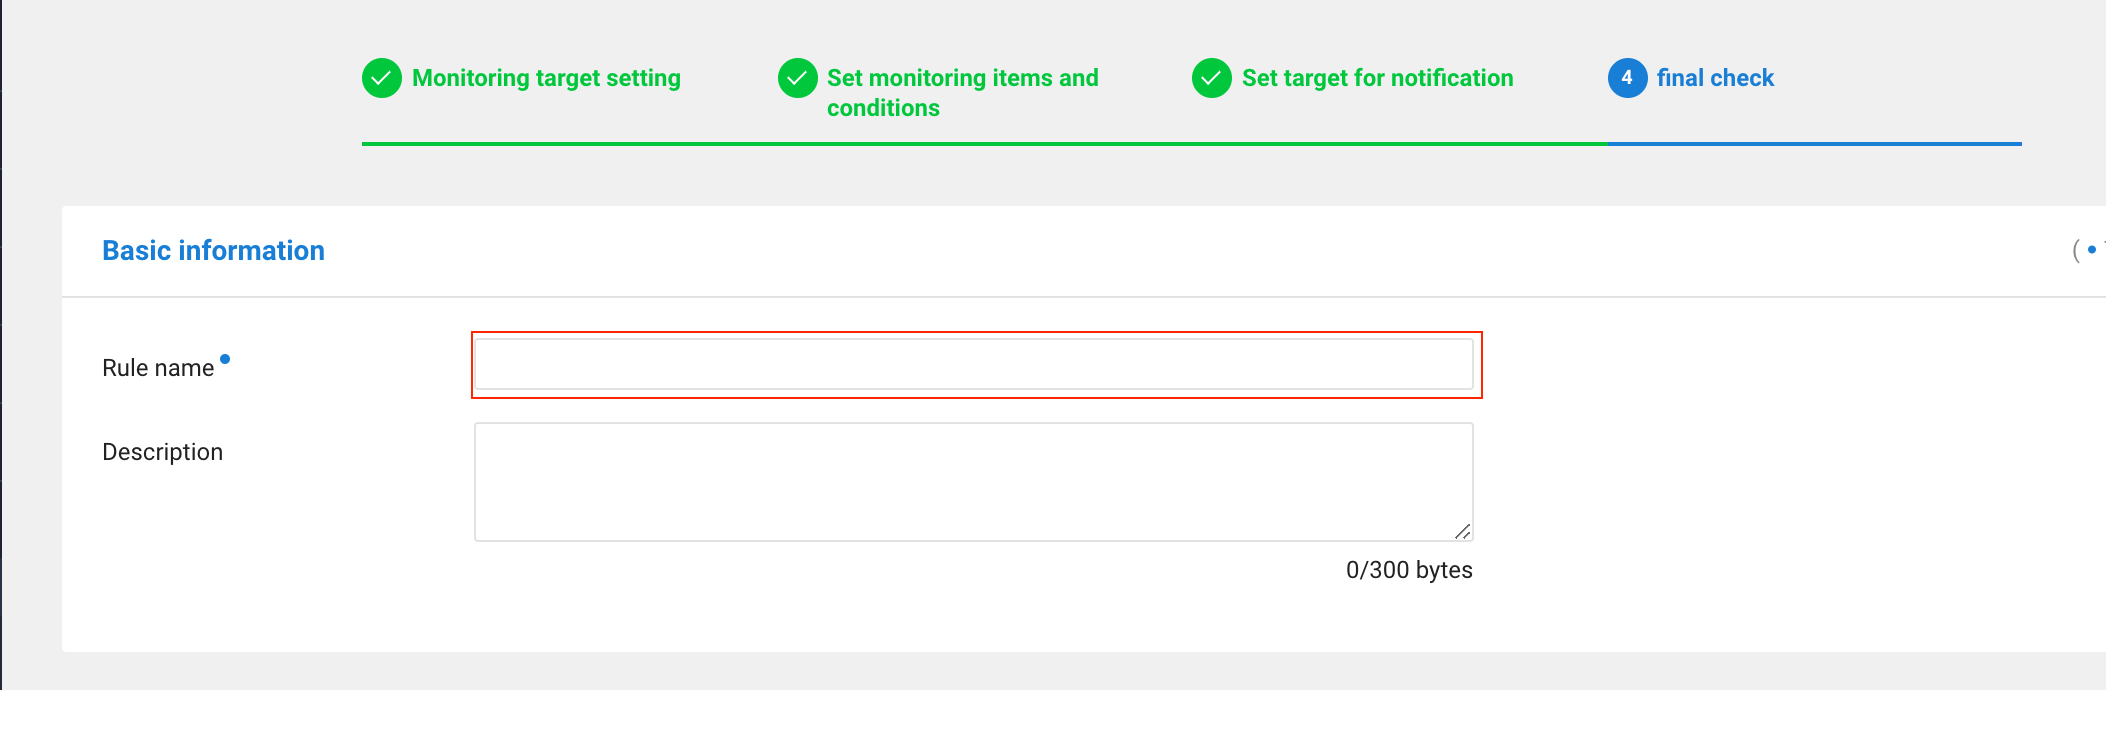
AWS Personal Health Dashboard
To connect AWS Personal Health Dashboard with AlertNow, you need to create an SNS topic, subscription, and event rule.
Click [Create Integration] button on the top-left corner of the Integration page, and select [AWS Personal Health Dashboard] card.
![]()
In the Create Integration page, enter the required information and then click the [OK] button.
![]()
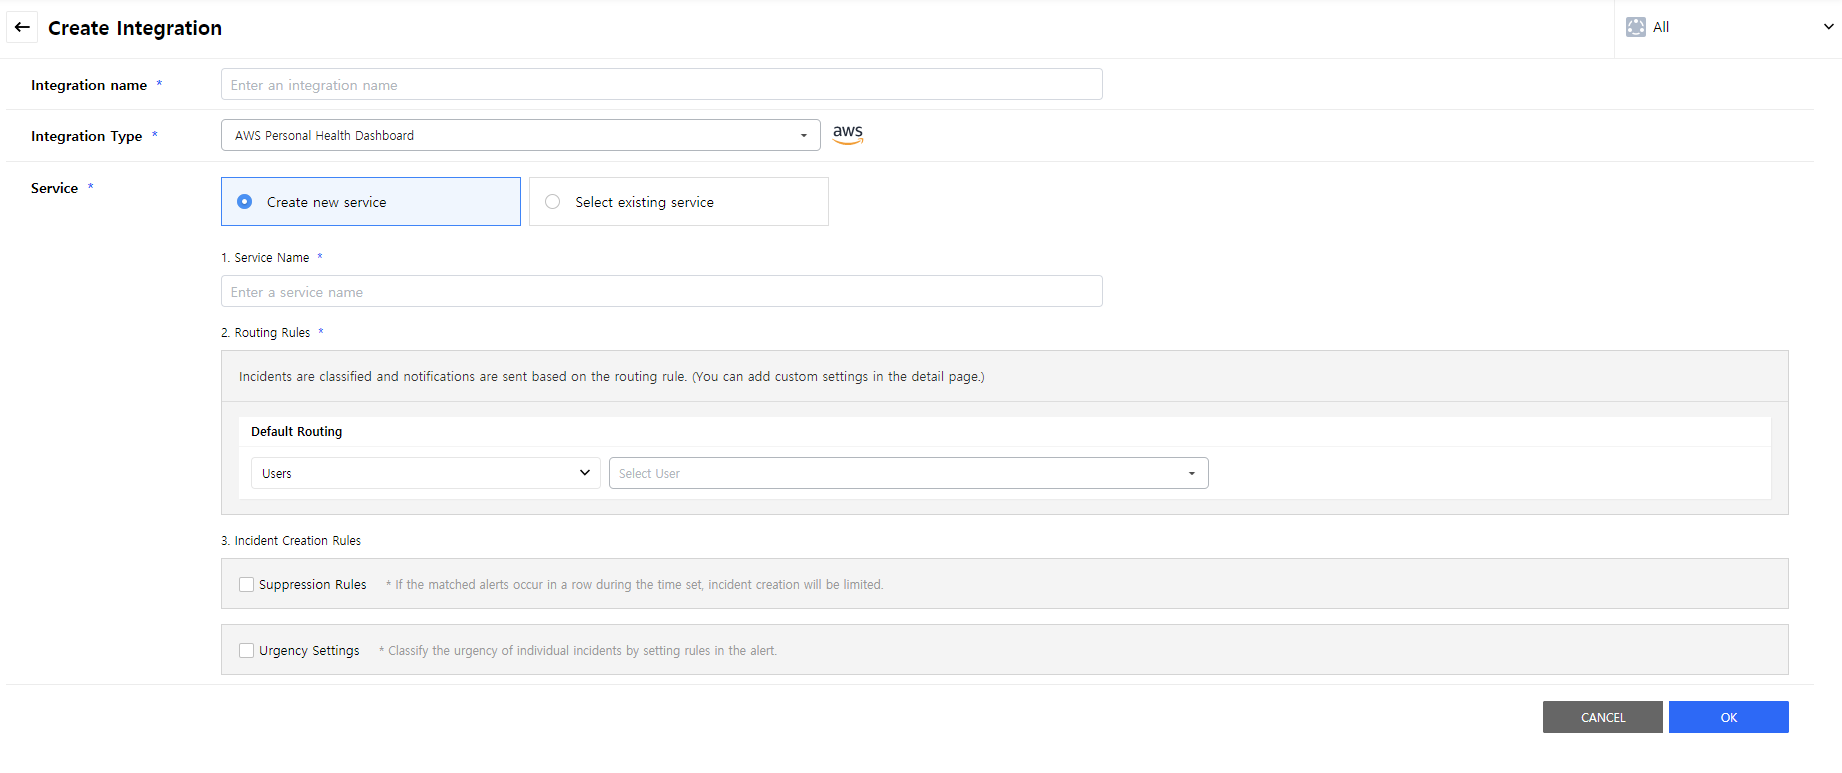
Access AWS Console
To connect AWS Personal Health Dashboard with AlertNow, you need to sign in to Amazon Console first. From the console, type SNS, and then select Simple Notification Service.
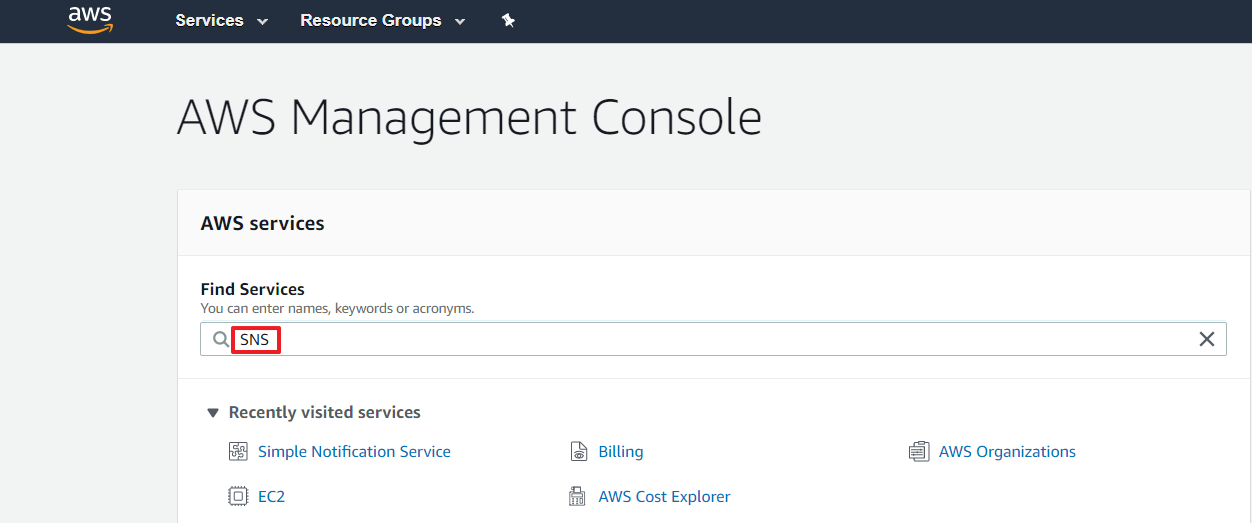
Create Amazon SNS Topic and Subscription
Select Topics in the Amazon SNS dashboard.
⑴ Create New Topic
Select [Create topic] on the top-right corner of the page.
The Create topic page will appear for you to enter required information.
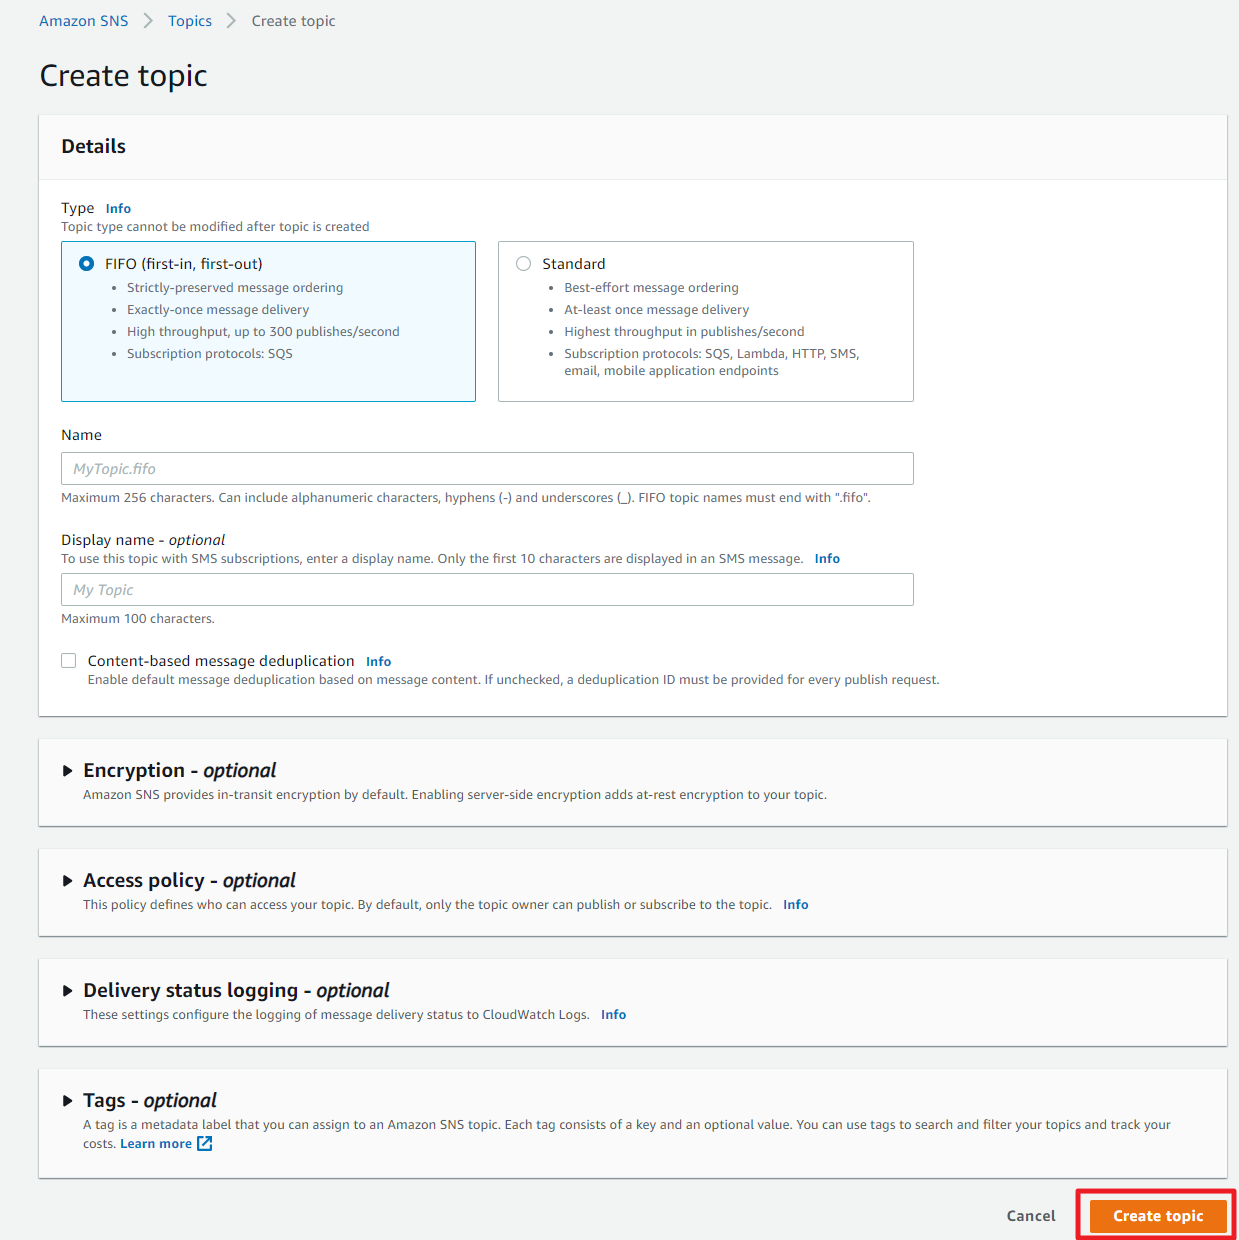
The table below provides descriptions for each item.
| Item | Description | Note |
|---|---|---|
| Topic Name | The name of the topic you want to create, and is the communication channel to send messages and subscription notifications and used to create an ARN for SNS topics that are created later. Topic names must include only uppercase and lowercase ASCII letters, numbers, underscores, and hyphens, and must be between 1 and 256 characters long. |
Required |
* For example, create with the name of TestCaseForSNSTopic,arn:aws:sns:us-west-2:111122223333:TestCaseForSNSTopic |
||
| Display Name | The display name to use for an Amazon SNS topic with SMS subscriptions. | Optional |
⑵ Create Subscription
Select [Create subscription] on the top-right corner of the page.
Fill in the required input fields in the Create subscription page, and click the [Create subscription] button.
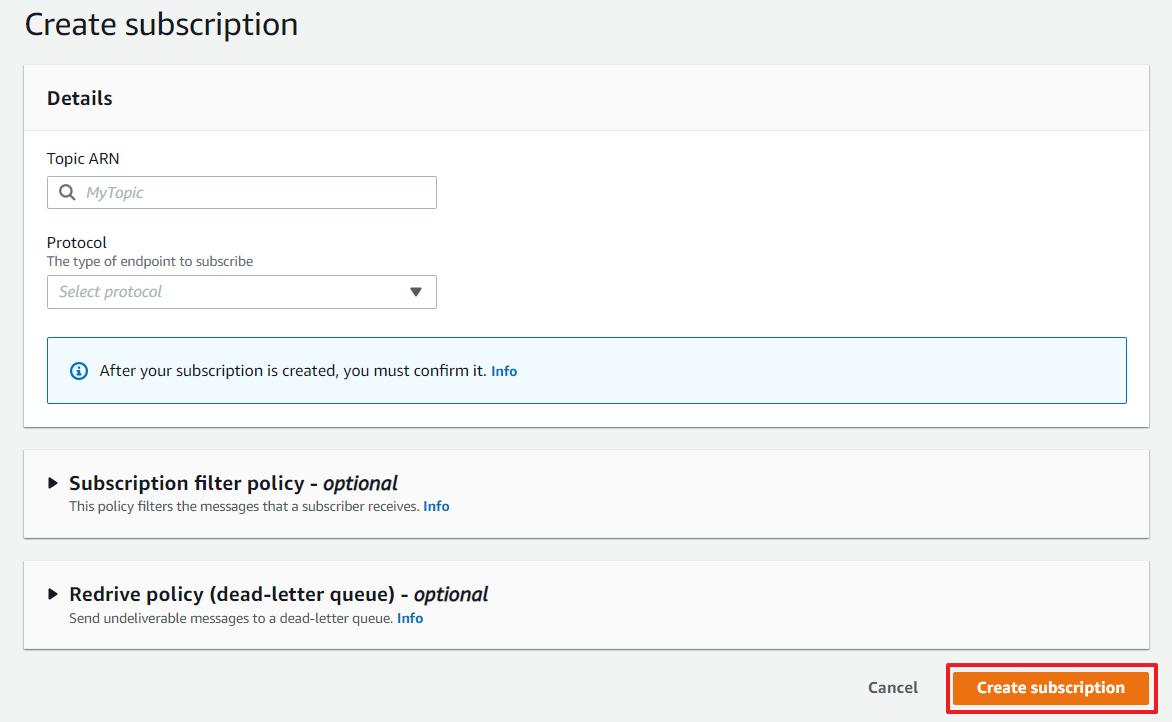
The table below provides descriptions for each item.
| Item | Description | Note |
|---|---|---|
| Topic ARN | It is automatically applied based on the topic name created. | Can be edited |
| Protocol | Select HTTPS. | |
| Endpoint | Enter the URL for the integration created in AlertNow. | Required |
⑶ Confirm Subscription
The subscription will be created as shown below.
Click the [Request confirmation] button, and then Subscription ID will be confirmed.
Create CloudWatch Event Rule
① Go to CloudWatch console and select events and rules in sequence, and click the [Create rule].
② Select Health for the service name and choose an event type you want to use. For Targets, select SNS topic, and click the [Configure details]. For event type, you may have options for Any… or Specific…. You can create a rule by selecting a pattern or custom-generated event.
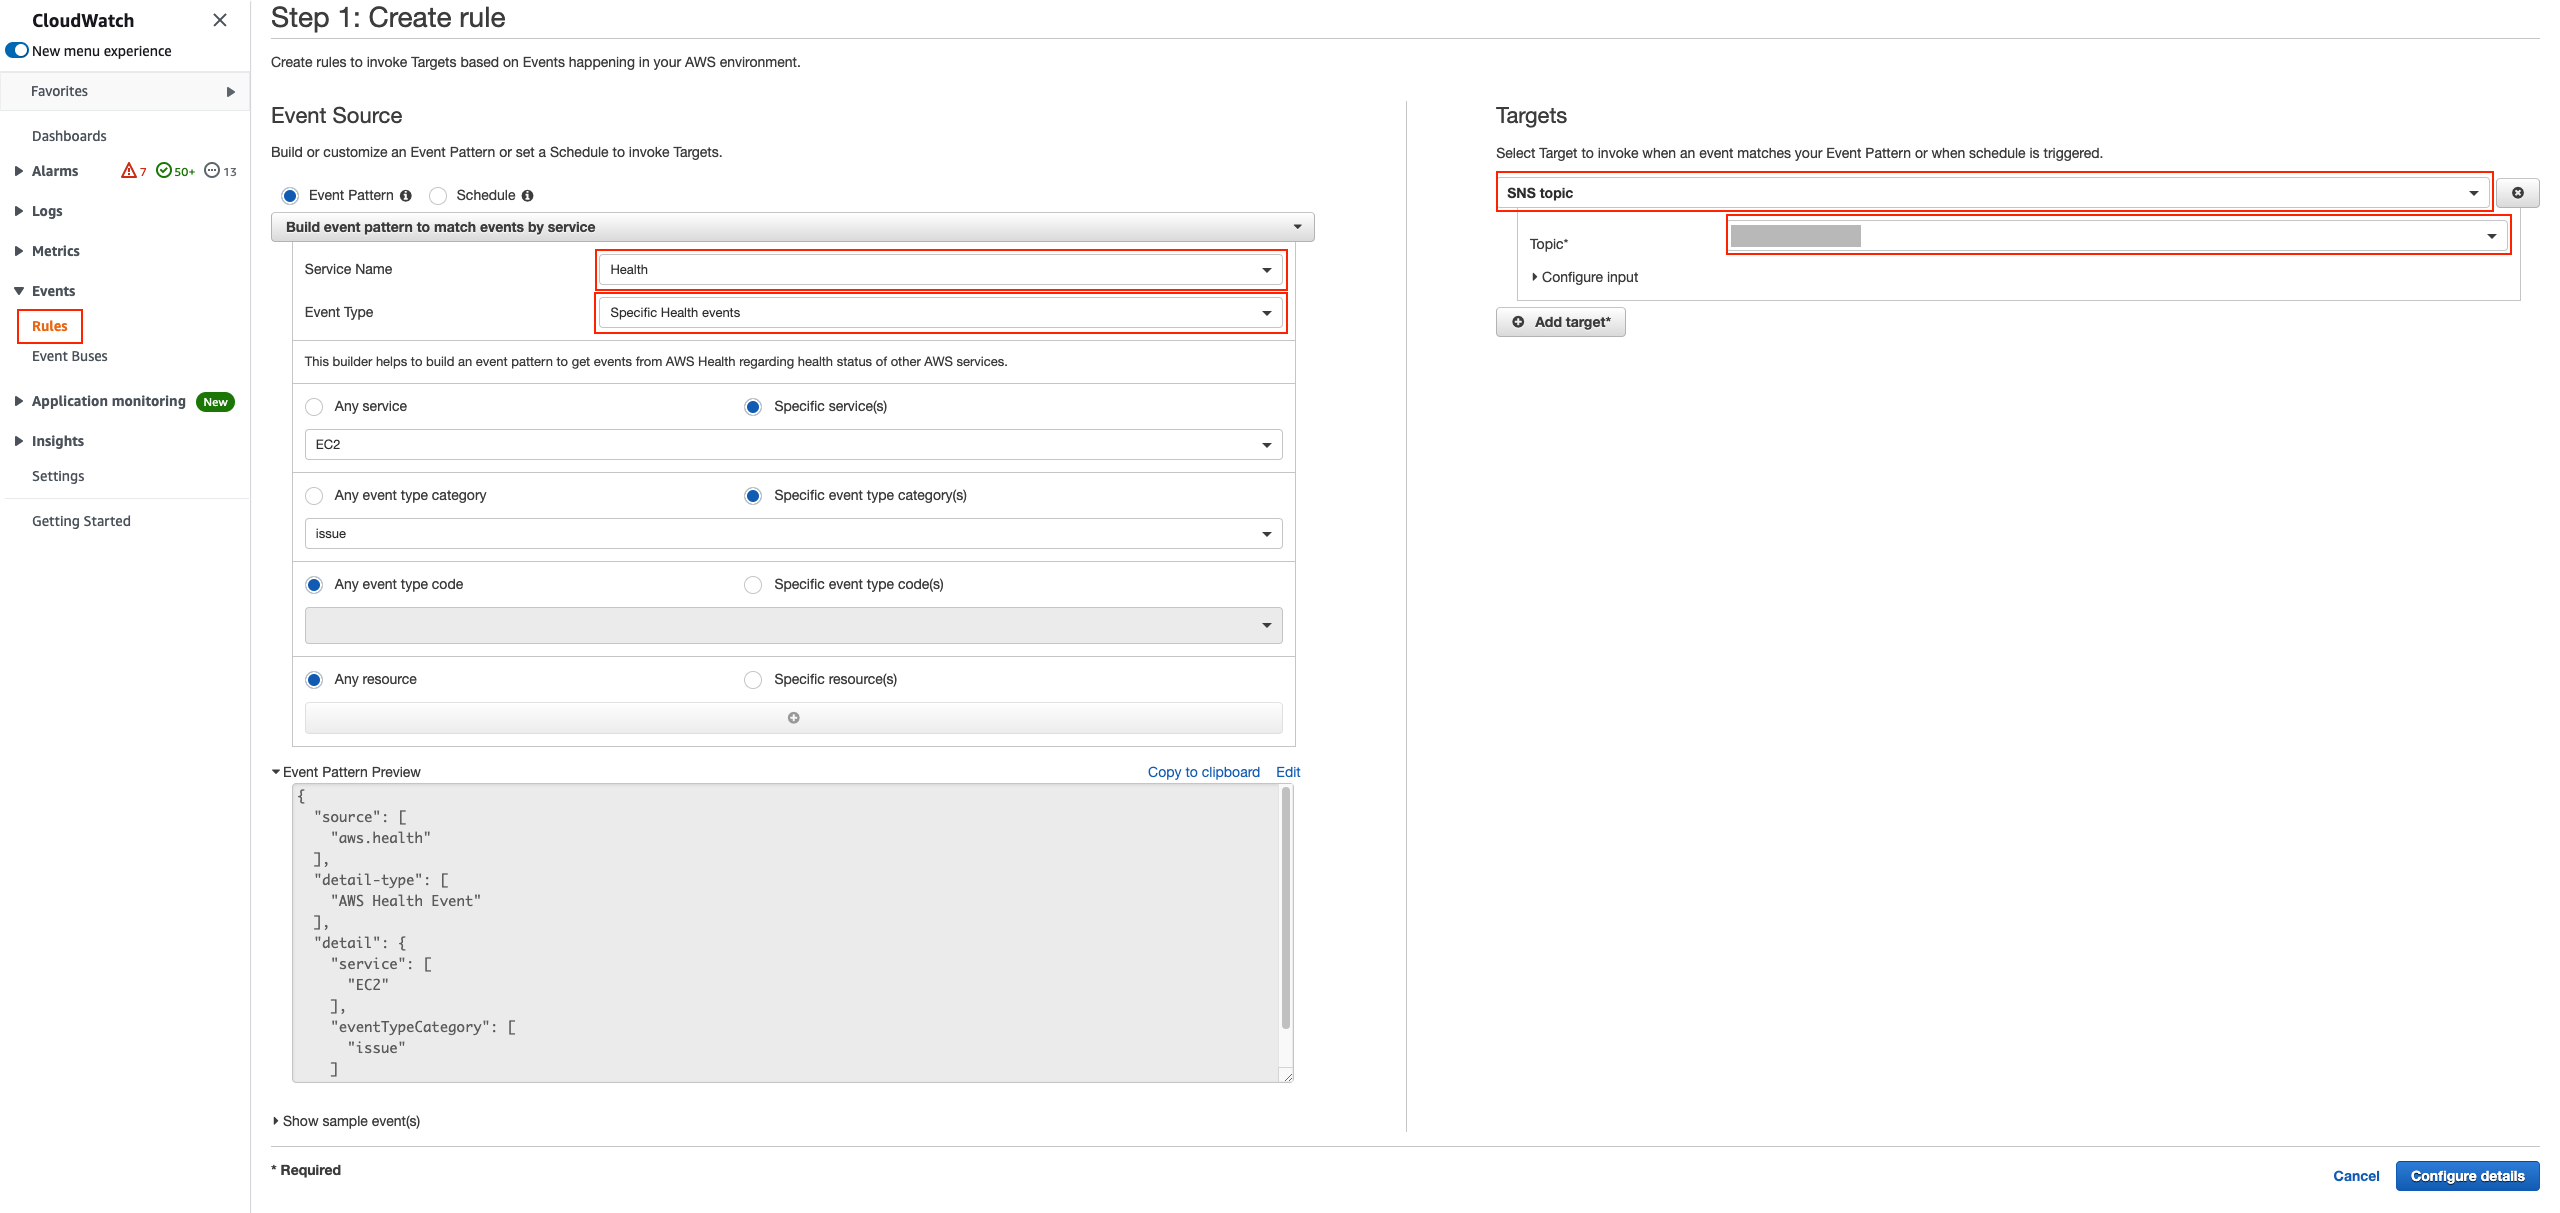
③ Enter a name for the event rule and then click the [Create rule].
Tencent Cloud Monitor
To integrate Tencent Cloud Monitor with AlertNow, you need to set the Notification Template from Tencent Cloud Monitor.
Click the [Create Integration] button on the top-left corner of the page, and select the [Tencent Cloud Monitor] card.
![]()
In the [Create integration] page, enter the required information and then click the [OK] button to create the integration.
![]()
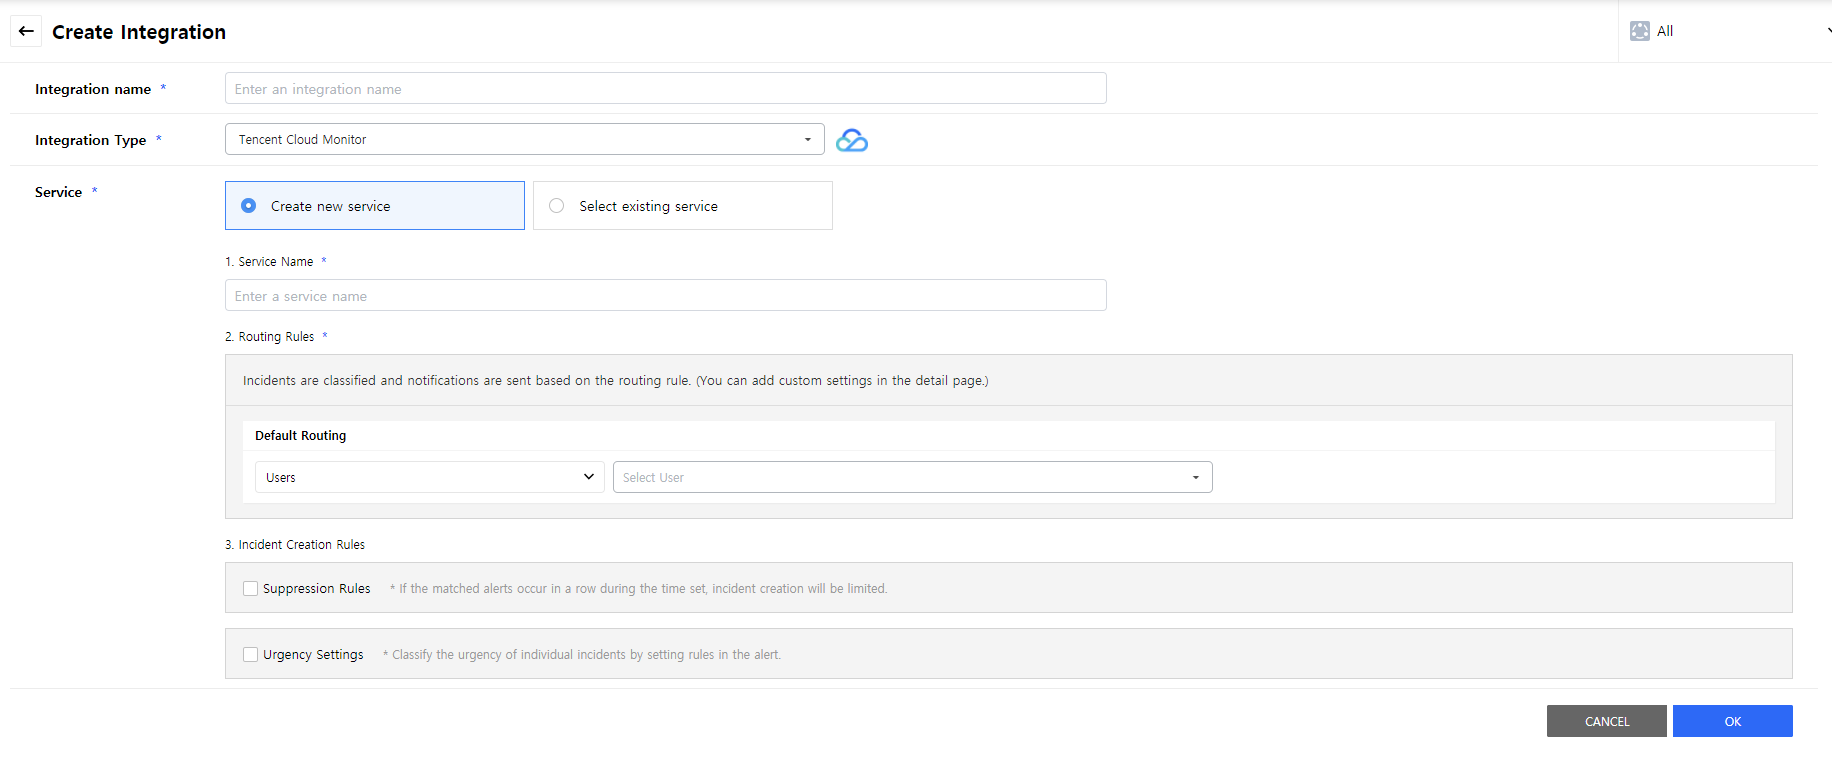
Notification Template Settings
① Sign in to the Tencent console.
② From the Tencent console, select Product -> Developer Service -> Cloud Monitoring in sequencial order.
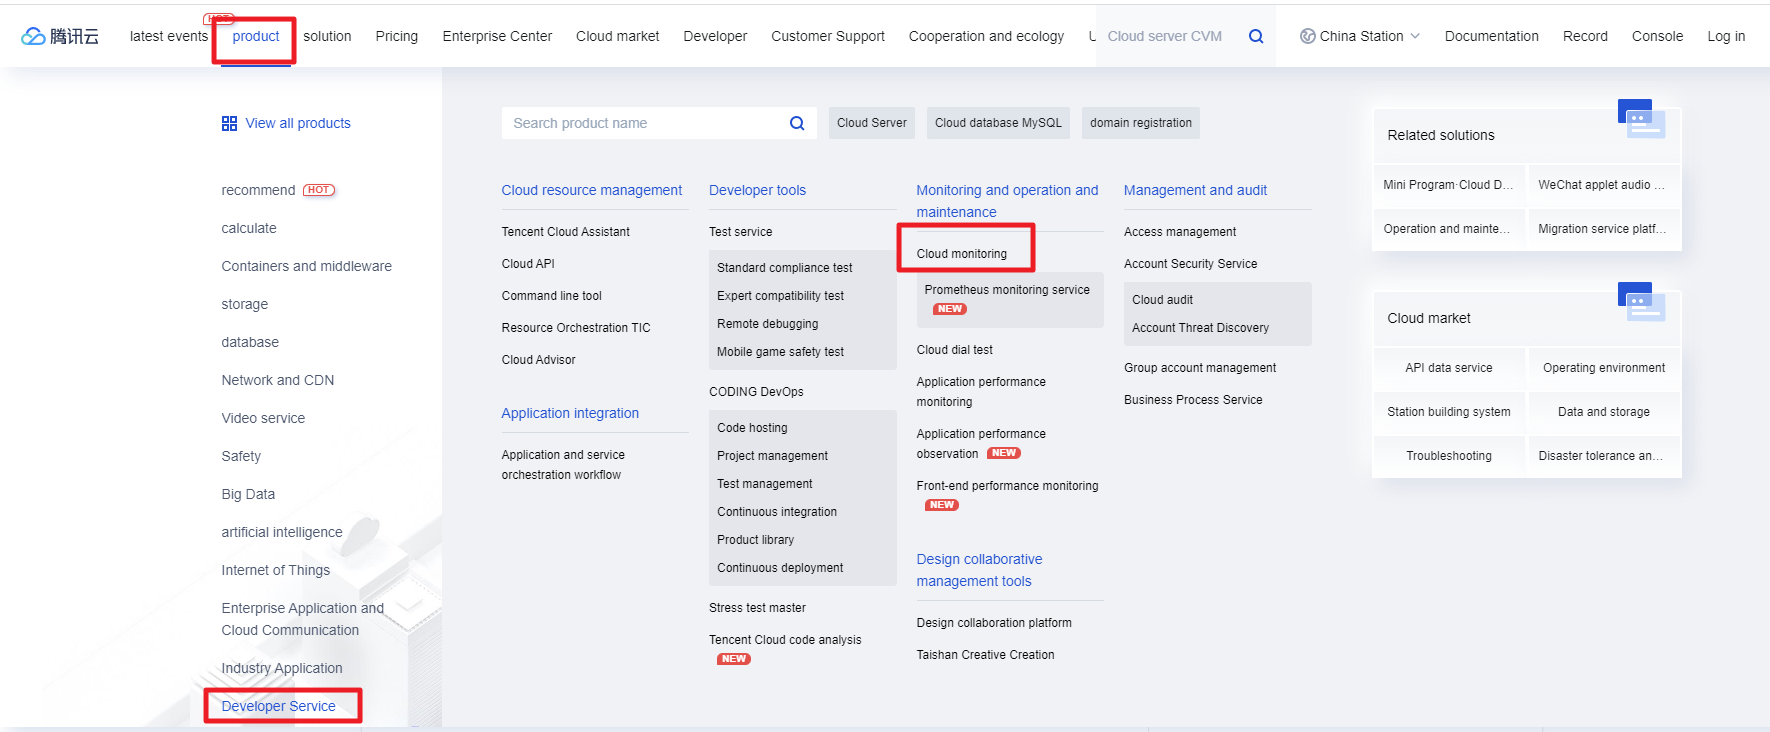
📜 Refer to User Guide for gathering performance metrics about monitoring targets and set threshold values by Tencent Cloud Monitor.
③ Click the [Create] button in the notification template.
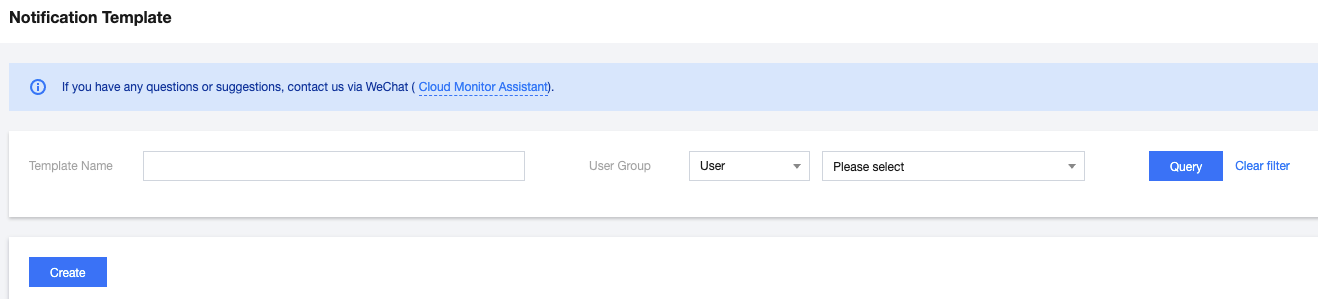
④ Enter the required input fields and the AlertNow URL created in the [Create integration] step.
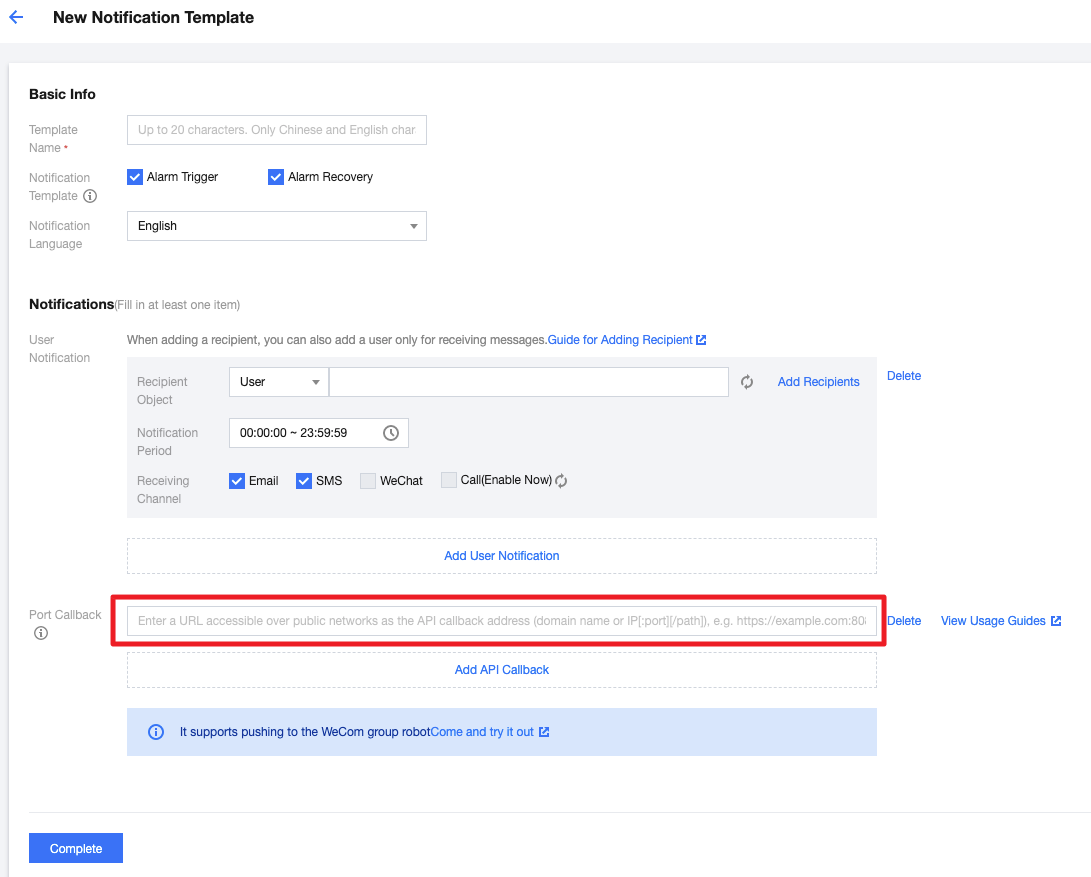
⑤ Set up alert-related rules such as setting conditions that trigger notifications and adding recipients in the Alert Strategy of Cloud Monitoring.
CheckMK
To integrate CheckMK with AlertNow, you need to add CheckMK plugin.
Click the [Create Integration] button on the top-left corner of the page, and select the [CheckMK] card.
![]()
In the Create integration page, enter the required information and then click the [OK] button to create the integration.
![]()
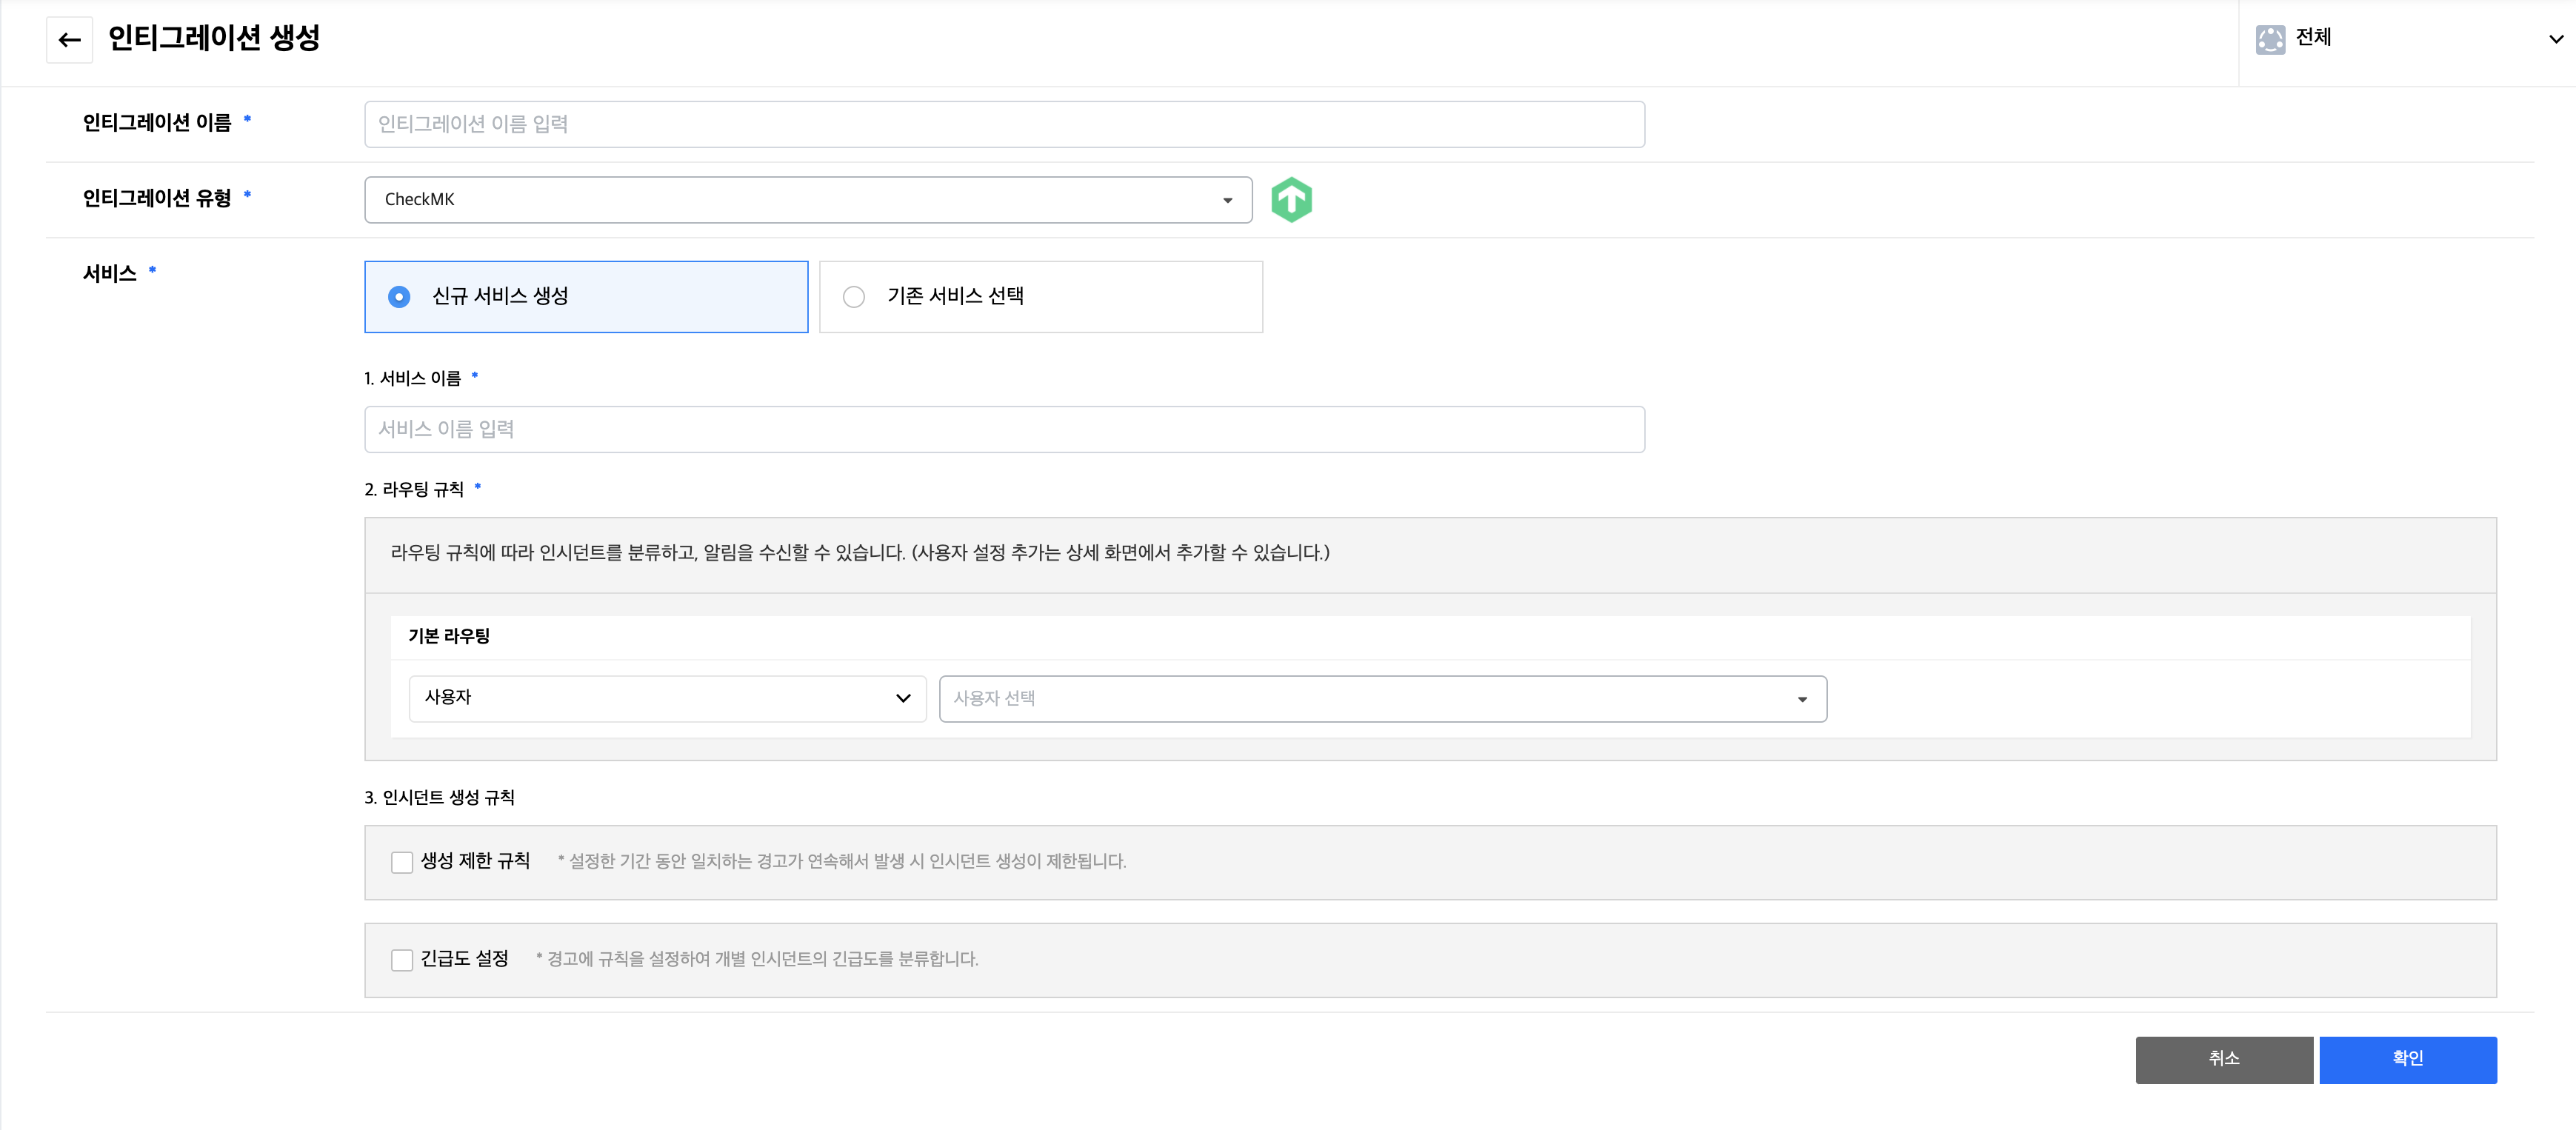
Add CheckMK Plugin
① Get the script below after installing the CheckMK plugin.
                    #!/usr/bin/python
                    # AlertNow

                    import json
                    import os
                    import requests

                    def main():
                            context = dict([(var[7:], value.decode("utf-8"))
                                for (var, value) in os.environ.items()
                                if var.startswith("NOTIFY_")])


                            if context['NOTIFICATIONTYPE']=='PROBLEM' or  context['NOTIFICATIONTYPE']=='RECOVERY' or  context['NOTIFICATIONTYPE']=='ACKNOWLEDGEMENT':
                                print('NOTIFICATIONTYPE ' + context['NOTIFICATIONTYPE'] + ' supported')
                            else:
                                print('NOTIFICATIONTYPE ' + context['NOTIFICATIONTYPE'] + ' not supported')
                                return "NOTIFICATIONTYPE " + context['NOTIFICATIONTYPE'] + " not supported"

                            for k, v in context.items():
                                if (v.startswith('$') and v.endswith('$')):
                                    context[k]=''

                            if "PARAMETER_1" in context:
                                    alertnow_url = context["PARAMETER_1"]

                                    if "PARAMETER_1" in context.keys():
                                            del context["PARAMETER_1"]
                                    if "PARAMETERS" in context.keys():
                                            del context["PARAMETERS"]
                            else:
                                    print('no API key Specified')
                                    return "No API Key Specified."

                            url = alertnow_url
                            headers = {'Content-Type' : 'application/json'}

                            print(context)

                            try:
                                    response = requests.request("POST", url, headers=headers, data=json.dumps(context, ensure_ascii=False, sort_keys=False))
                                    print(response.text)
                                    is_success = True
                            except:
                                    is_success = False

                            if is_success:
                                    print('Script Success')
                                    return "Script finished successfully."
                            else:
                                    print('Script Failed')
                                    return "Script failed."

                    main()
② Put the script under the directory below, and give the necessary permissions to the script using the command below.
/omd/sites/{site-name}/local/share/check_mk/notifications/
Permission command
sudo chmod +x alertnow
Configuration in CheckMK
① In CheckMK, click Setup > Users > Add user.
② Enter a Username and Full name.
③ Leave the Authentication part blank.
④ Check Disable password, and select Normal monitoring user for Roles.
⑤ Click [Save].
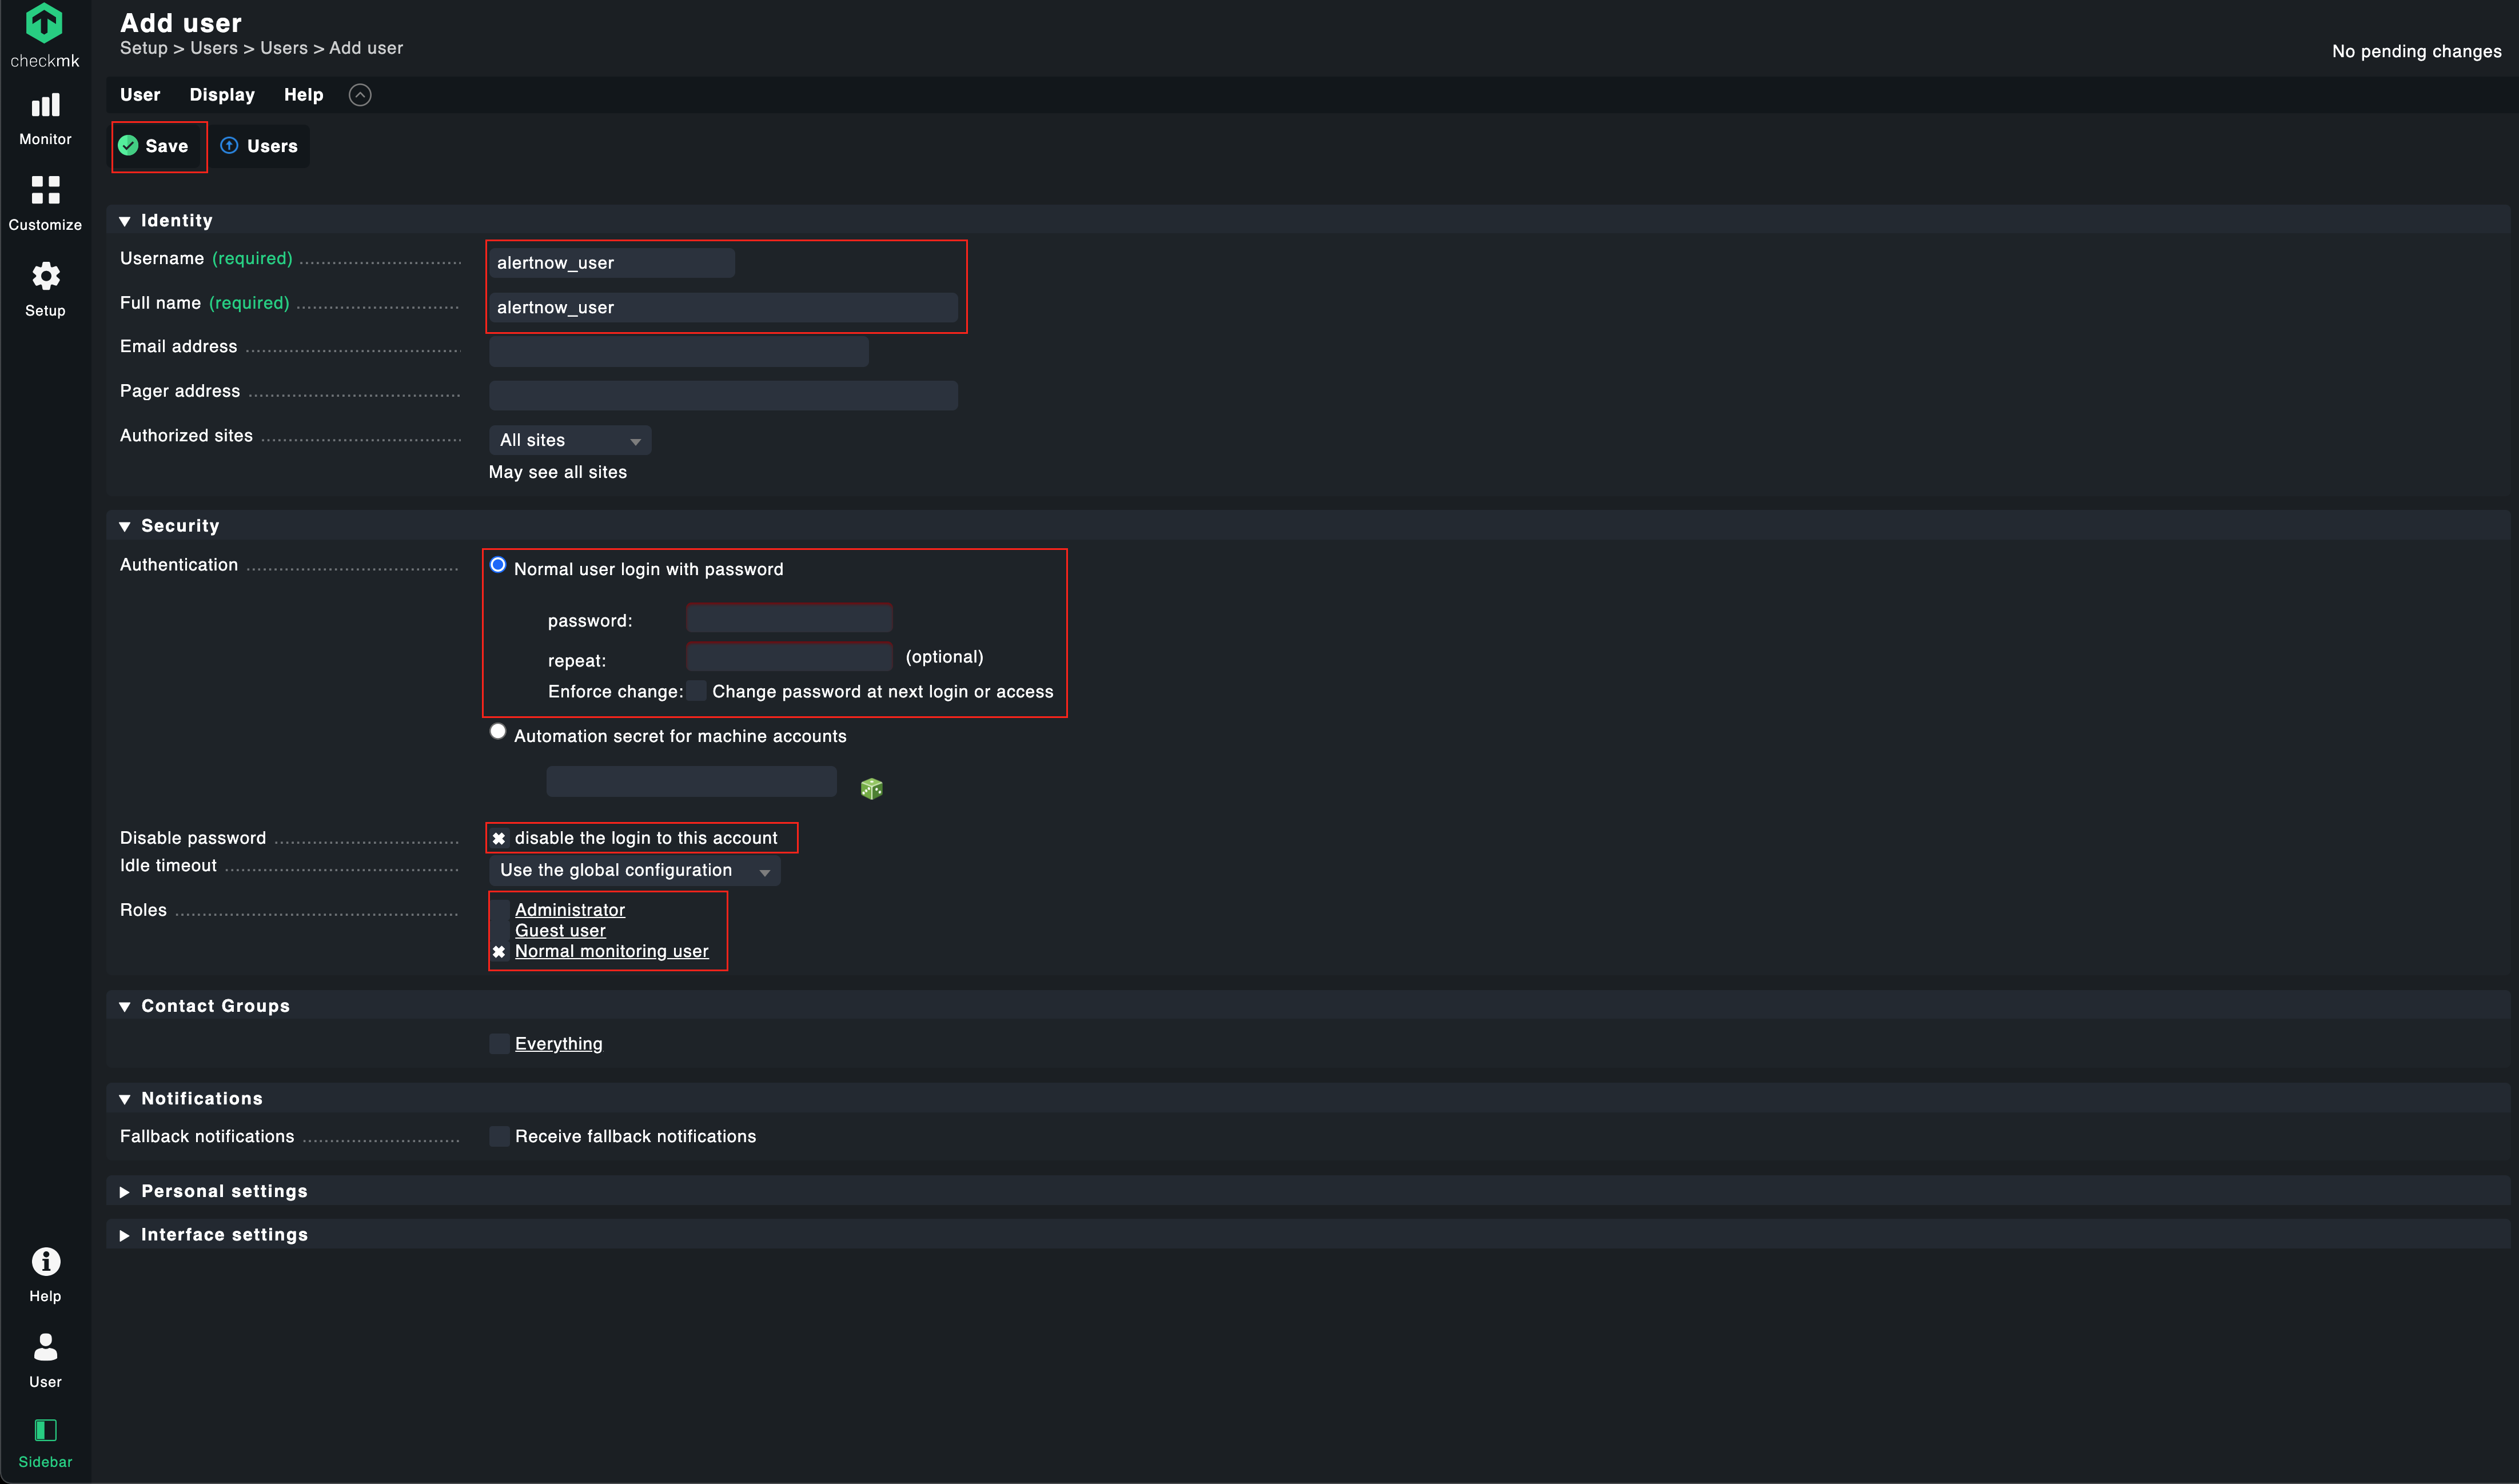
⑥ Click on the notification button under Actions column.

⑦ Click the [Add rule].
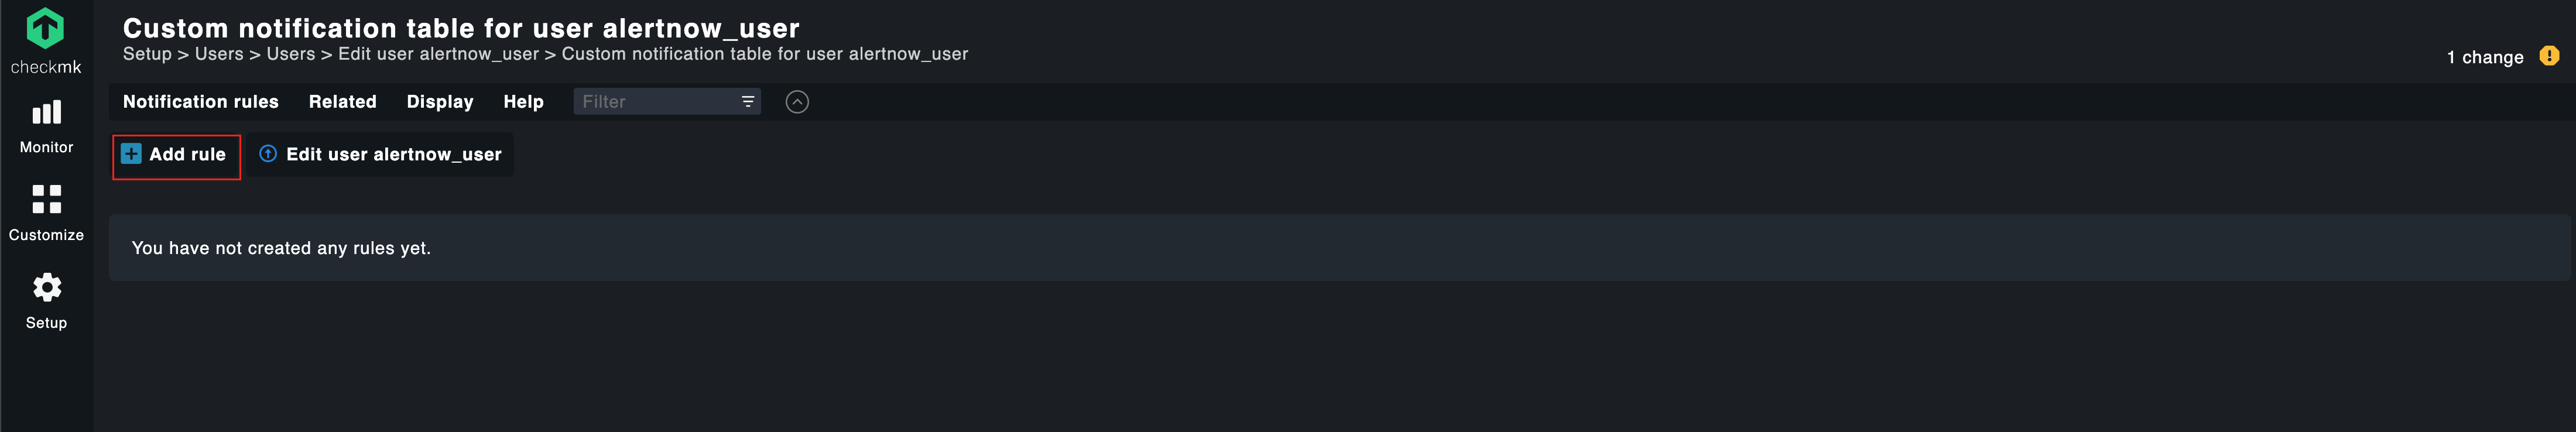
⑧ If the CheckMK plugin is properly installed, you can select the [AlertNow] from the Notification Method.
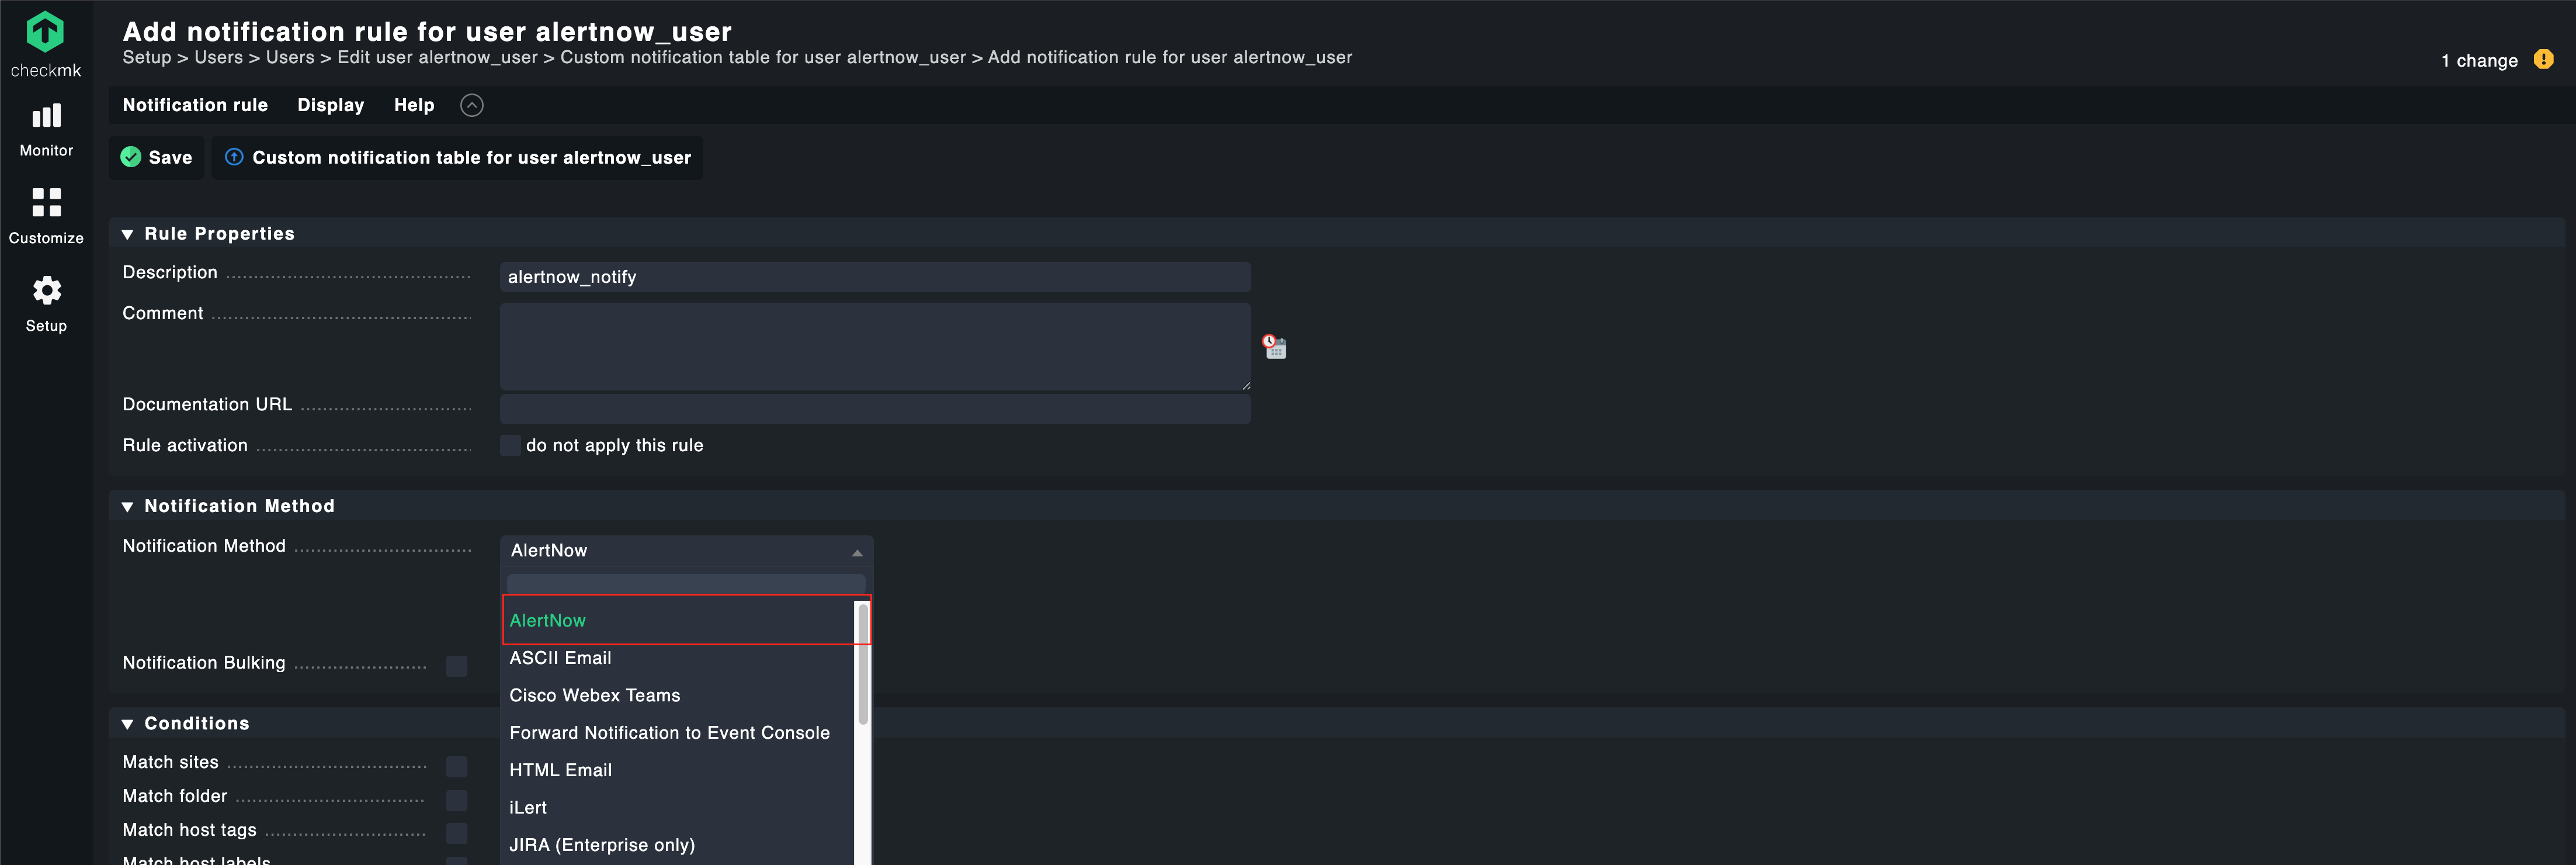
⑨ Select AlertNow as the Notification Method and choose [Call with the following parameters]. Paste the AlertNow URL into the first parameter box.
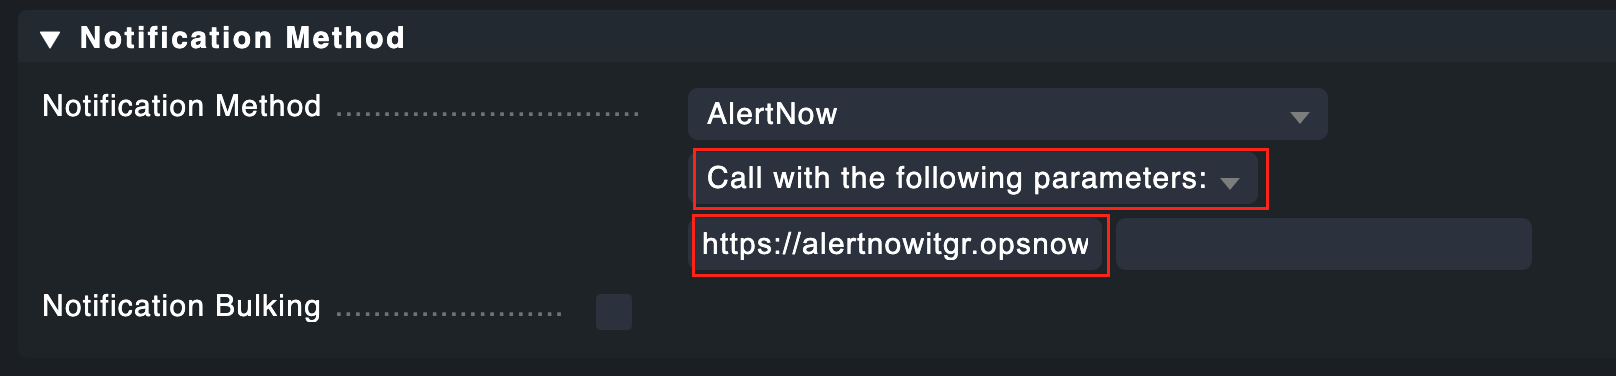
⑩ Go back to the user list, and click the [Changes] button. Click [Activate on selected sites] to save the changes. Now your CheckMK integration is configured.
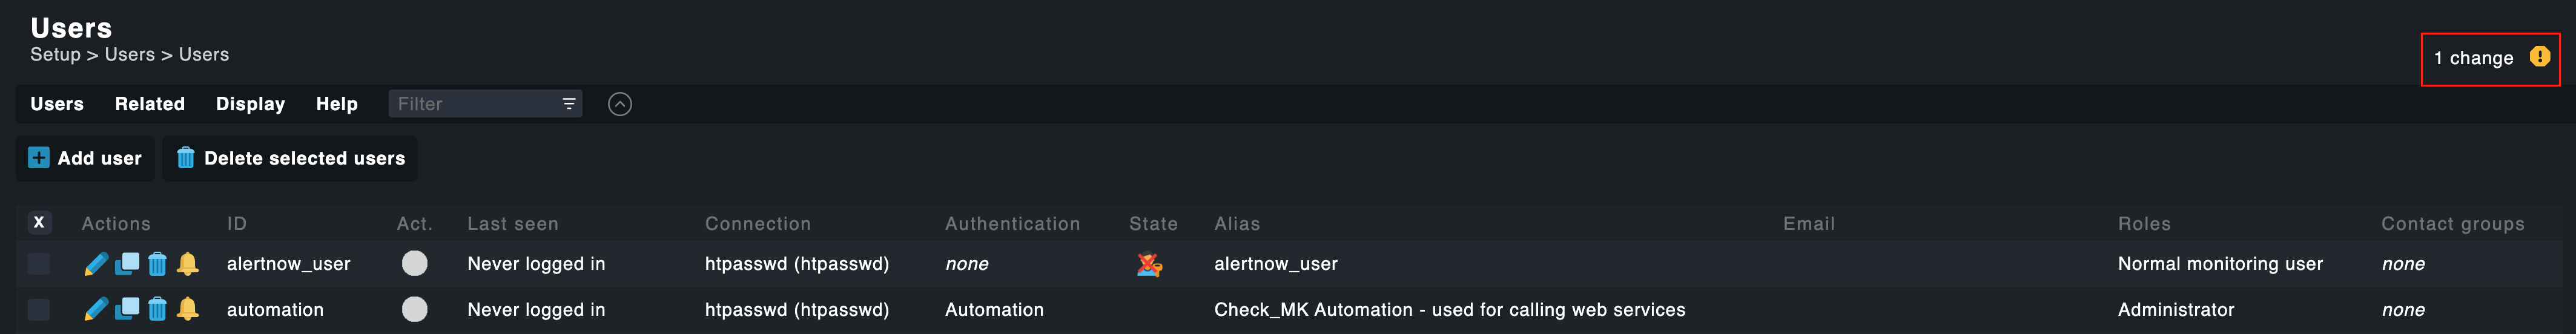
Note
① If Checkmk alerts are triggered but AlertNow fails to create incidents, check the notification logs about potential errors in /omd/sites/{site-name}/var/log/notify.log or request for help.
② AlertNow displays messages like PROBLEM, ACKNOWLEDGEMENT, and RECOVERY, but not FLAPPINGSTART, DOWNTIMESTART, or etc.
③ If HOST changes into DOWN→UP or SERVICE changes into OK, send the RECOVERY message and the incident will be closed automatically.
④ If you encounter Python ImportError: No module named requests error, install the Requests module to solve the issue as below.
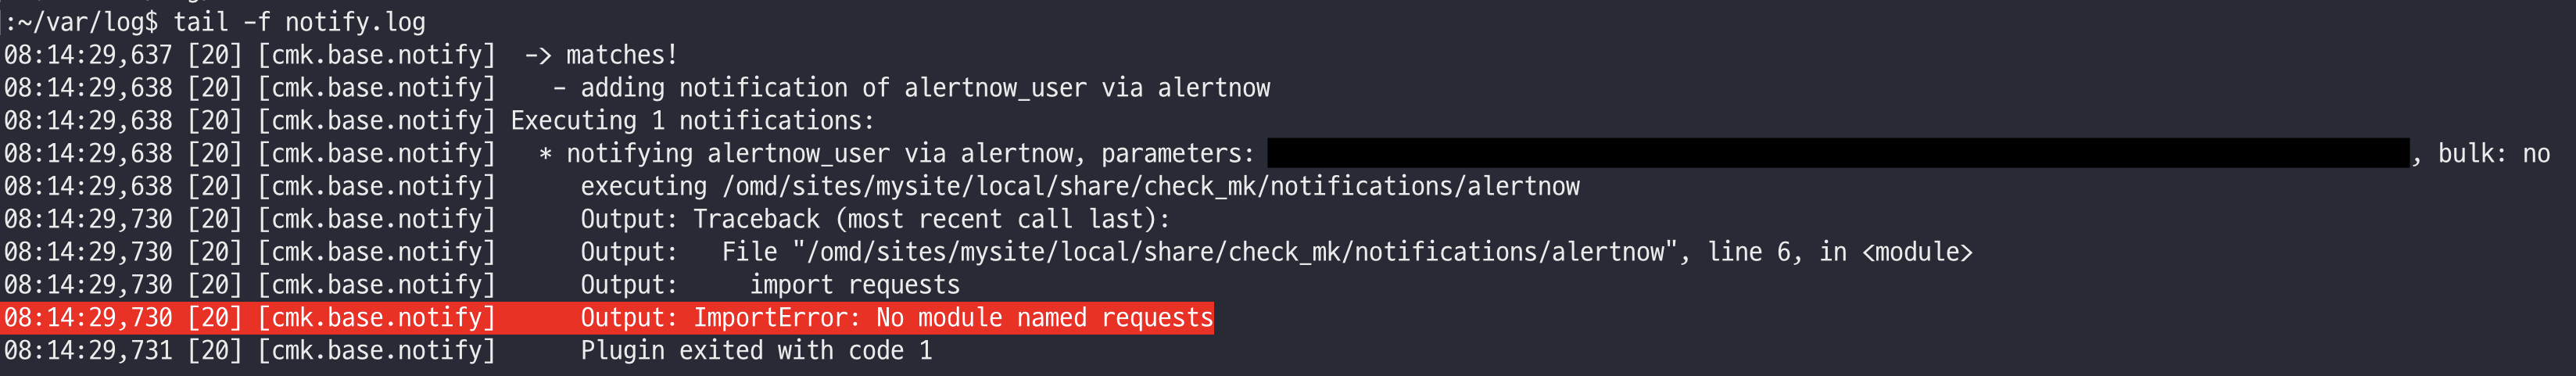
Jira Service Management
To integrate Jira Service Management with AlertNow, you need to set a webhook in the Jira Service Management console.
Click the [Create Integration] button on the top-left corner of the page, and select the [Jira Service Management] card.
![]()
In the Create integration page, enter the required information and then click the [OK] button to create the integration.
![]()
Select the checkbox of [Configure Jira Integration] in the Detailed Settings to fill in the required fields, and configure two-way communication in Configure incident events occurred from Jira Service Management.
![]()
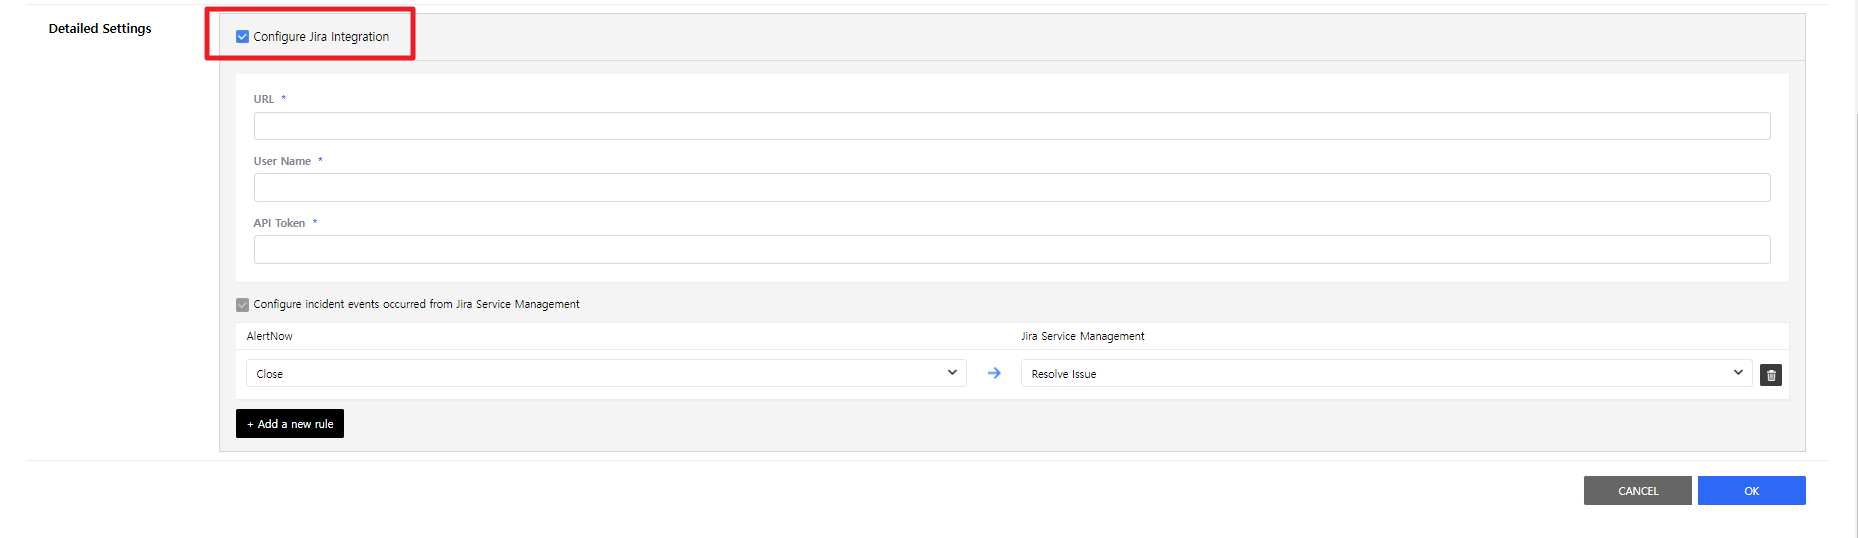
| Item | Description |
|---|---|
| URL | Copy and paste the webhook URL from the Jira console where you set up the webhook. |
| User Name | Enter an email address of the user. |
| API Token | Copy and paste the API token created in the Jira console. |
| AlertNow | Users can set event status in AlertNow, and the types are Assign, Acknowledge, Close, Add Comment, Modify Urgency, and Create Incident. |
| Jira Service Management | Users can set event status that can be matched with Jira Service Management, and the types are Resolve Issue, Add Issue Comment, In Progress, and Create Issue. |
👉 The integration with AlertNow will provide users with bidirectional sync between AlertNow and Jira, but currently available states are created and updated for Issue, and created for Comment in the Jira console.
Set Webhooks in Jira Console
① Sign in to the Jira Service Management console.
② Click [Settings] button on the top-right corner of the Jira console and select [System].
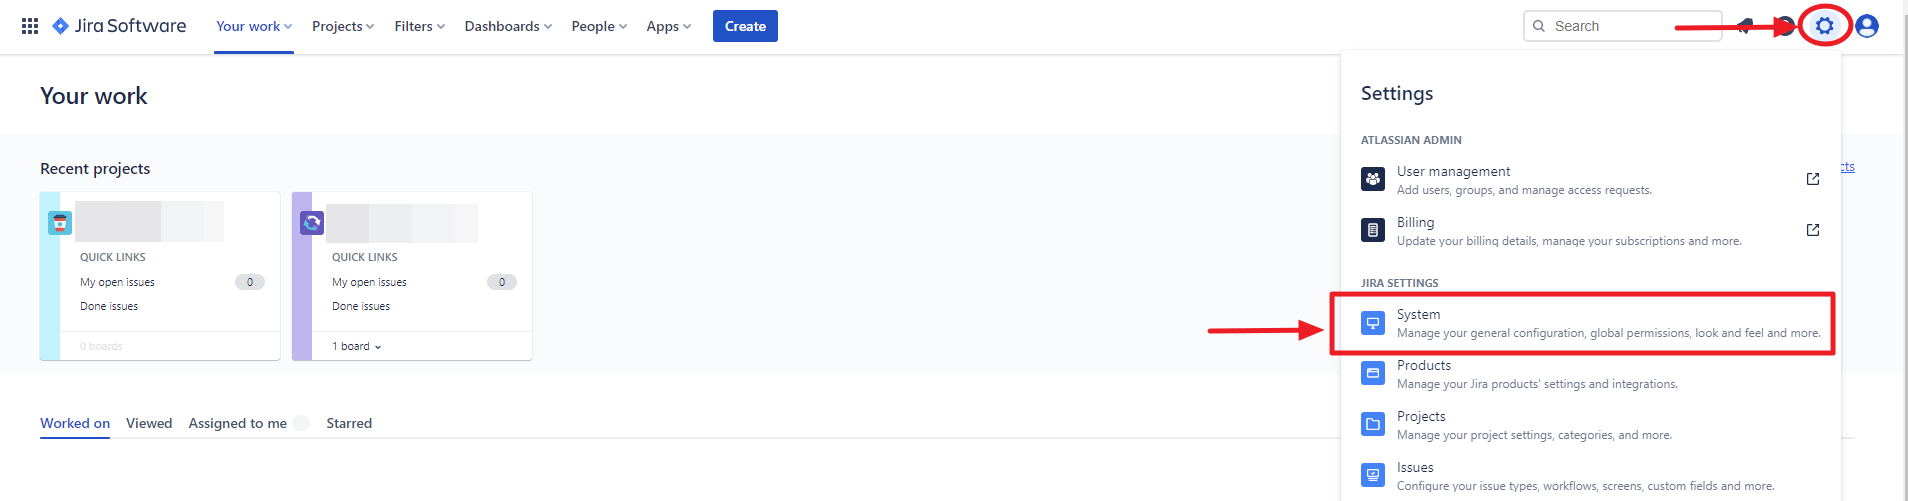
③ Scroll down to the bottom on the navigation bar on the left and select [Webhooks].
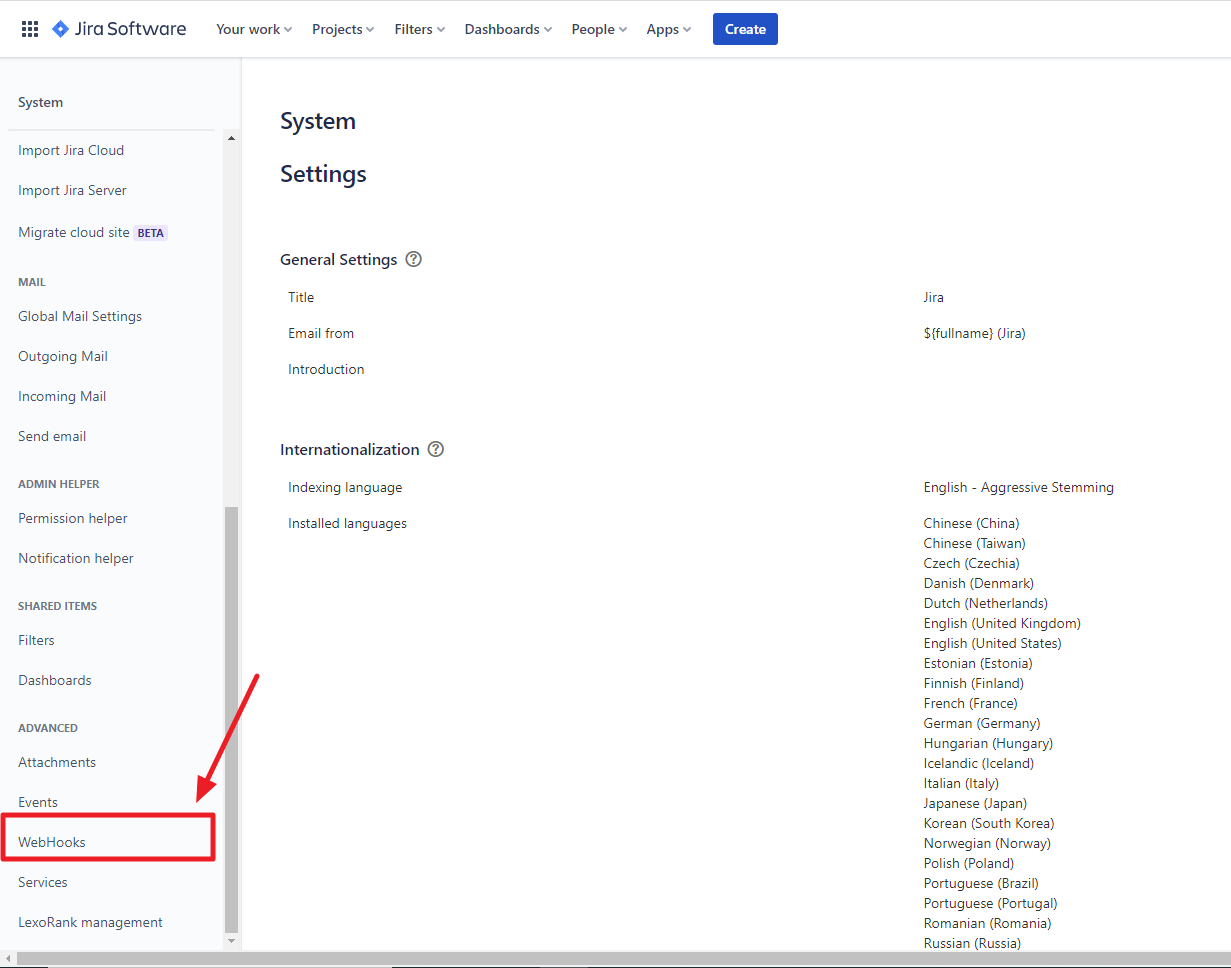
④ Enter the copied URL from AlertNow.
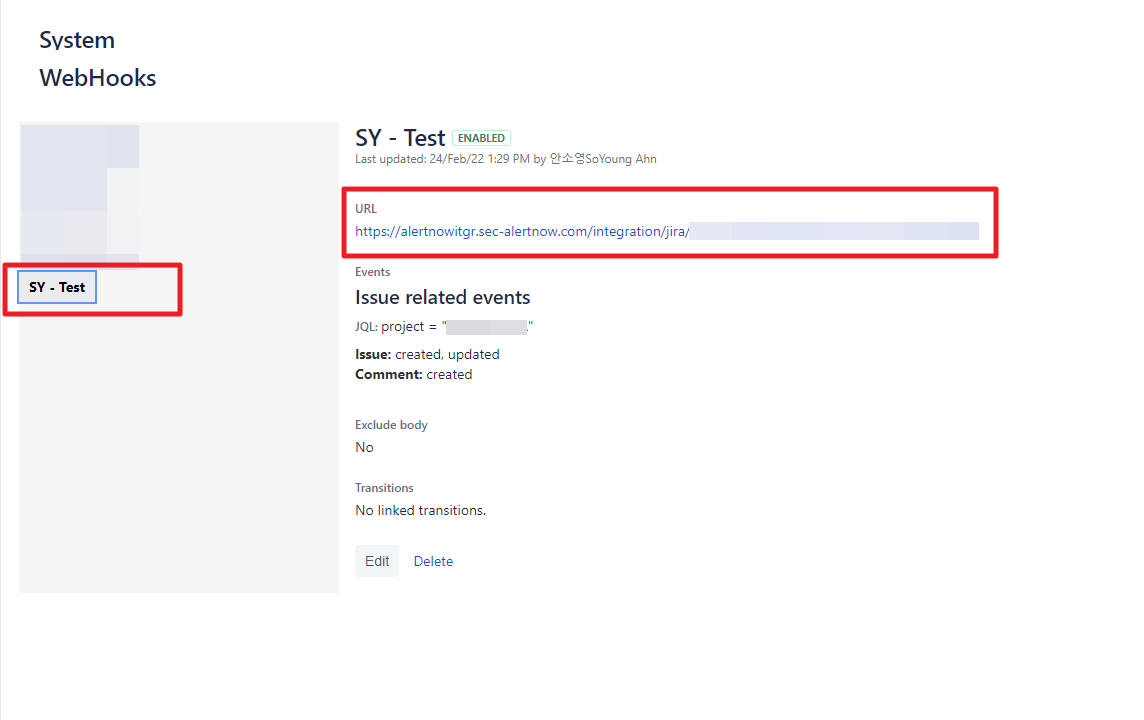
Create API Token in Jira Console
① To create an API token, click [Your profile and settings] on the top-right corner of the Jira console, and choose the [Account settings].
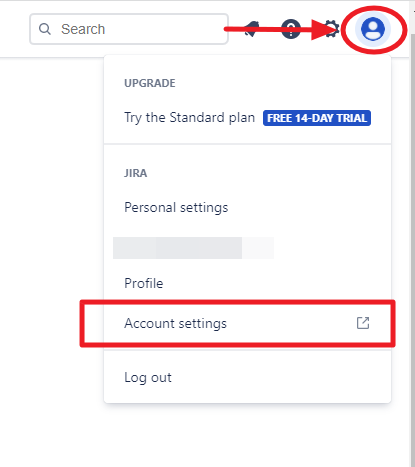
② In the navigation bar, select [Security] and then click [Create and manage API tokens].
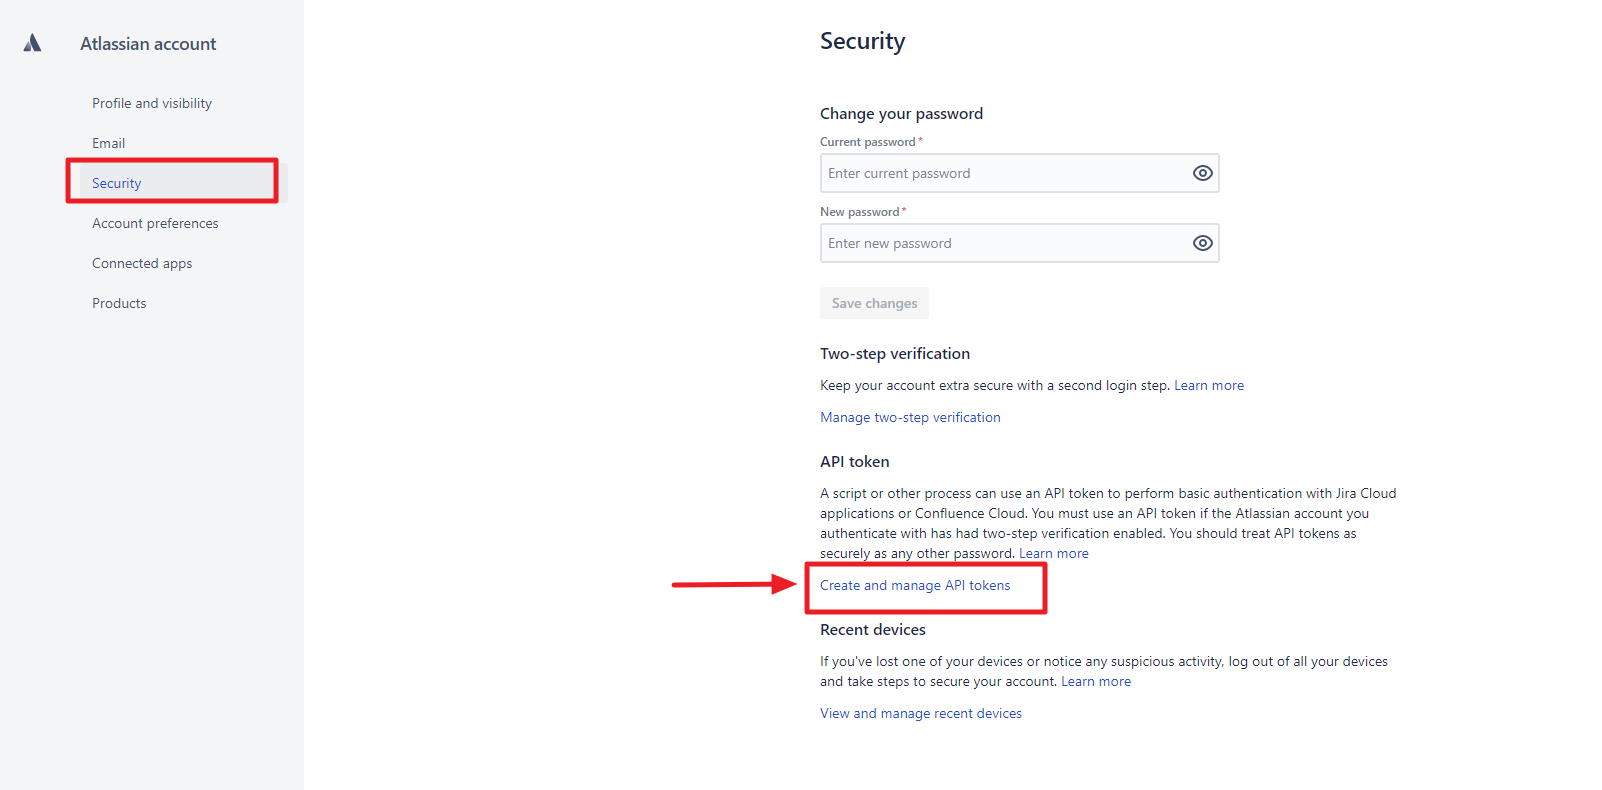
③ When you select [Create API token], the popup window appears. You can enter Label which is easy to remember for later use in the popup window. Then, an API token will be created. Copy the newly created token and go to AlertNow integration page for completing the integration process.
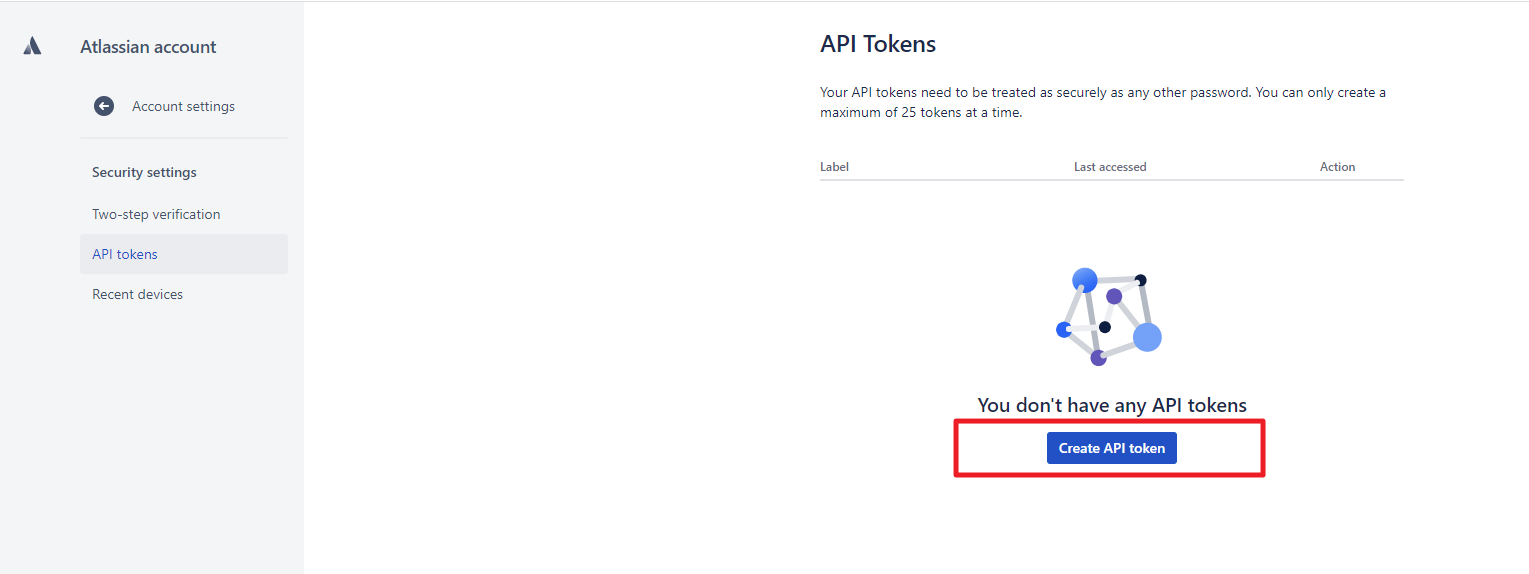
Freshdesk
To integrate Freshdesk with AlertNow, you need to set webhooks for Ticket Creation and Ticket Updates respectively in the Freshdesk console.
Click the [Create Integration] button on the top-left corner of the page, and select the [Freshdesk] card.
![]()
In the Create integration page, enter the required information and then click the [OK] button to create the integration.
![]()
Select the checkbox of [Configure Fresh Integration] in the Detailed Settings to fill in the required fields, and configure two-way communication in Configure incident events occurred from Freshdesk.
![]()
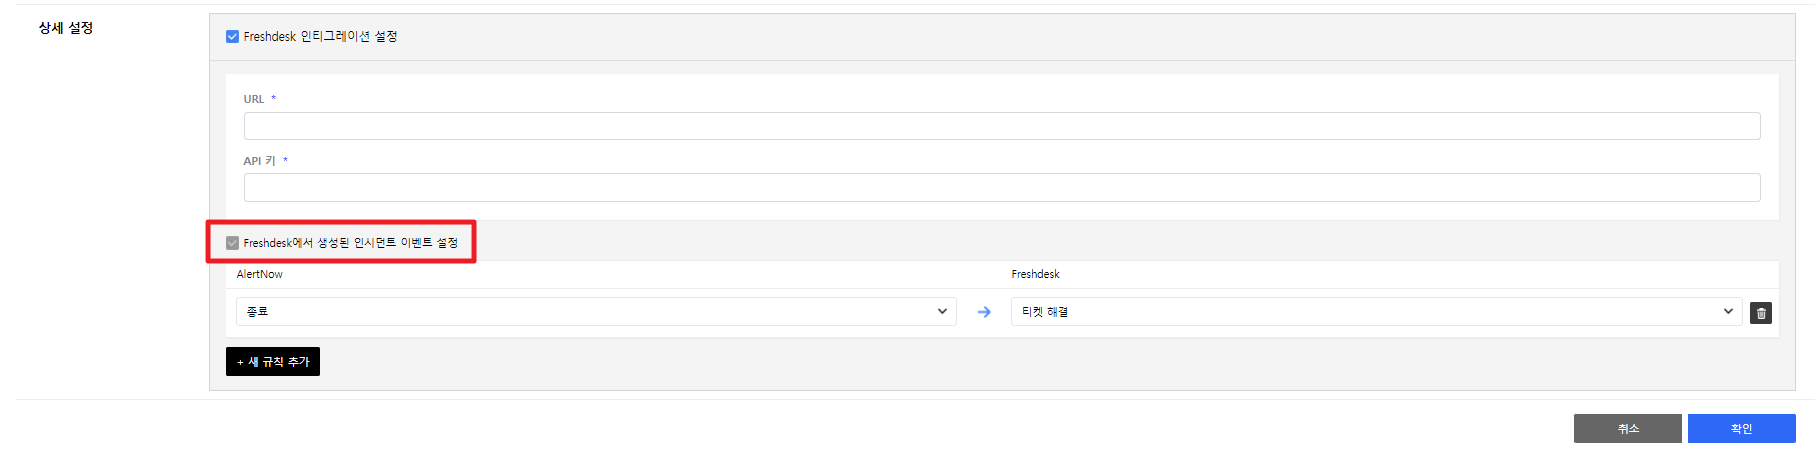
Register a Webhook for Ticket Creation
① Sign in to the Freshdesk console. Select Admin -> Workflows -> Automations in the navigation bar.
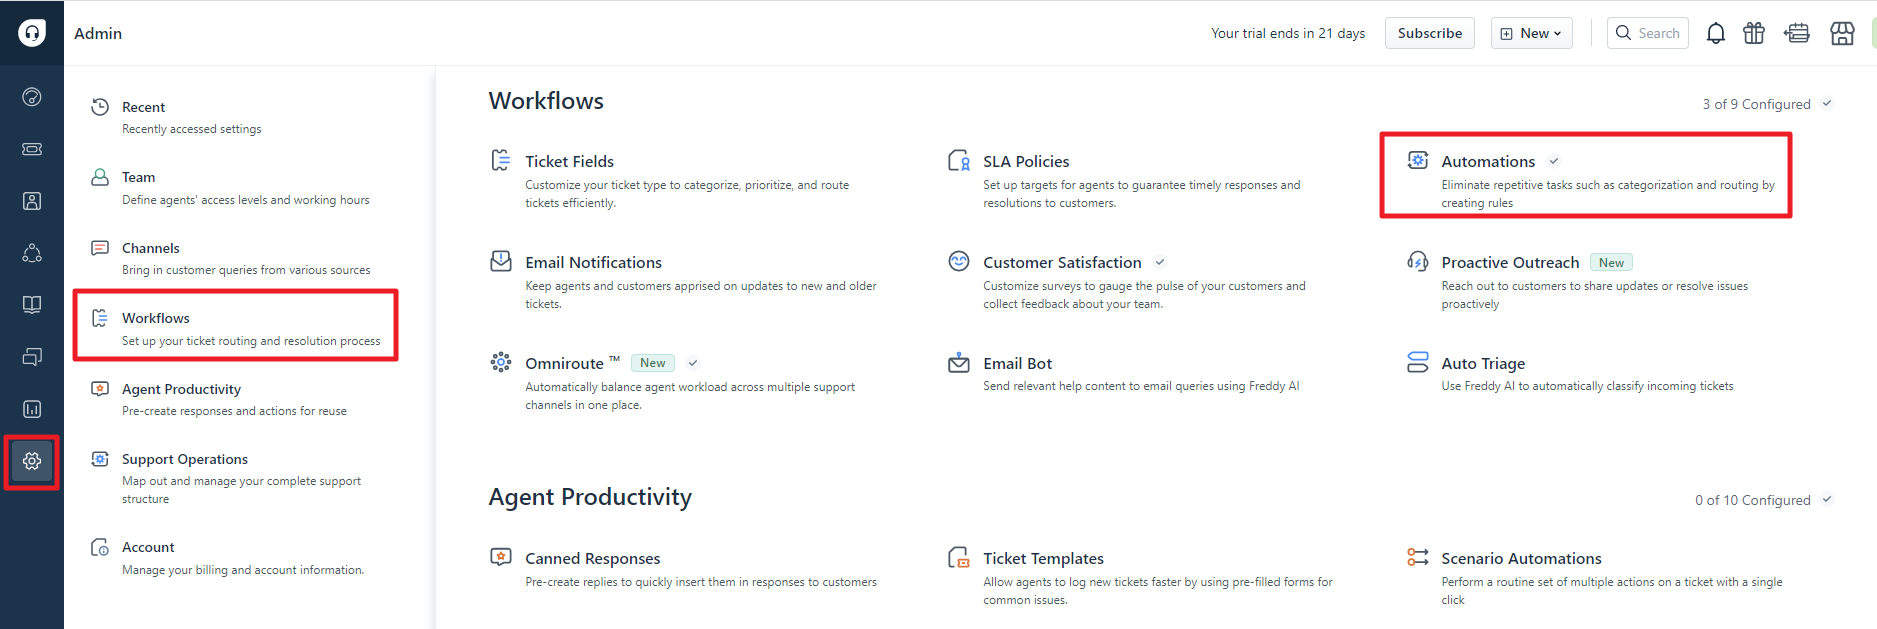
② Click Ticket Creation -> New Rule in the Ticket Creation page.
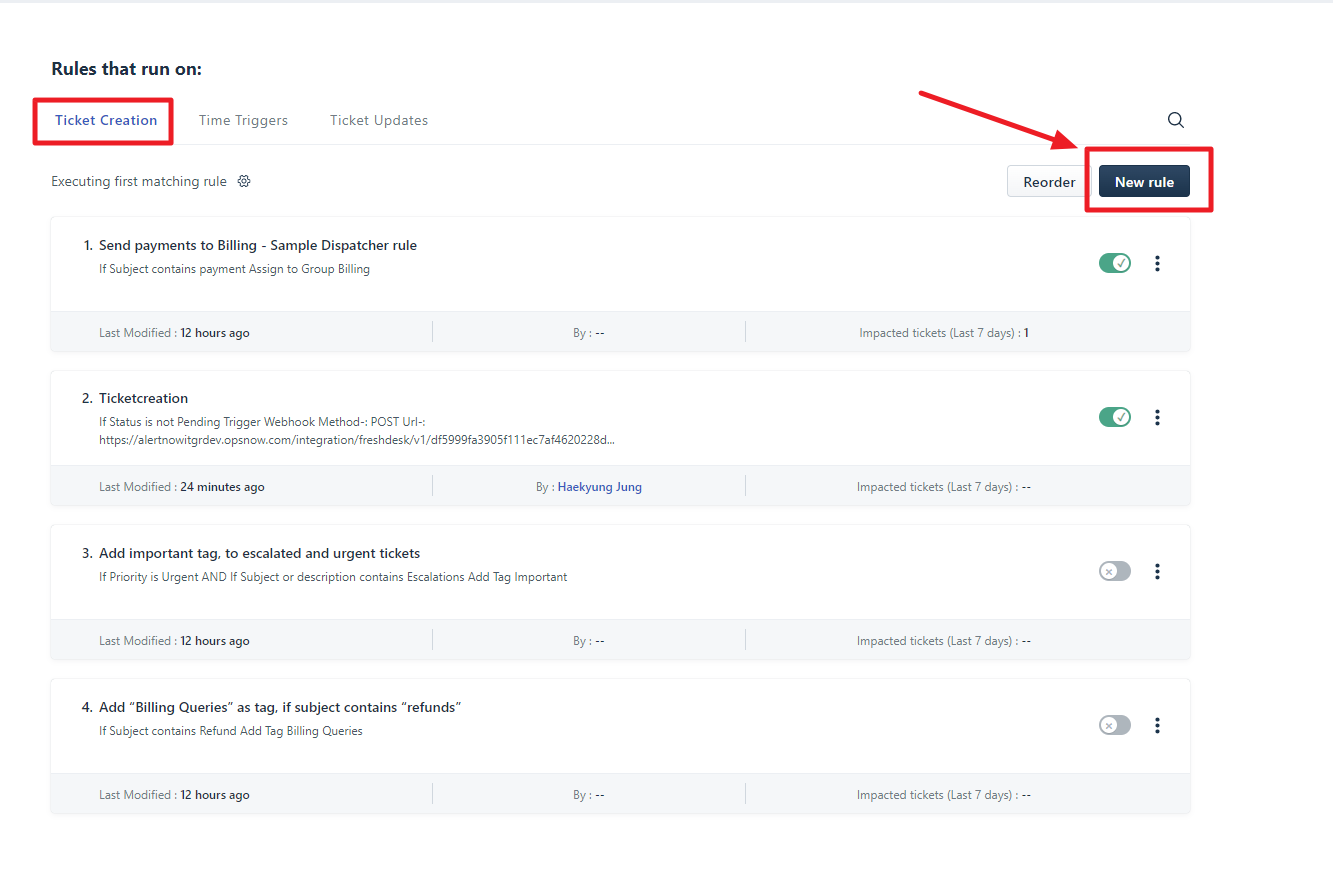
③ Complete all required fields, and choose [Perform these actions] section. Select Trigger webhook in the Choose action field and Post in the Request type field, and enter AlertNow URL in the URL field. Choose Simple in Content to add required items like Ticket ID, Subject, and Ticket URL.
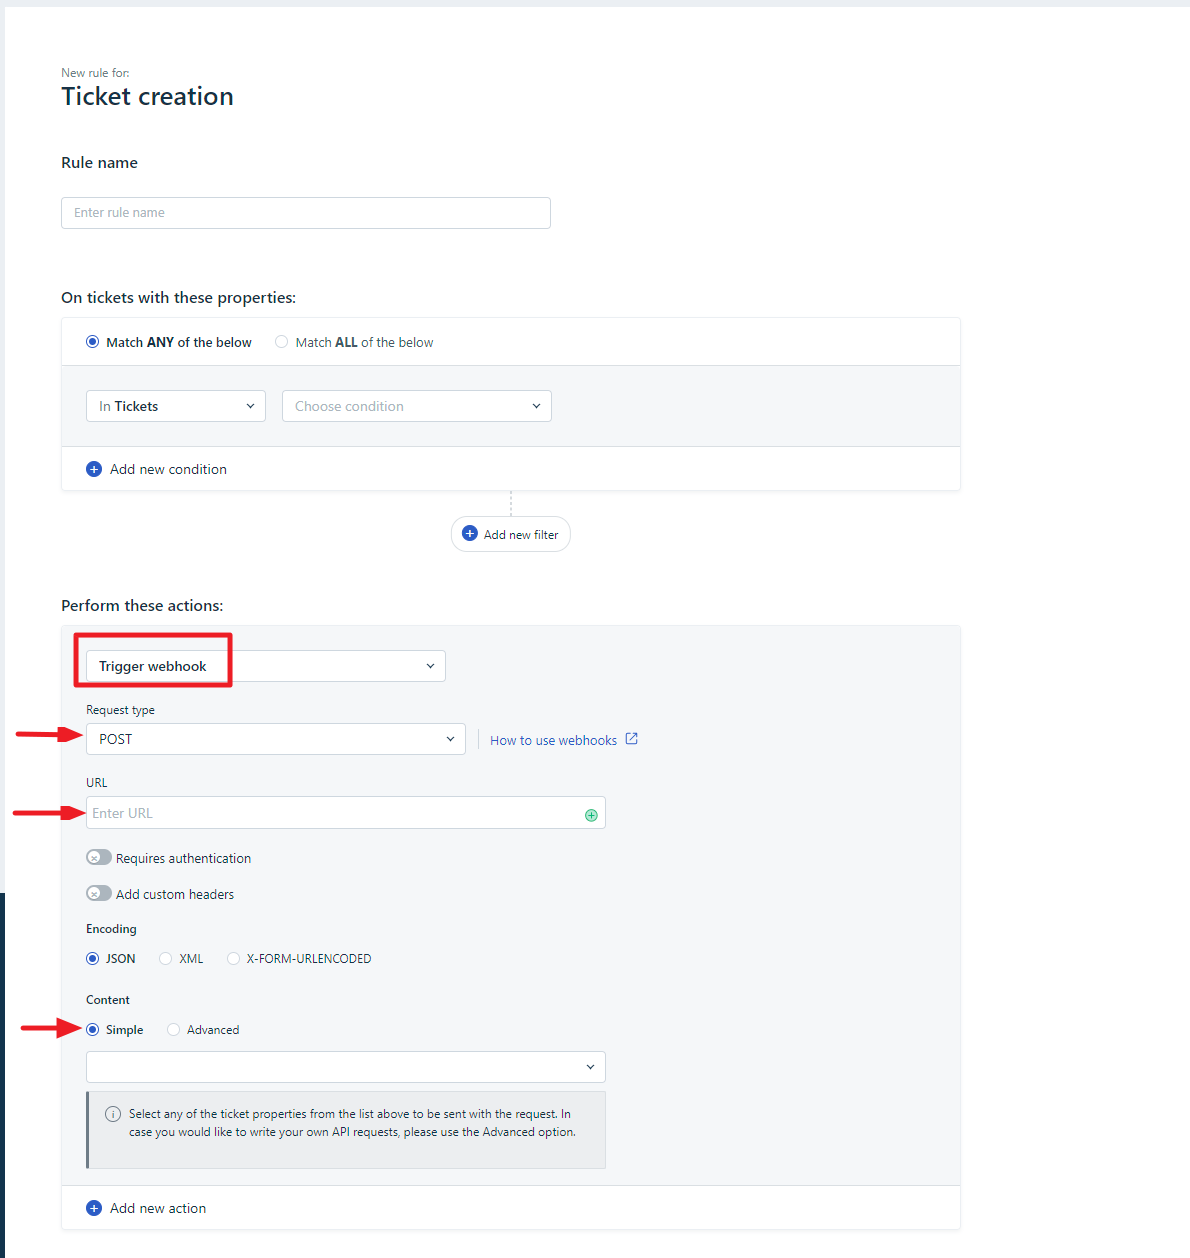
④ Review all required fields and click [Preview and save].
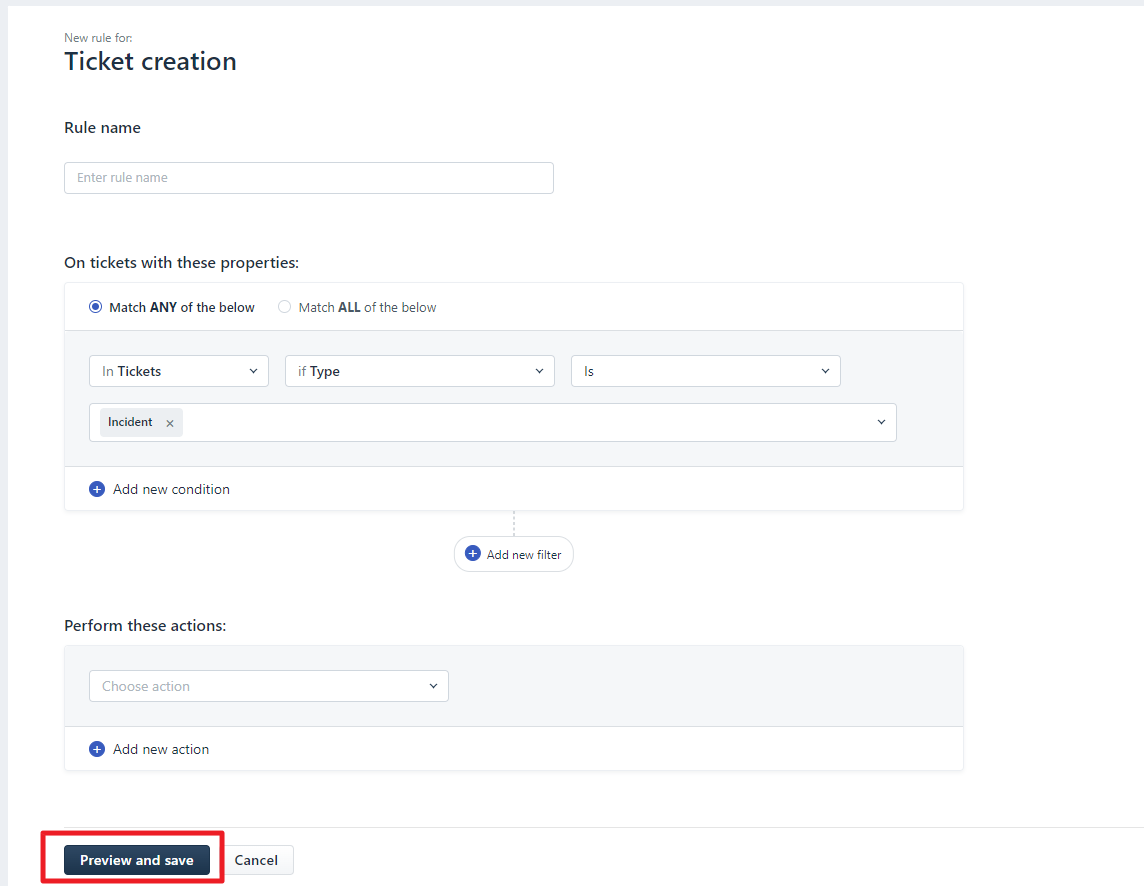
⑤ In the popup window, click [Save and enable] to complete registering a webhook.
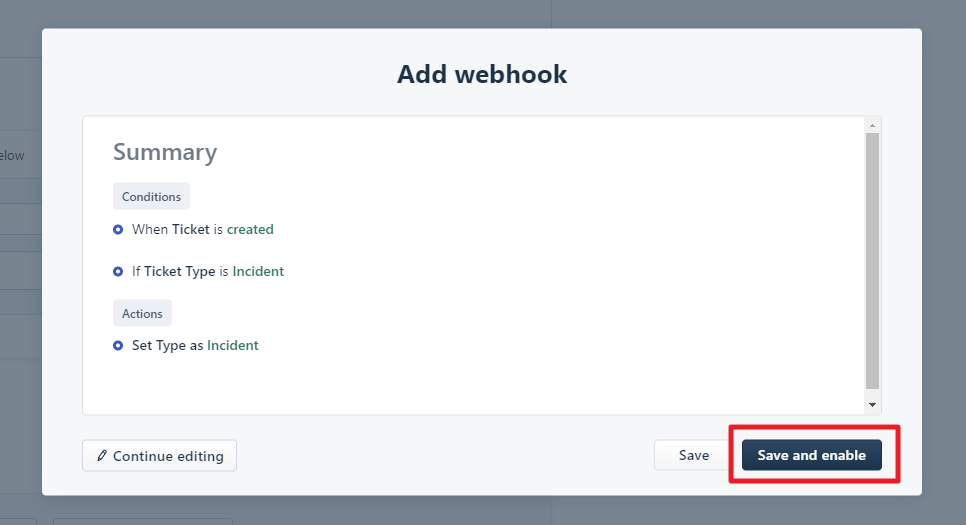
Register a Webhook for Ticket Updates
① Sign in to the Freshdesk console. Select Admin -> Workflows -> Automations in the navigation bar.
② Click Ticket Updates -> New Rule in the Ticket Updates page.
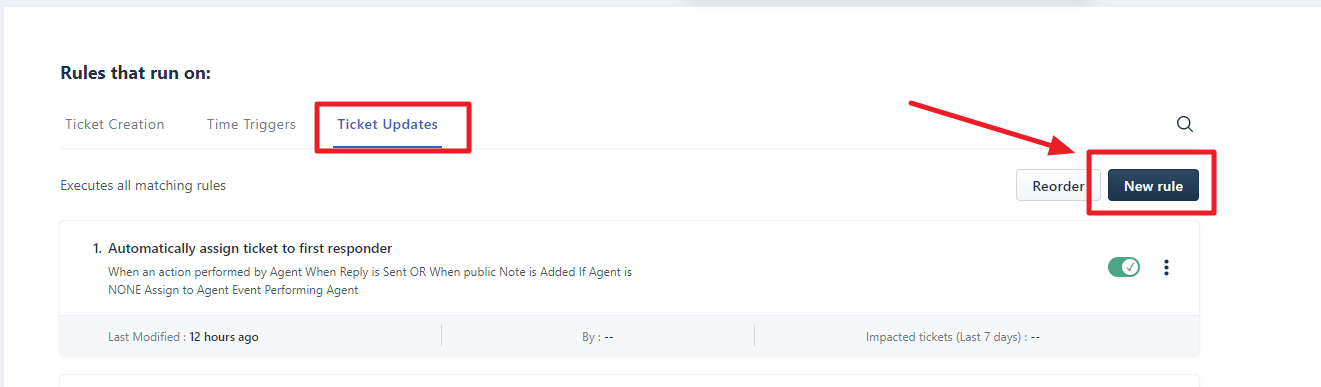
③ Complete all required fields and click [Preview and save].
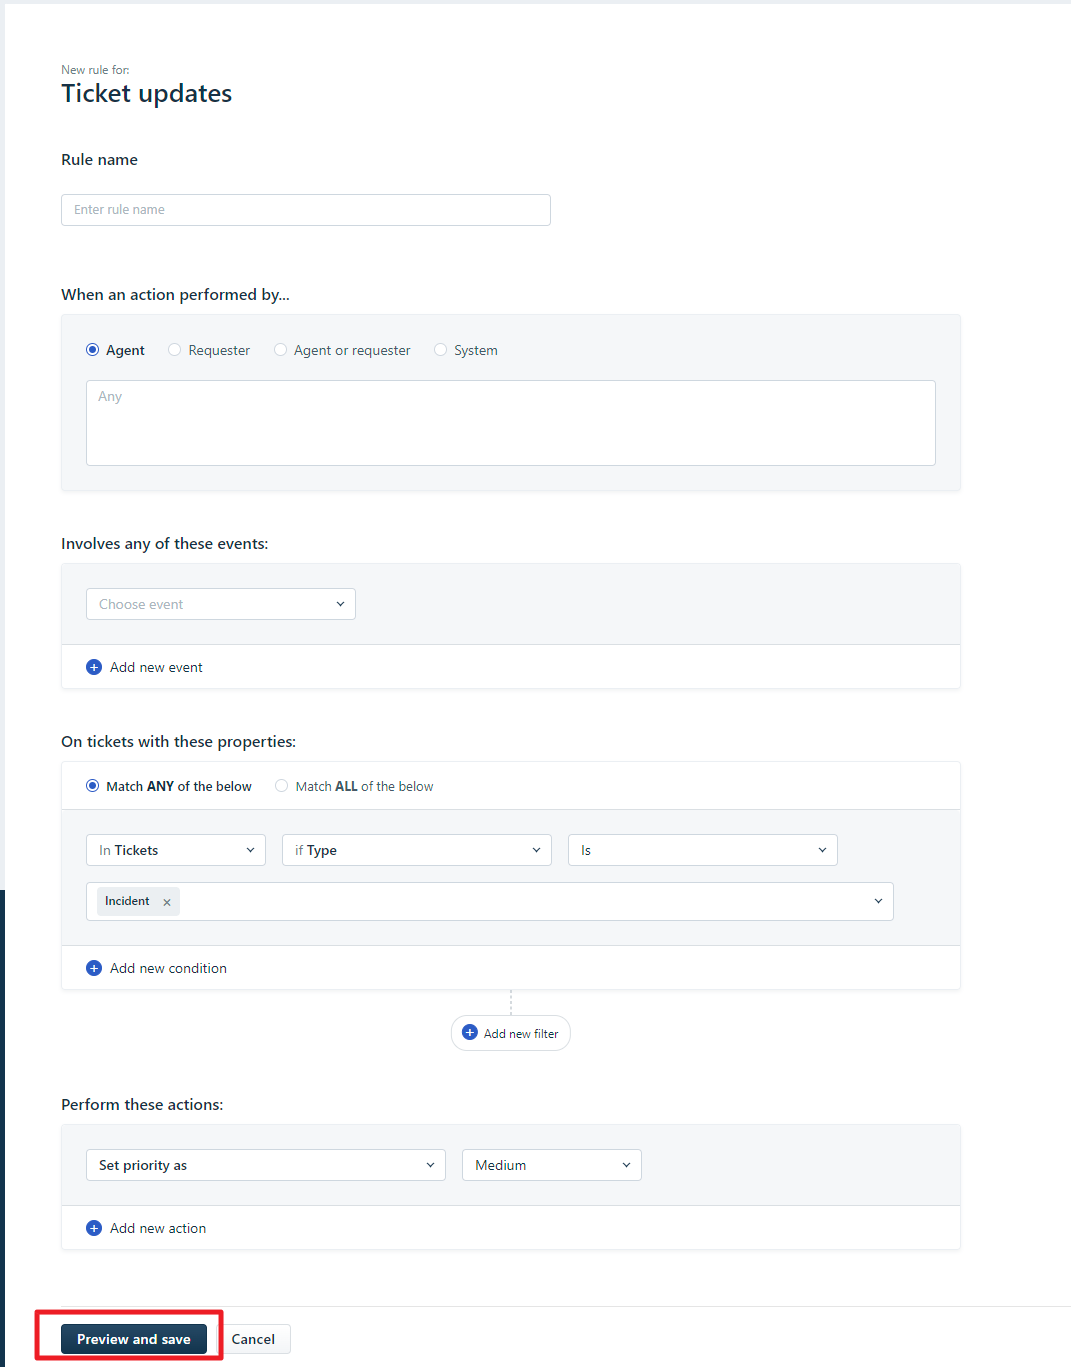
④ In the popup window, click [Save and enable] to complete registering a webhook.
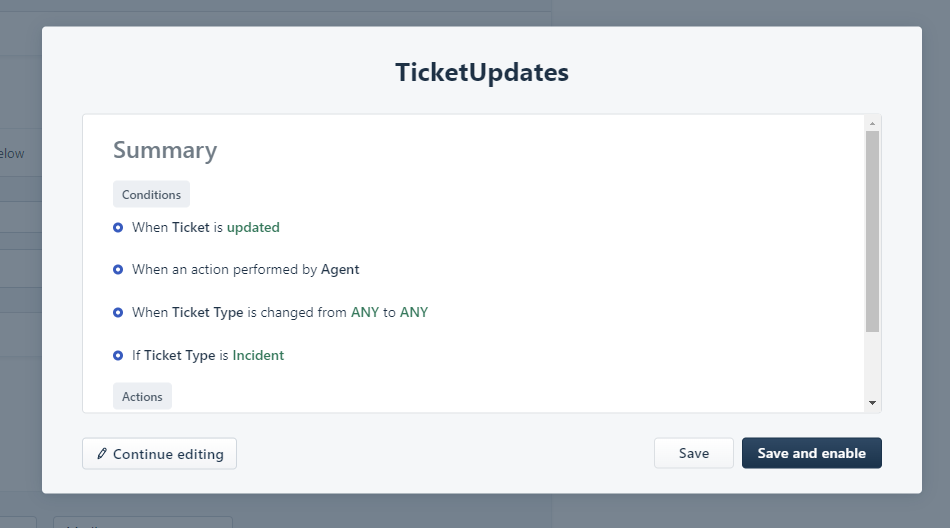
Amazon EventBridge
To integrate Amazon EventBridge with AlertNow, you need to create SNS Topics and Rules in the Amazon console.
Click the [Create Integration] button located on the top-left side, and select the [Amazon EventBridge] card.
![]()
In the Create Integration page, enter the required information and then click the [OK] button.
![]()
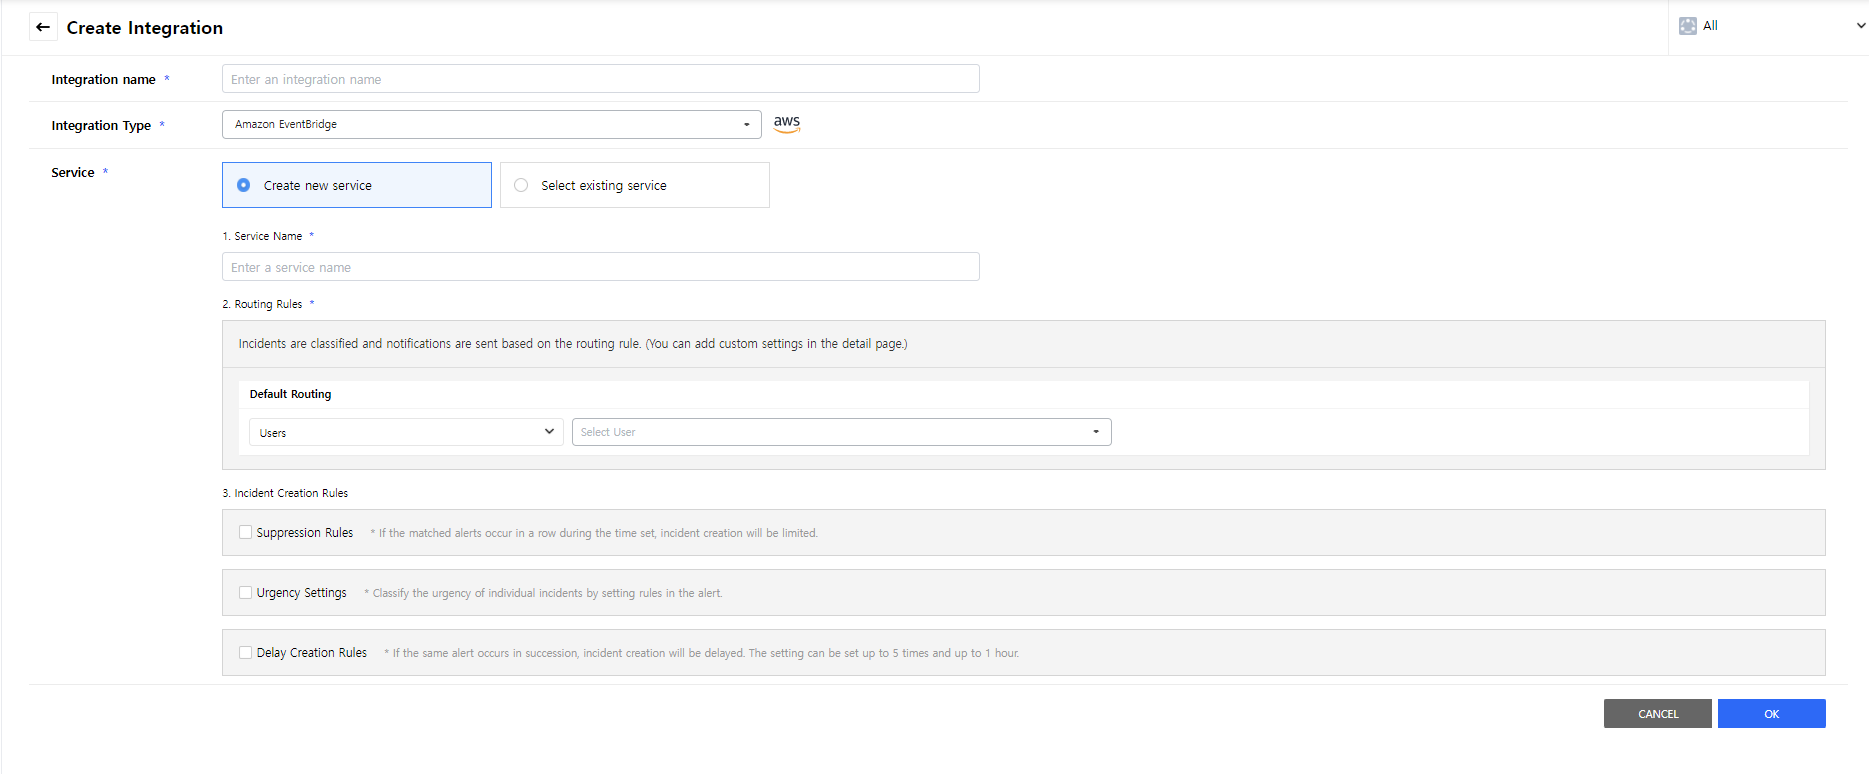
Create Amazon SNS and Subscription
Create a Topic and Subscription in the Amazon SNS dashboard to integrate Amazon EventBridge.
⑴ Create SNS Topic
① Sign in to the Amazon SNS console and type SNS in the search field, and select Simple Notification Service.
② On the Topics page, choose the [Create topic].
③ Enter the required information and click the [Create topic] button.
The table below provides descriptions for each item.
| Item | Description |
|---|---|
| Topic Name | It is a communication channel to send messages and subscribe notifications and used to create an ARN for later created Topics. Maximum 256 characters. Can include alphanumeric characters, hyphens (-) and underscores (_). * For example, CreateSNSTopicTest: ‘arn:aws:sns:us-west-2:111122223333:CreateSNSTopicTest’ |
| Display Name | It is the name displayed for your topic when subscribing to SNS. |
⑵ Create an Amazon SNS Subscription
① Select [Create subscription] located on the top-right of the page.
② Enter Topic ARN, Protocol, and Endpoint, and click the [Create Subscription] button to complete creating the subscription.
The table below provides descriptions for each item.
| Item | Description | Remark |
|---|---|---|
| Topic ARN | The name of Topic ARN is automatically reflected based on your Topic Name. | Can be edited |
| Protocol | Choose HTTPS for your topic to receive messages. | |
| Endpoint | Copy and paste the URL from AlertNow. | Can be edited |
⑶ Confirm SNS Subscription
① The subscription is being created.
② Click the [Request confirmation] button on at the upper right. Approval confirmation is made for the Subscription ID.
Create an Amazon EventBridge Rule
① Select Amazon EventBridge -> Rule -> Create Rule.
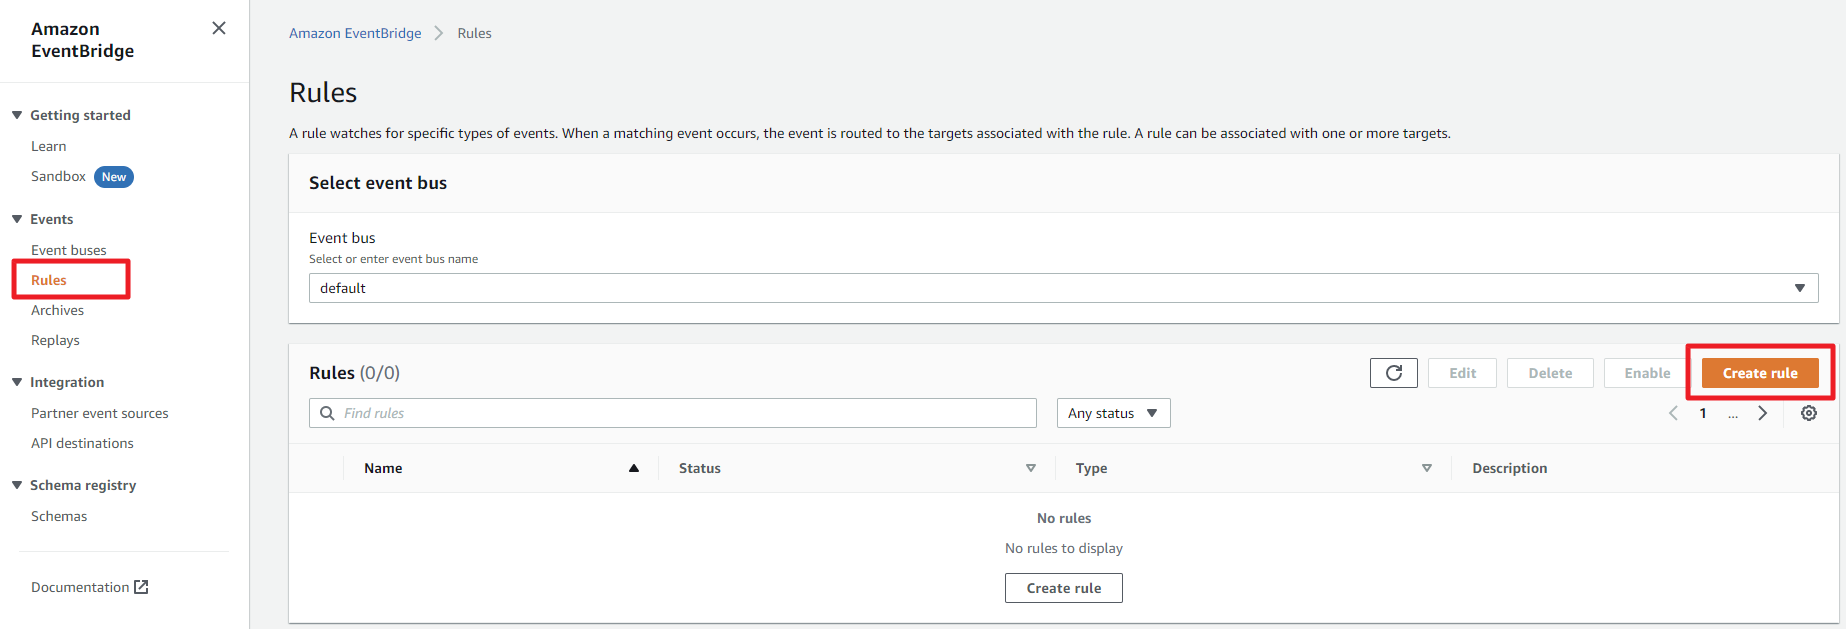
② Enter a rule name and description in the Details page. Choose Rule with event pattern and then click the [Next] button.
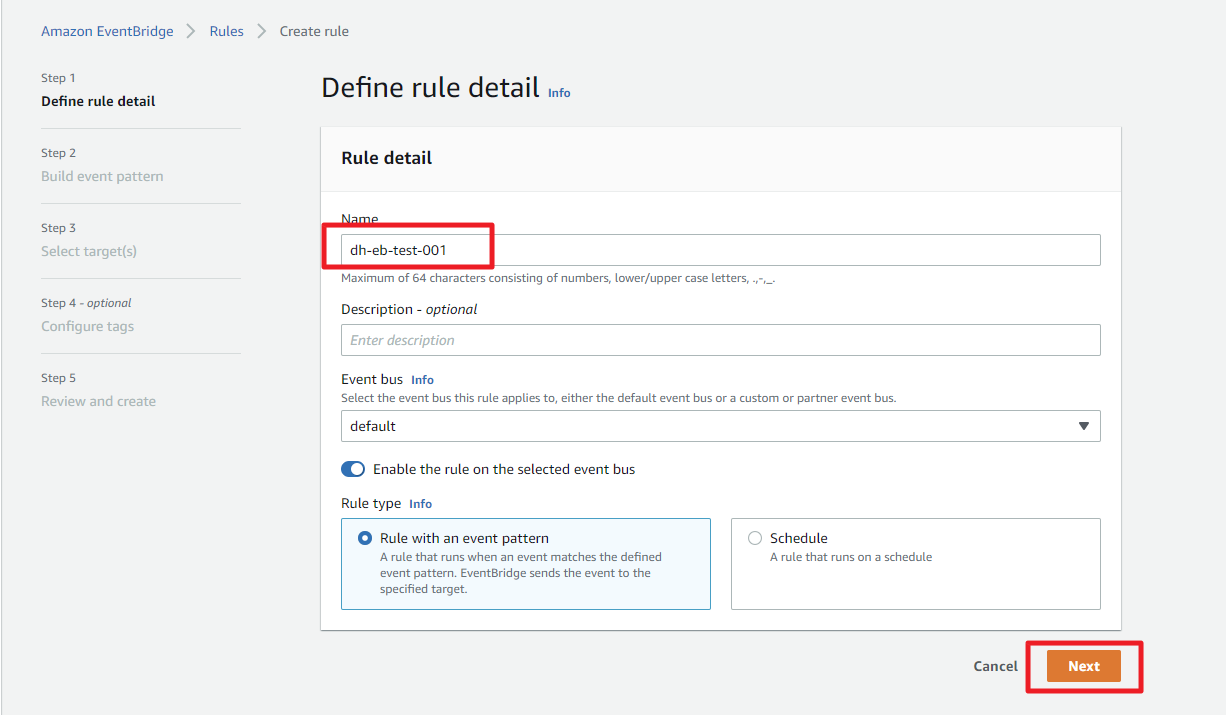
③ Choose AWS Service as event source and then click the [Next] button.
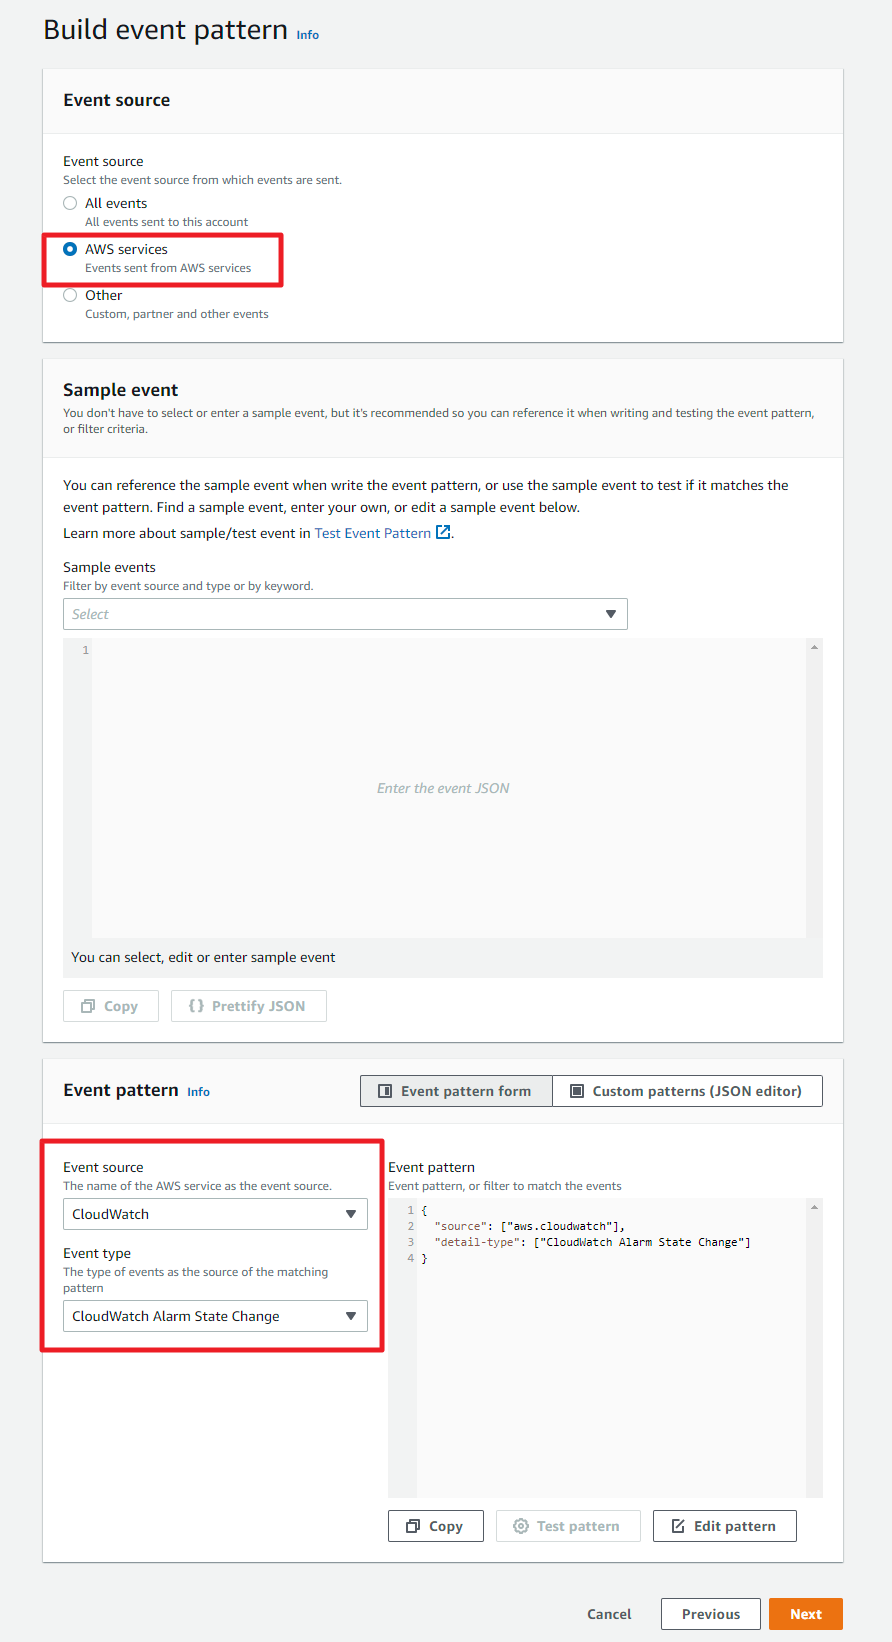
👉 AlertNow allows all events received via Amazon EventBridge to be created as incident, however, for CloudWatch Alarm State Change, automatic termination of the incident is provided.
④ Choose AWS Service as target type, and choose the drop-down list and click [SNS Topics].
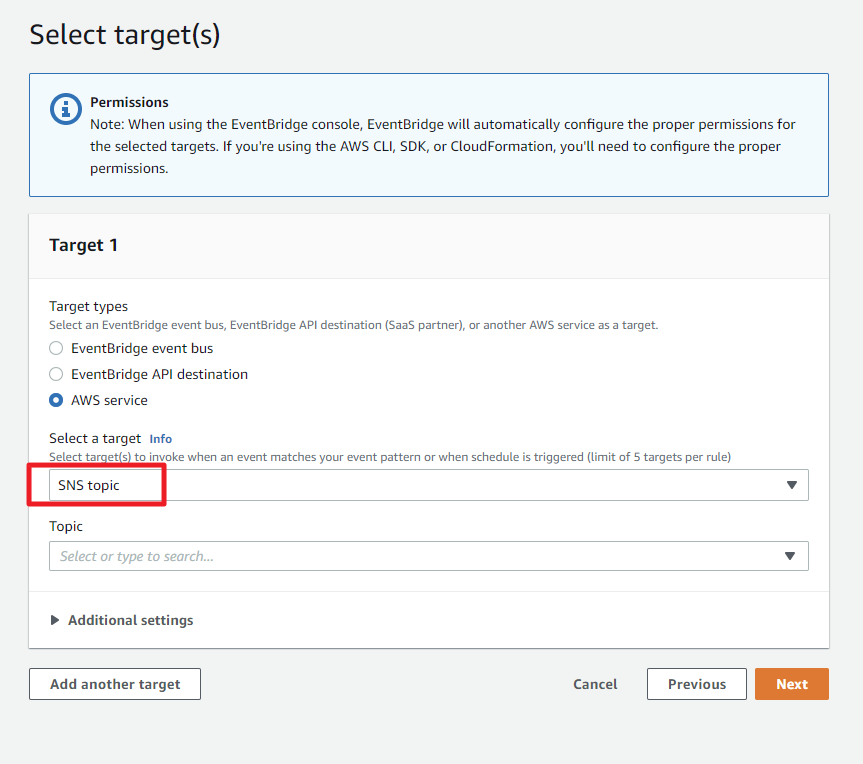
⑤ Tag is optional. You can assign tags to AWS resources. Review the information you entered in the Review and creation page, and click [Create Rule] to complete creating the rule.
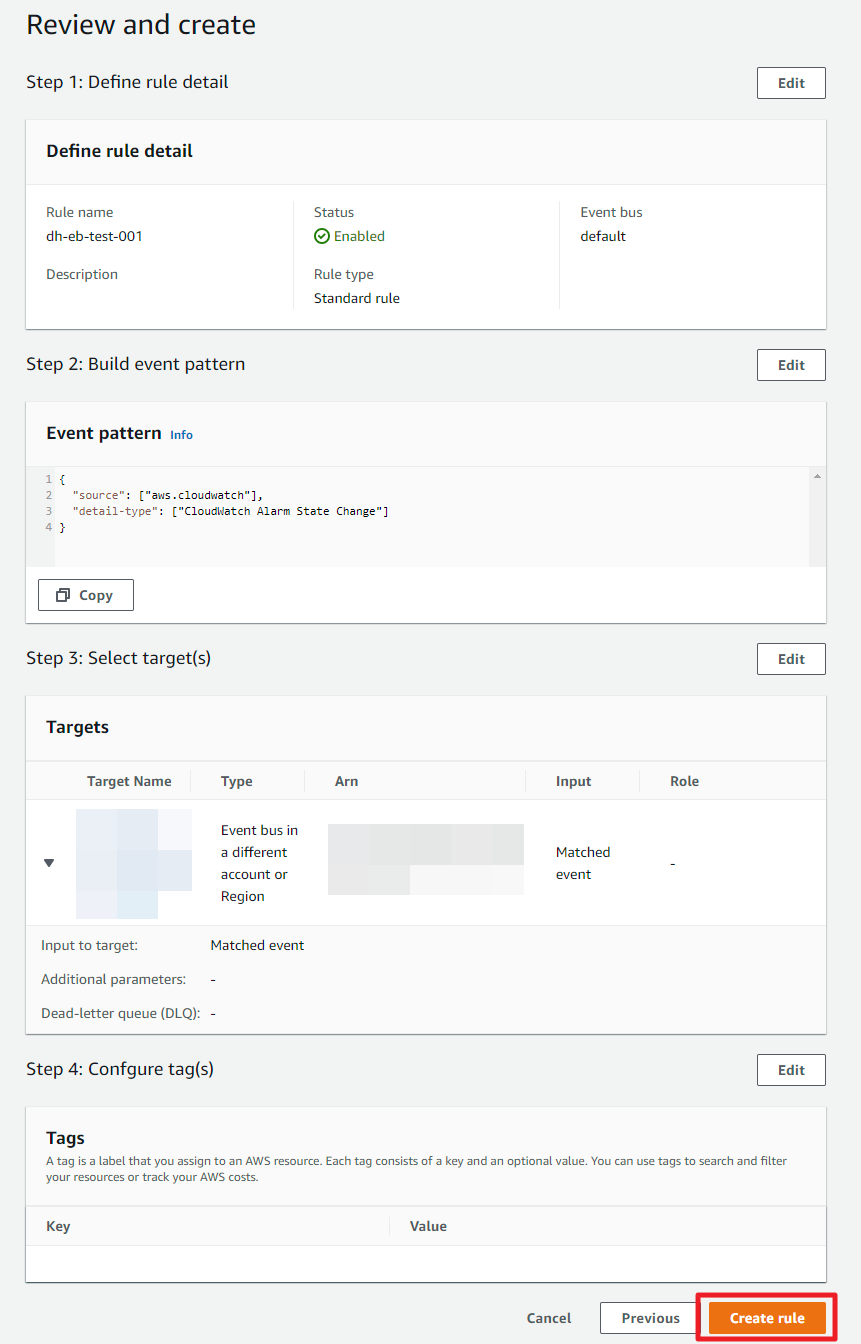
OpsNow
To integrate OpsNow with AlertNow, you need to set the configuration as below.
Click the [Create Integration] button located on the top-left side, and select the [OpsNow] card.
![]()
In the Create integration page, enter the required information and then click the [OK] button to create the integration.
![]()
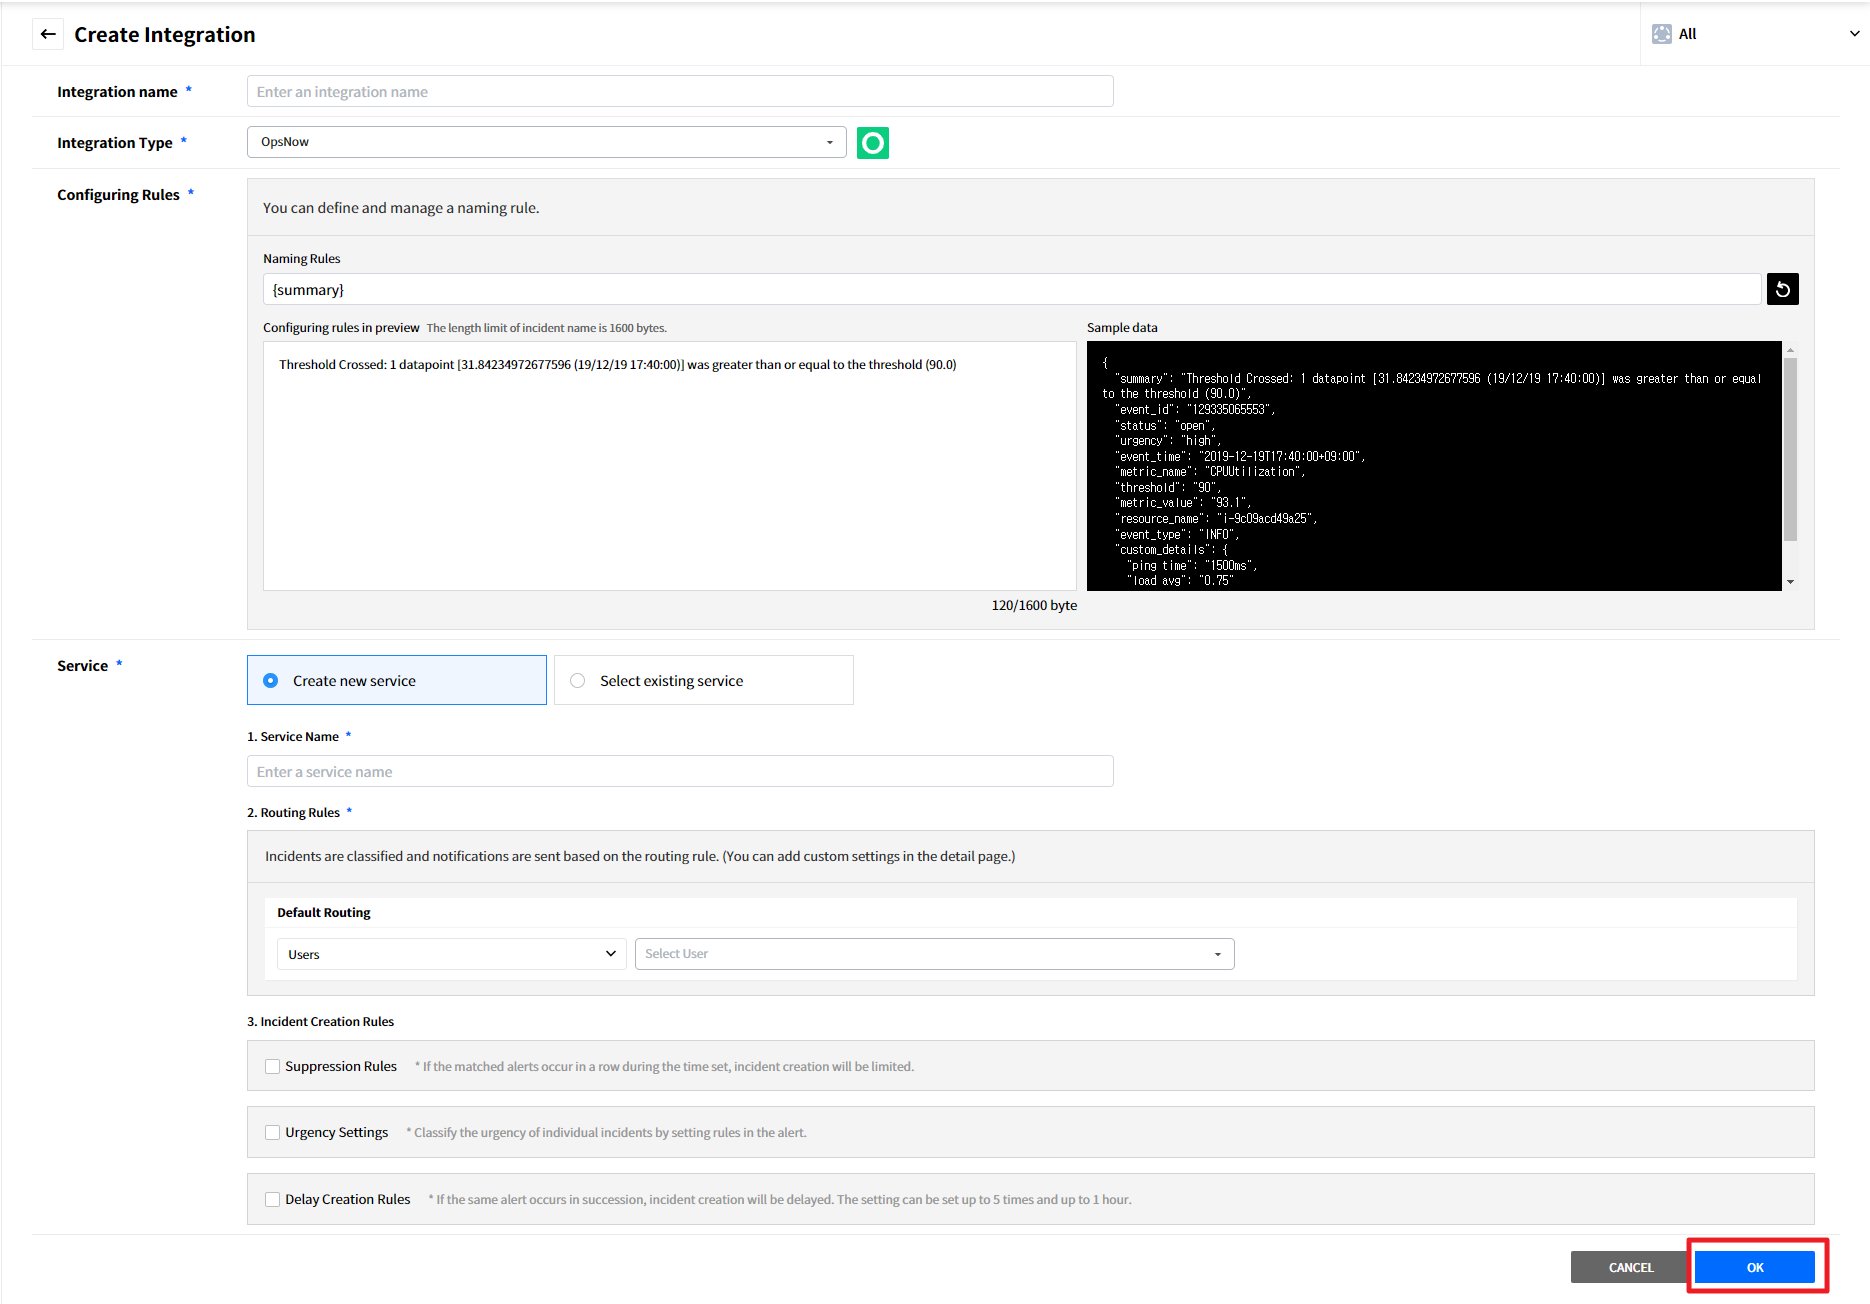
Calling REST APIs
Call a REST API with the API Key created in AlertNow. Information required to call a REST API are:
About OpsNow Integration Call
URL: https://{DOMAIN}/integration/opsnow/v1/{APIKEY}
Method: POST
Content-Type: application/json
Body: Refer to the following tableMessage Spec
| Field | Name | Data Type | Mandatory | Description | Default Value | Example |
|---|---|---|---|---|---|---|
| summary | Summary info | String | Required | Information that lets you identify the content of the event | Threshold Crossed: 1 datapoint [31.84234972677596 (19/12/19 17:40:00)] was greater than or equal to the threshold (90.0) | |
| event_id | Event ID | String | Optional | If event_id data does not exist, it will be automatically set (However, if status is ack or close, it is required) |
UUID | 129335065553 |
| status | Status info | String | Optional | Field indicating the status of the event Valid values: - open: event creation - ack: event confirmation - close: event end |
open | open |
| urgency | Urgency | String | Optional | Field indicating the degree of influence on system or the urgency of the event related to the priority Valid values: - highest - high - medium - low - lowest - none |
none | high |
| event_time | Occurred | String | Optional | Time at which an event occurred Timestamp (ISO 8601) data type |
Current timestamp | 2019-12-19T17:40:00+09:00 |
| metric_name | Metric name | String | Optional | Information that lets you identify a metric type | CPUUtilization | |
| threshold | Threshold | String | Optional | Metric threshold | 90 | |
| metric_value | Metric value | String | Optional | Measured value of metric | 93.1 | |
| resource_name | Resource name | String | Optional | Information that you can identify such as the host name of the system on which event occurred | i-9c09acd49a25 | |
| event_type | Event type | String | Optional | Information that lets you identify an event type | INFO | |
| custom_details | Details | JSON | Optional | More information field | { “ping time”: “1500ms”, “load avg”: 0.75 } |
- Payload Sample
                    {
                        "summary": "Threshold Crossed: 1 datapoint [31.84234972677596 (19/12/19 17:40:00)] was greater than or equal to the threshold (90.0)",
                        "event_id": "129335065553",
                        "status": "open",
                        "urgency": "high",
                        "event_time": "2019-12-19T17:40:00+09:00",
                        "metric_name": "CPUUtilization",
                        "threshold": "90",
                        "metric_value": "93.1",
                        "resource_name": "i-9c09acd49a25",
                        "event_type": "INFO",
                        "custom_details": {
                            "ping time": "1500ms",
                            "load avg": "0.75"
                        }
                    }
Create New Integration in Governance
You need to have administrator permission of AlertNow to create a new integration and administrator or manager permission to view the integration list.
① Go to Governance -> Policy Management -> Add Rule, and choose Send Notifications to AlertNow and then Create New. Click the [OK] to receive email notification from AlertNow.
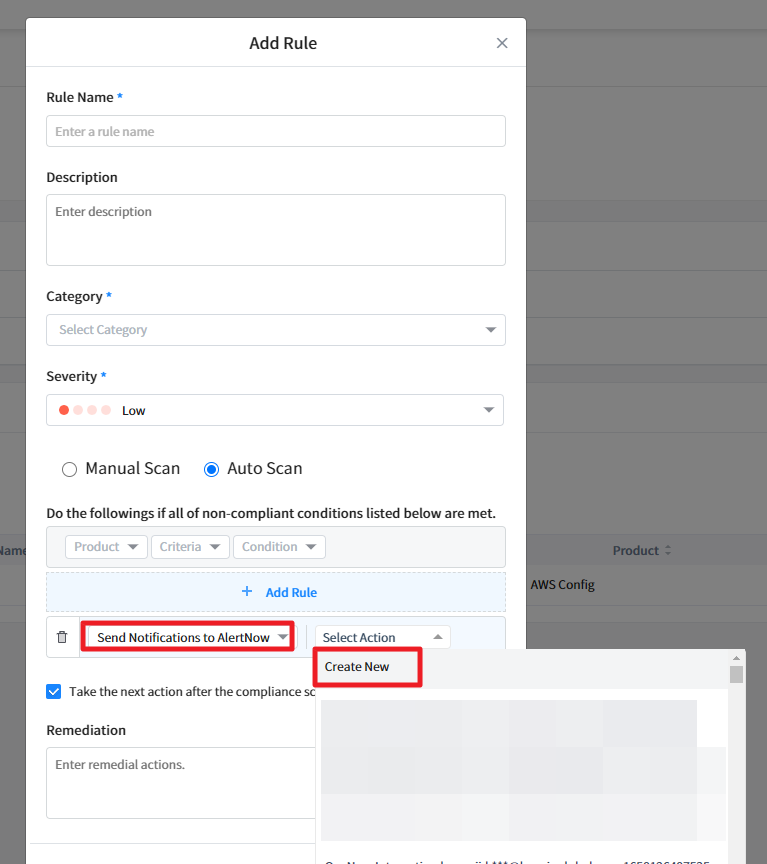
Choose Existing Integration in Governance
You need to have administrator or manager permission to choose an existing integration from the list.
① Go to Governance -> Policy Management -> Add Rule, and choose Send Notifications to AlertNow and then select an existing integration. When you choose an existing integration, you can receive notifications from AlertNow via the email address mapped to the escalation.
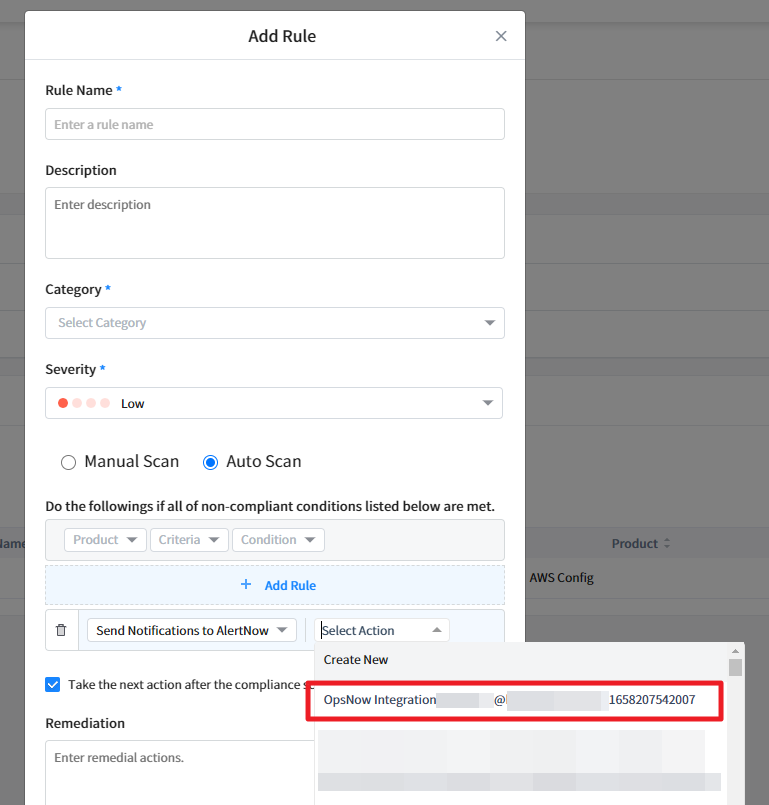
🔔 Note: If you don’t have permission to use AlertNow, please contact our support team at here.
Escalations
Escalation allows you to set managers to be notified and actions to be taken in each step to handle incidents, and set the time limit if the incident is not acknowledged or resolved, it will be escalated to the next level.
Create Escalations
Select Escalation menu and click the [Escalations] button.
![]()
Click the [Create escalation policy] button.
![]()
Enter the required information and click the [OK] button.
![]()
| Item | Description |
|---|---|
| Name | Enter a name for the Escalation policy you set. |
| Description | Enter a description about the escalation. |
| Close Condition | Option to acknowledge or close the incident. If the policy is selected, the close condition is required. |
| Notification per Step | • Specify recipients to be notified for each step. • Up to 20 escalation steps can be added. • Escalation execution: Set a number of escalations to be executed. • Responder: Set a recipient to receive notifications. • Execute next step: When no action was taken on the alert for the specified time, it escalates to the next level. • Repeat this step: With this option, you can repeat the same step and set the number of times to repeat. • Interval: You can set a time period that should be passed before the incident escalates to the next level if no one acknowledges or closes. The interval can be set in minutes. If the policy is selected, the interval is required. |
| Final Notification | • The final notification will be sent to all recipients when no one responds to the alert after all the escalation policies are completed. • Enable the Use button to set the interval and number of times the final notifications should be sent. |
- Click the [OK] button to create an escalation policy.
![]()
🏮 Escalation rules can be set in more details in Service and Integration by configuring Routing rules.
Add Responders
①You can specify responders to receive notifications. Each escalation step can have one or more of the following as its responders:
• Users
• Schedules
• All members of team
• Random member of team
② When Random member of team is selected, a member will be randomly selected. The same member can be selected as a responder again if Random member of team is selected in other steps as well.
📑 Under the Free, Basic, and Standard plans, Team* feature is not included. Please upgrade to the Enterprise plan to use this option.
Schedules
The Schedule feature allows you to assign users to receive incident notifications according to the schedule, which helps you handle incidents more efficiently. Using this feature, you can:
- Add multiple users in one schedule, and receive notifications regularly by setting rotation type.
- Manage various incident notifications as a single schedule by adding multiple layers.
- Another assignee designated by Override feature receives notifications for a certain period of time in case the original schedule assignee is absent.
To get started with the Schedules:
Click [Schedules] in the Configuration page.
![]()
The Schedules consist of the following.
![]()
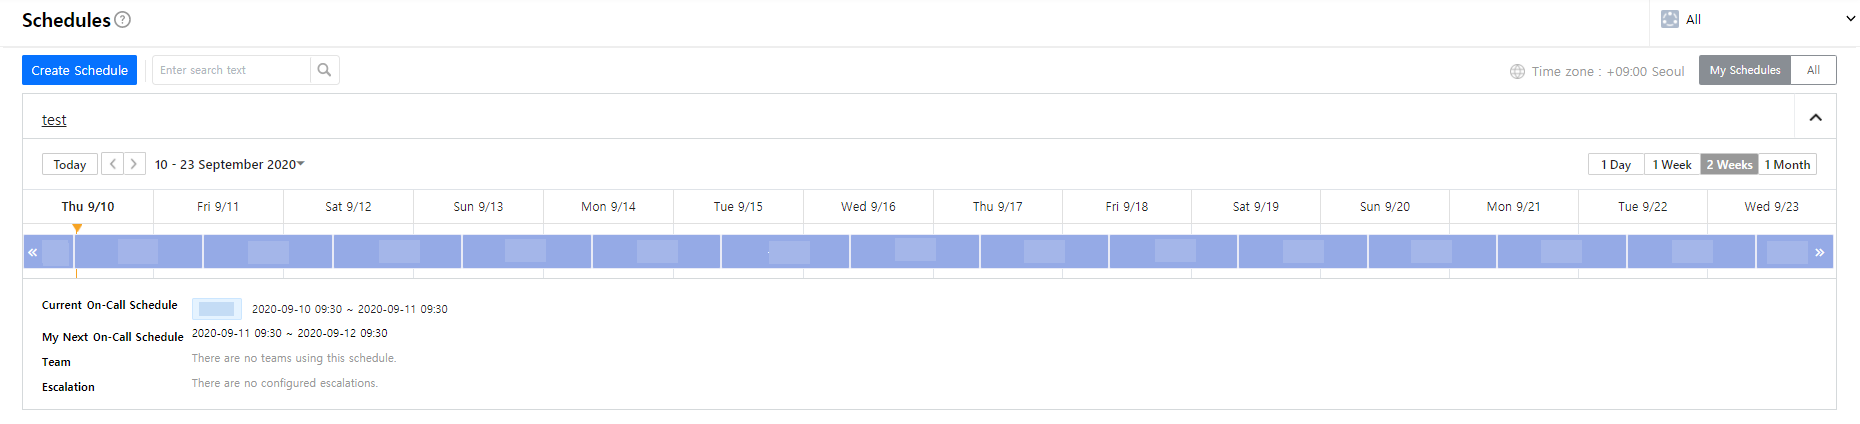
| Screen Configuration | Description |
|---|---|
| View Schedules Options | My Schedules: Only your schedules will be displayed. All: All the registered schedules will be displayed. |
| View | Set the period for viewing schedules. (1 day, 1 week, 2 weeks, or 1 month) |
| My Next On-Call | The next schedules for handling incidents will be displayed, and provided only on your schedule. |
| Layer | Display the assignee to receive incident notifications, period and override information. |
| Current On-Call | Display the on-going schedules. |
| Team | Display the teams using that schedule. If you select the team, it moves to the detailed page of that team. |
| Escalation | Display the escalations using that schedule. If you select the escalation, it moves to the detailed page of that escalation. |
Create Schedule
By creating a schedule, you can assign users to receive incident notifications, and set the shifts to receive notifications.
To create a schedule:
Click [Create Schedule].
![]()
The creation page will be displayed.
![]()
Enter a name of the schedule.
Select the time zone.
Select teams to include the schedule.
In Responder Settings of the Schedule Rule Settings, add assignees to receive incident notifications. The notifications will be sent by registration order. You can also change the order of notifications by dragging and dropping the newly added user to desired location, and delete the user by clicking the [ X ] button.
![]()
In Rotation Type Settings, the assignee added in a layer can set the shift period to receive notifications. You can select from daily, weekly, or custom.
![]()
If you enable Restrict Reminder Time Option, you can limit the time and day to receive incident notifications. If you set it to Daily, you will only receive notifications during the specified time of the day. If you set it to Weekly, you will only receive notifications during the specified day and time.
![]()
If set to Daily ![]()
If set to Weekly Click [OK] to add a schedule.
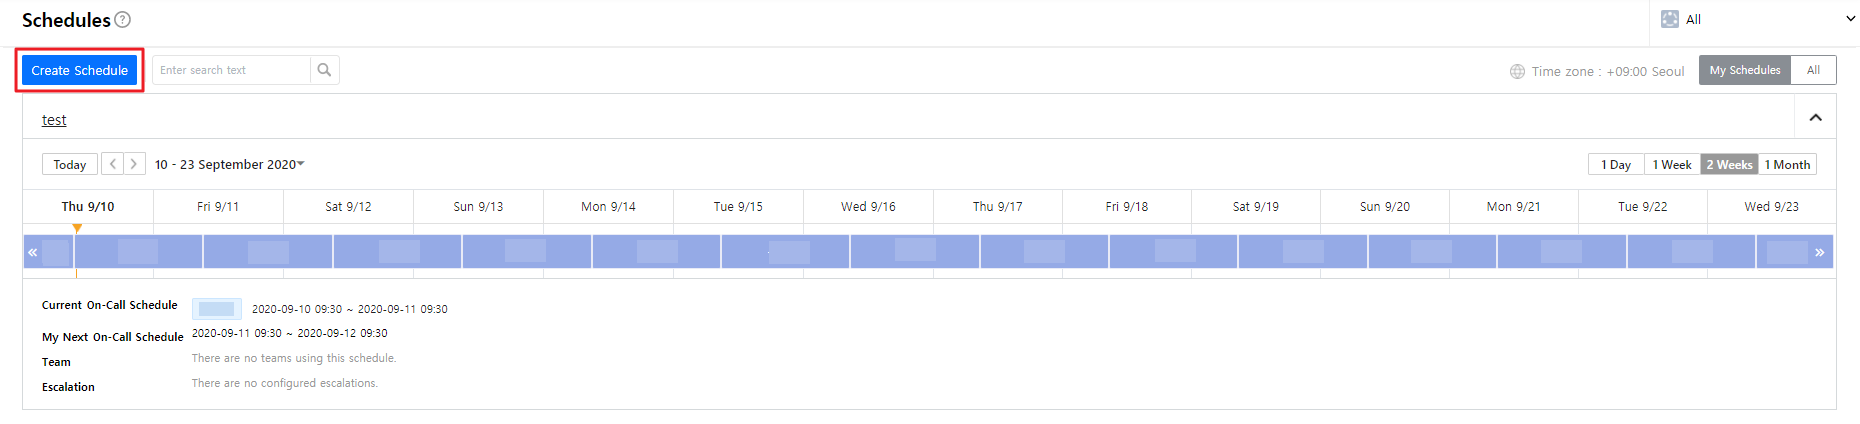
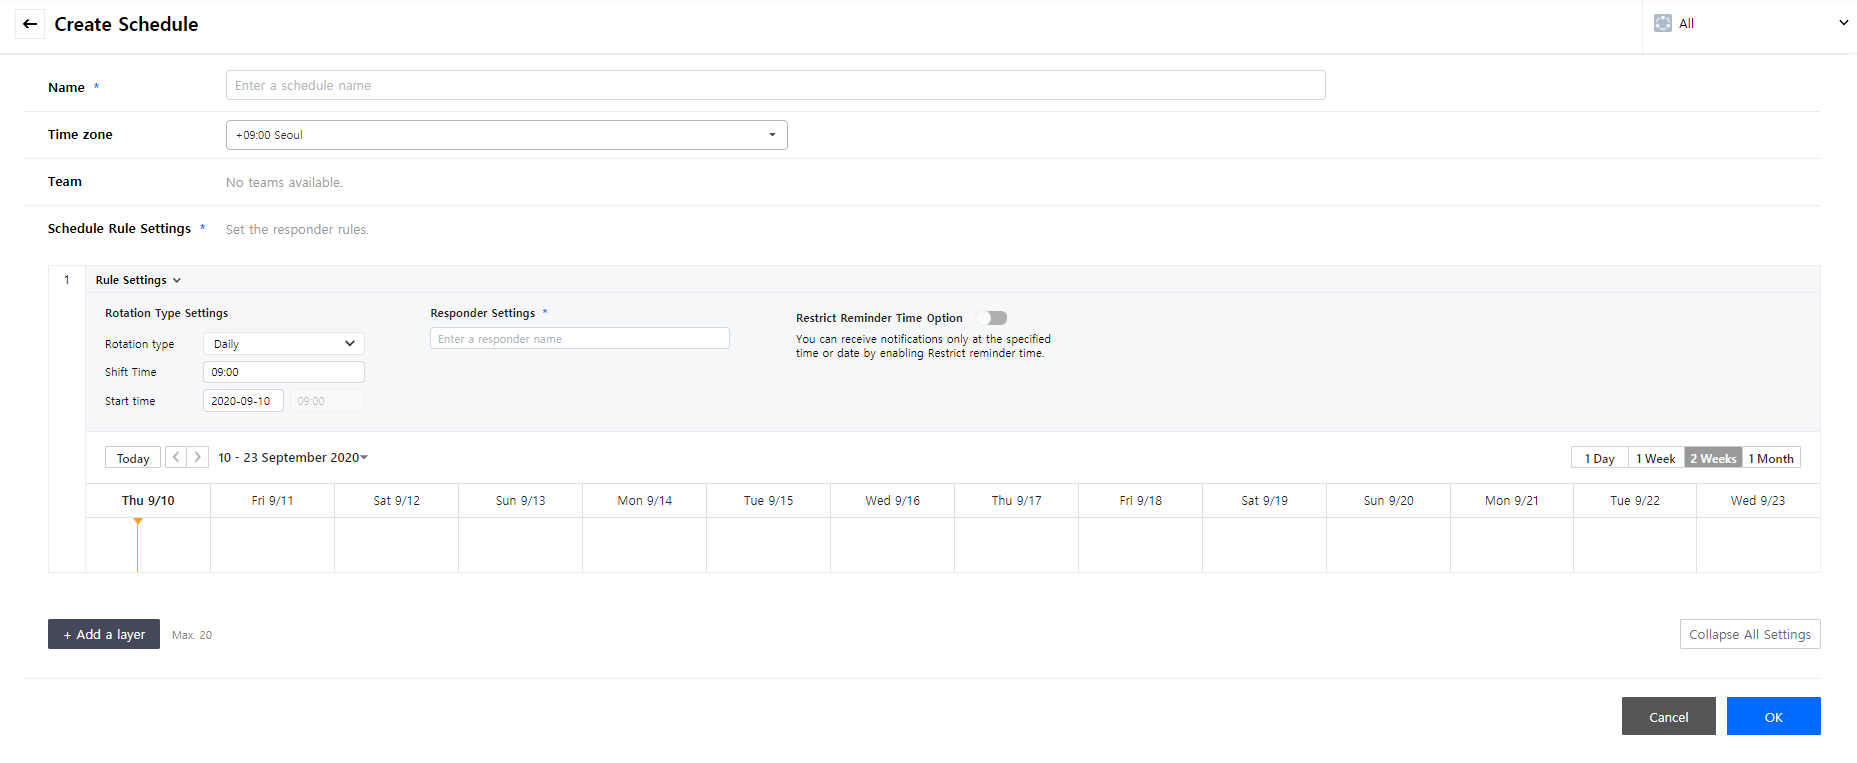
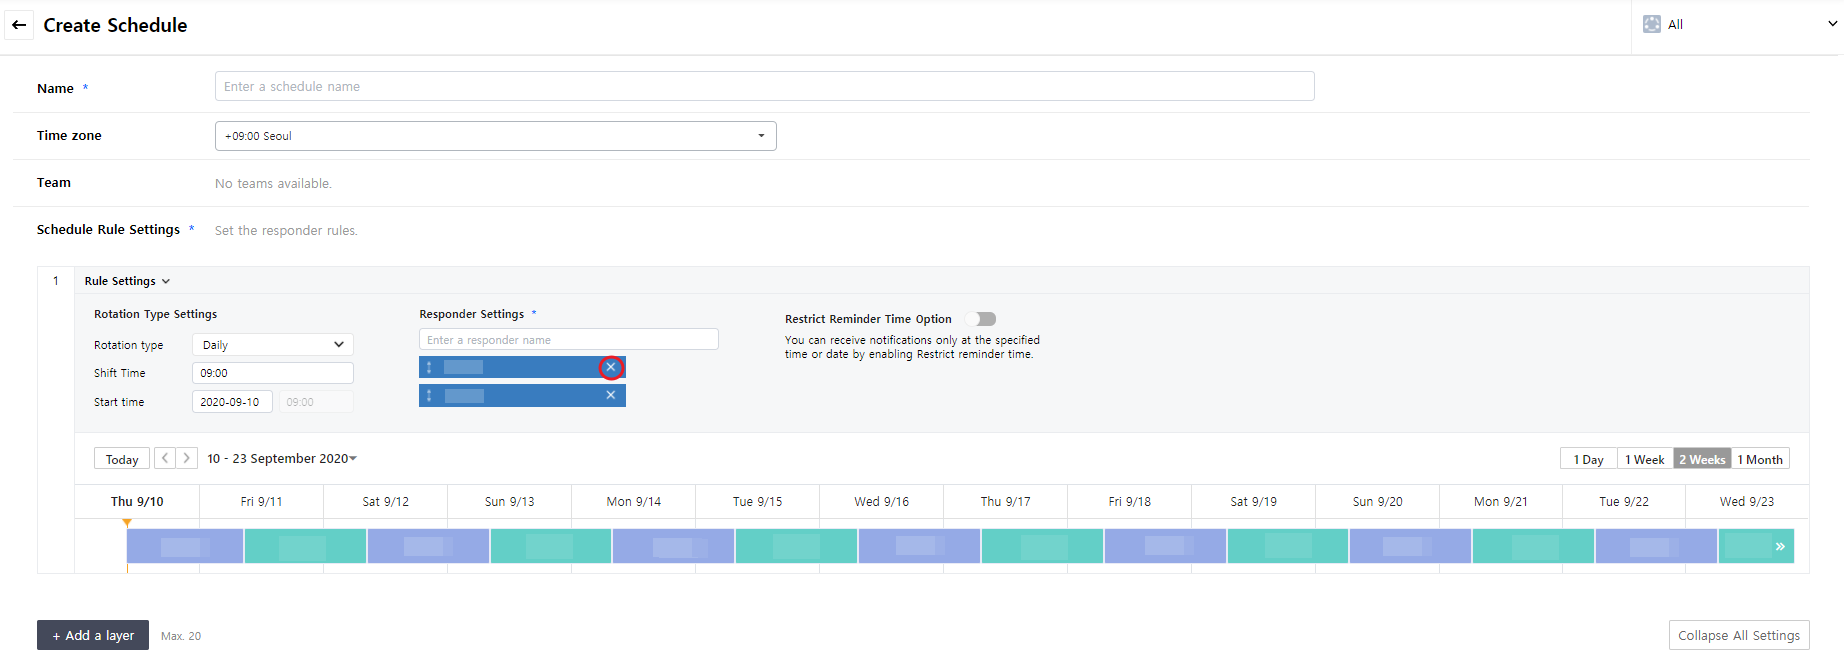
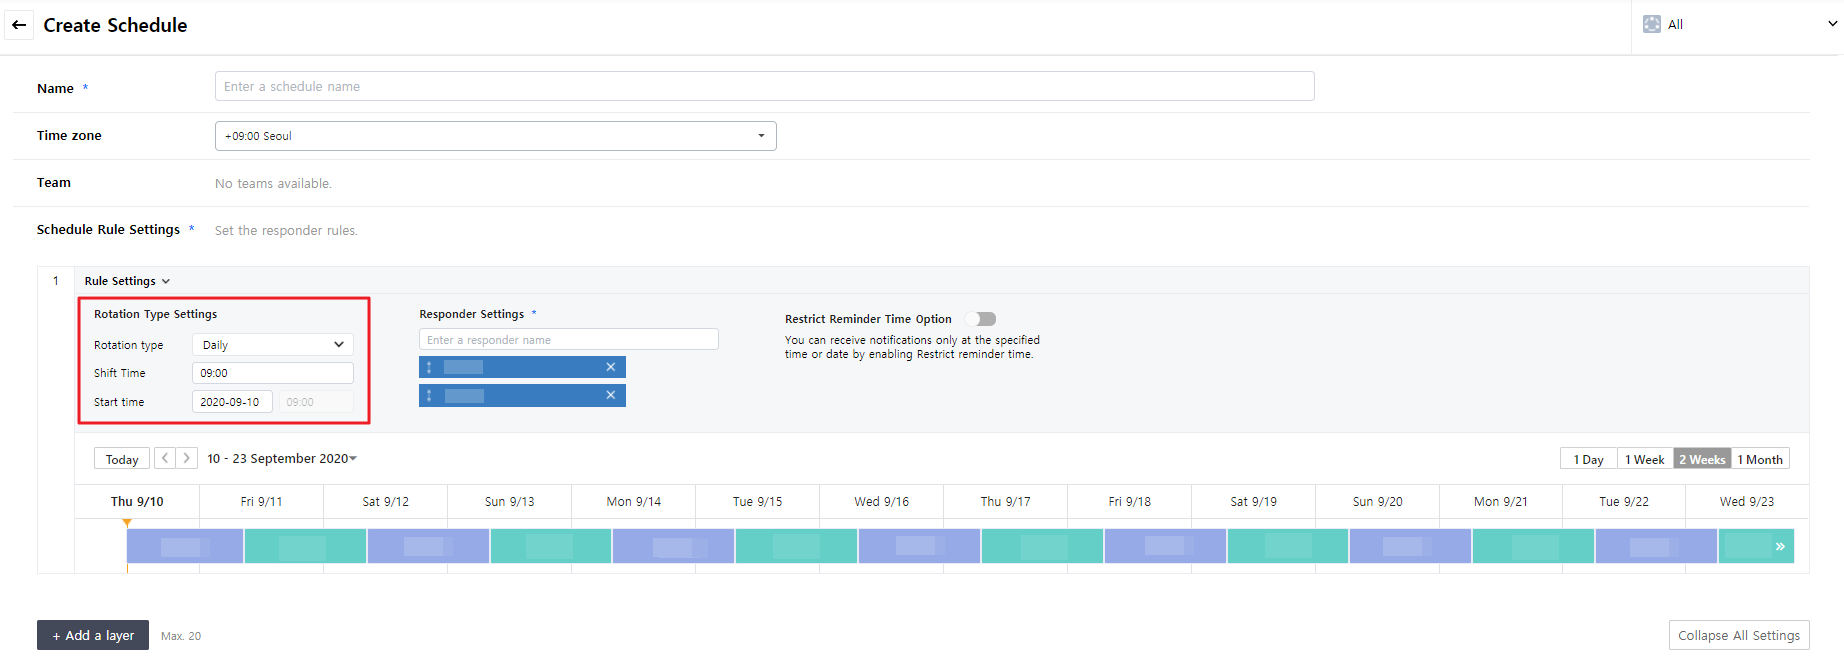
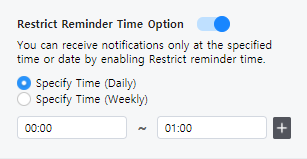
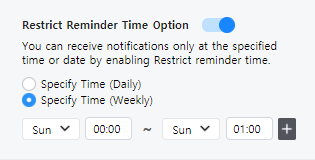
📌 Important: You must add your schedule to escalations to use it properly. Schedules alone are ineffective for notifications.
Schedule Settings
You can modify schedules by adding or deleting layers, copy another schedule with the same condition, and delete them. On-going escalations cannot be affected by this modification, and incidents that occurred after the modification, changed schedule will be applied.
Modify Schedule
① Click the created schedule and go to the details page.
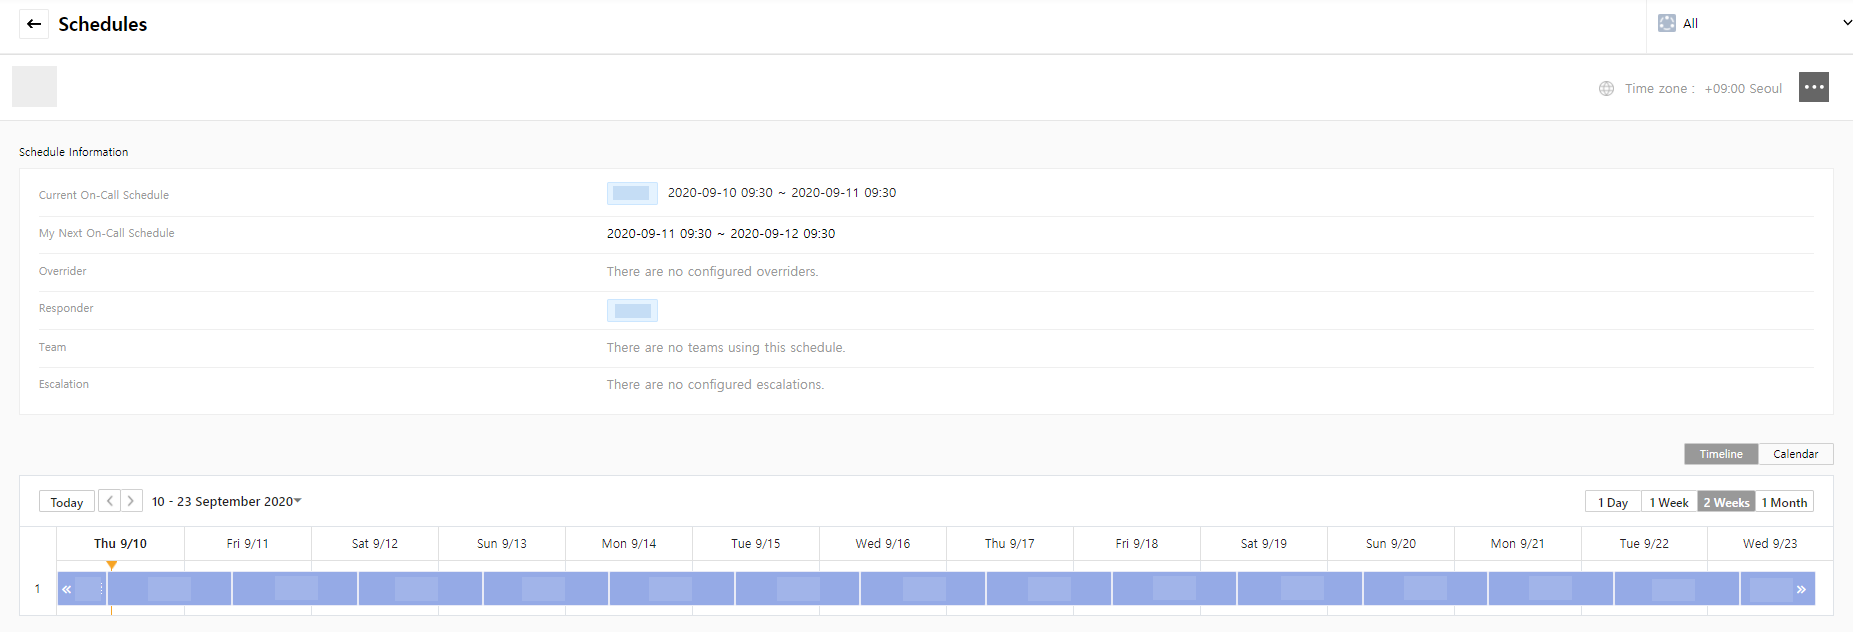
② Click [Modify] on the menu icon.
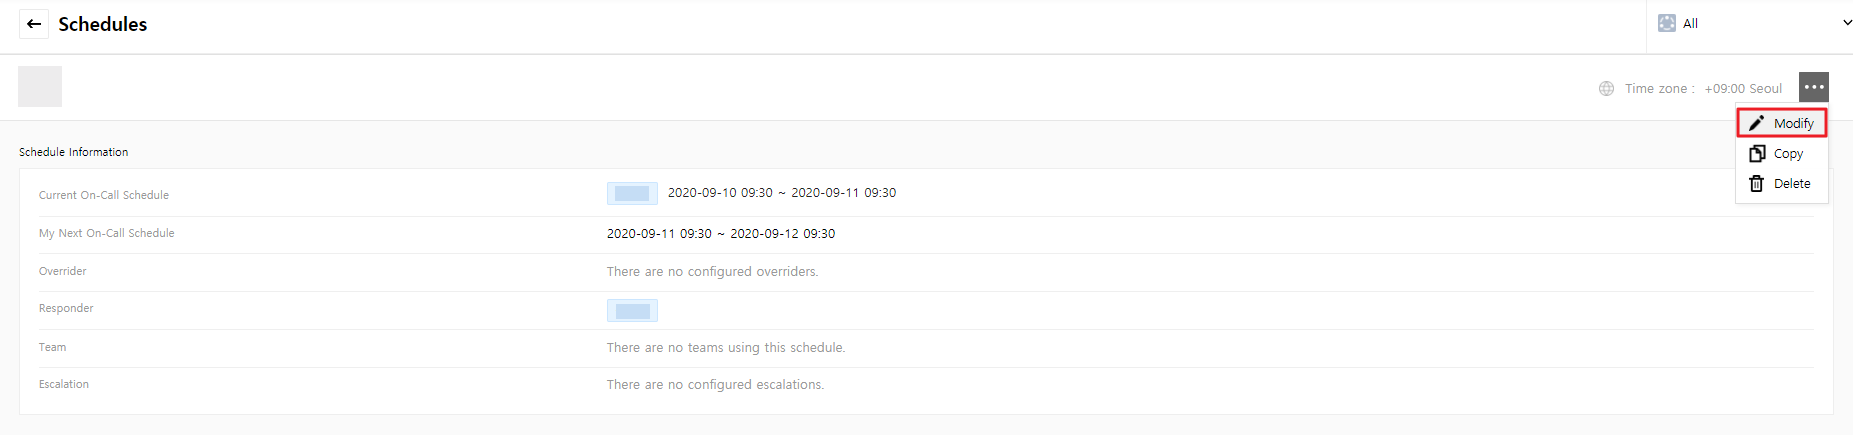
③ Apply the changes in the modification page. The items are the same as the ones for creating schedules.
④ If you click the [+ Add a layer] button, you can add layers to the schedule. Up to 20 layers can be added.
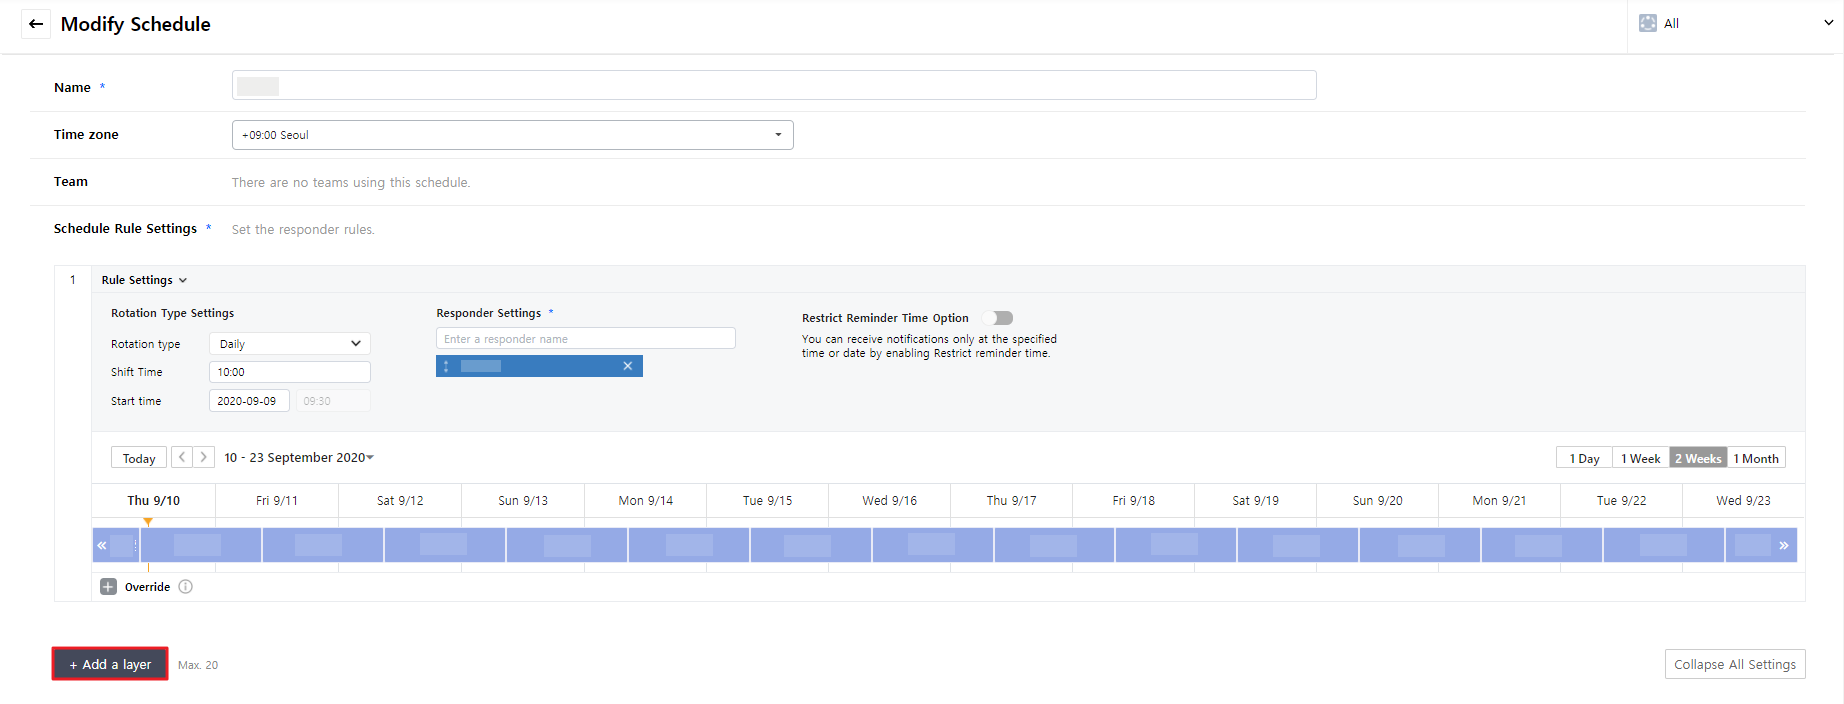
⑤ To delete the specific layer from your schedule, click the [Delete] icon at the right of the layer.
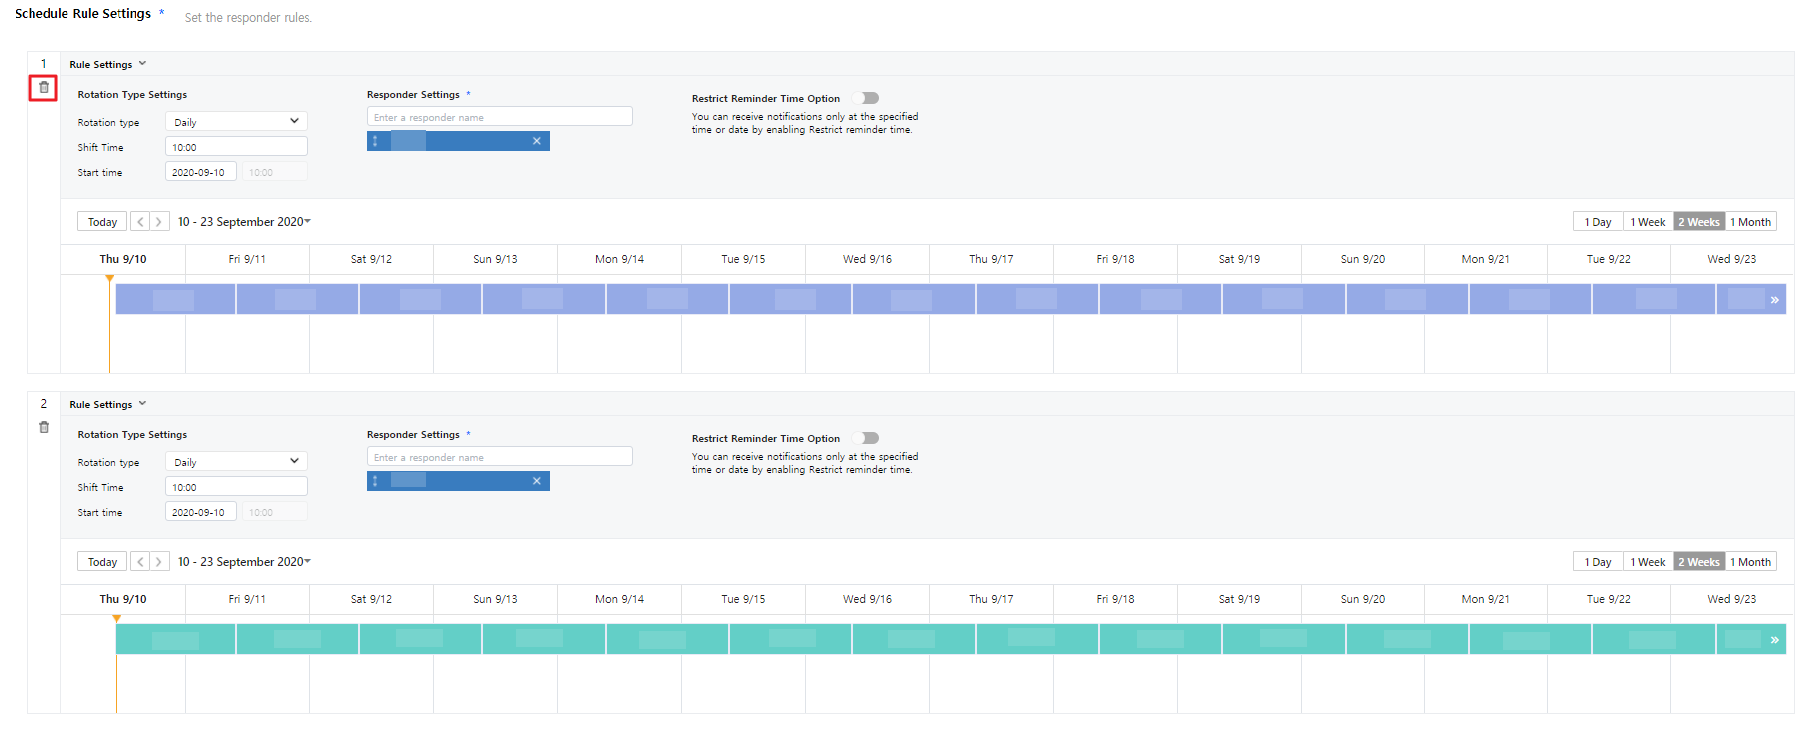
⑥ Once you delete, the deleted layer cannot be recovered; and if modifying your schedule after deletion, it will automatically be excluded from escalation. Click the [OK] button to delete a layer.
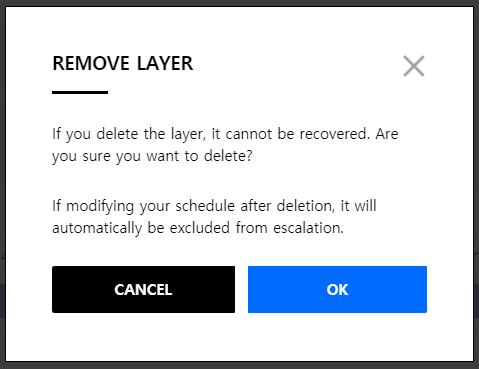
⑦ Click [OK] to modify a schedule.
Copy Schedule
① Click [Copy] on the menu icon at the top right of the details page.
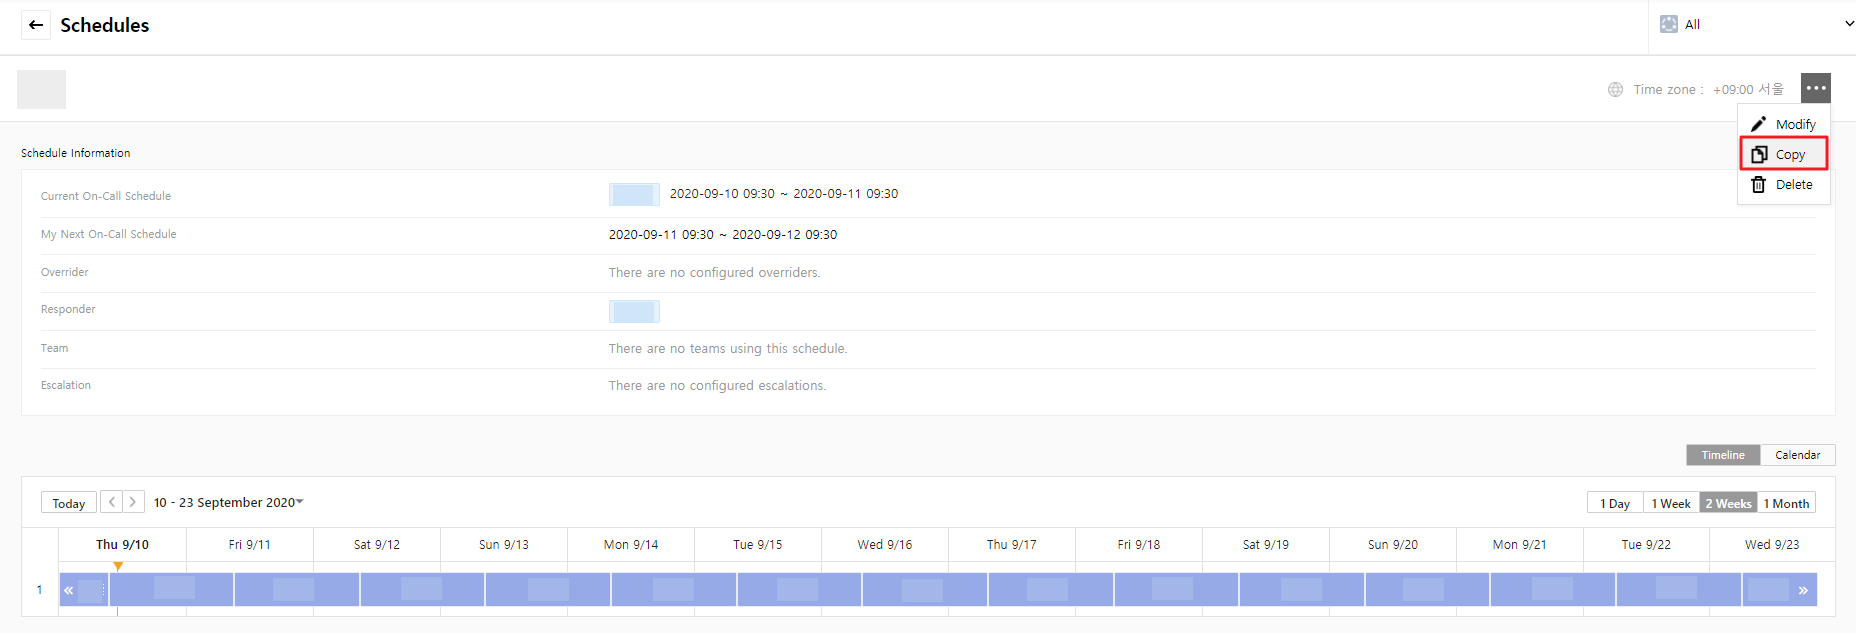
② Existing schedule with the same settings will be copied, and click [OK] to copy the schedule. The name of the copied schedule will be provided as {schedule name}-copy-{#} format.
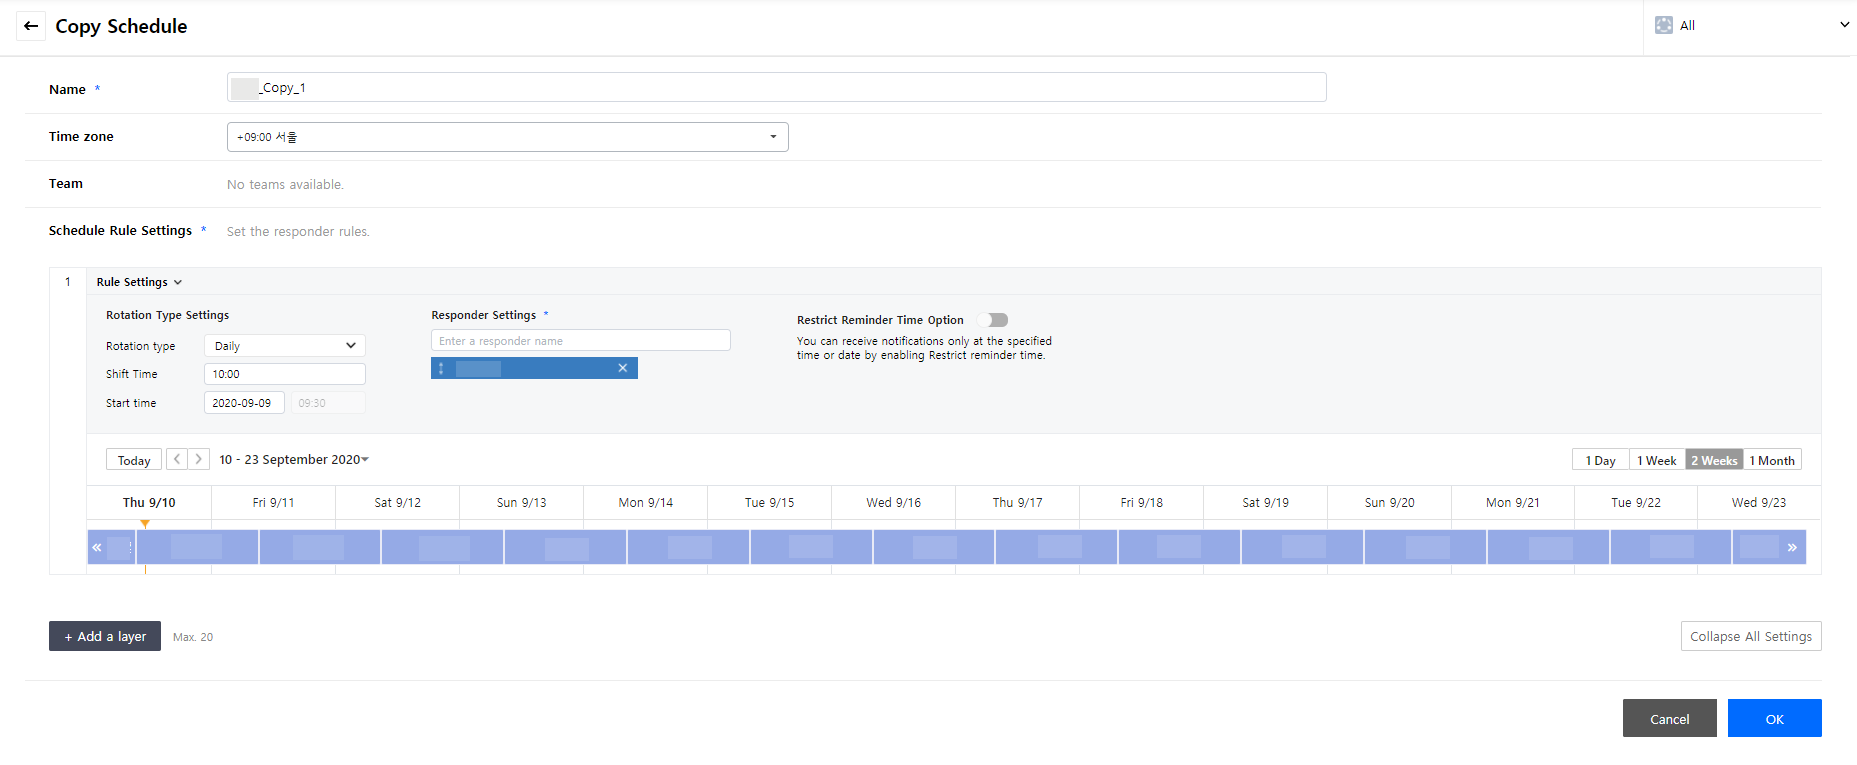
Delete Schedule
① Click [Delete] on the menu icon at the top right of the details page.
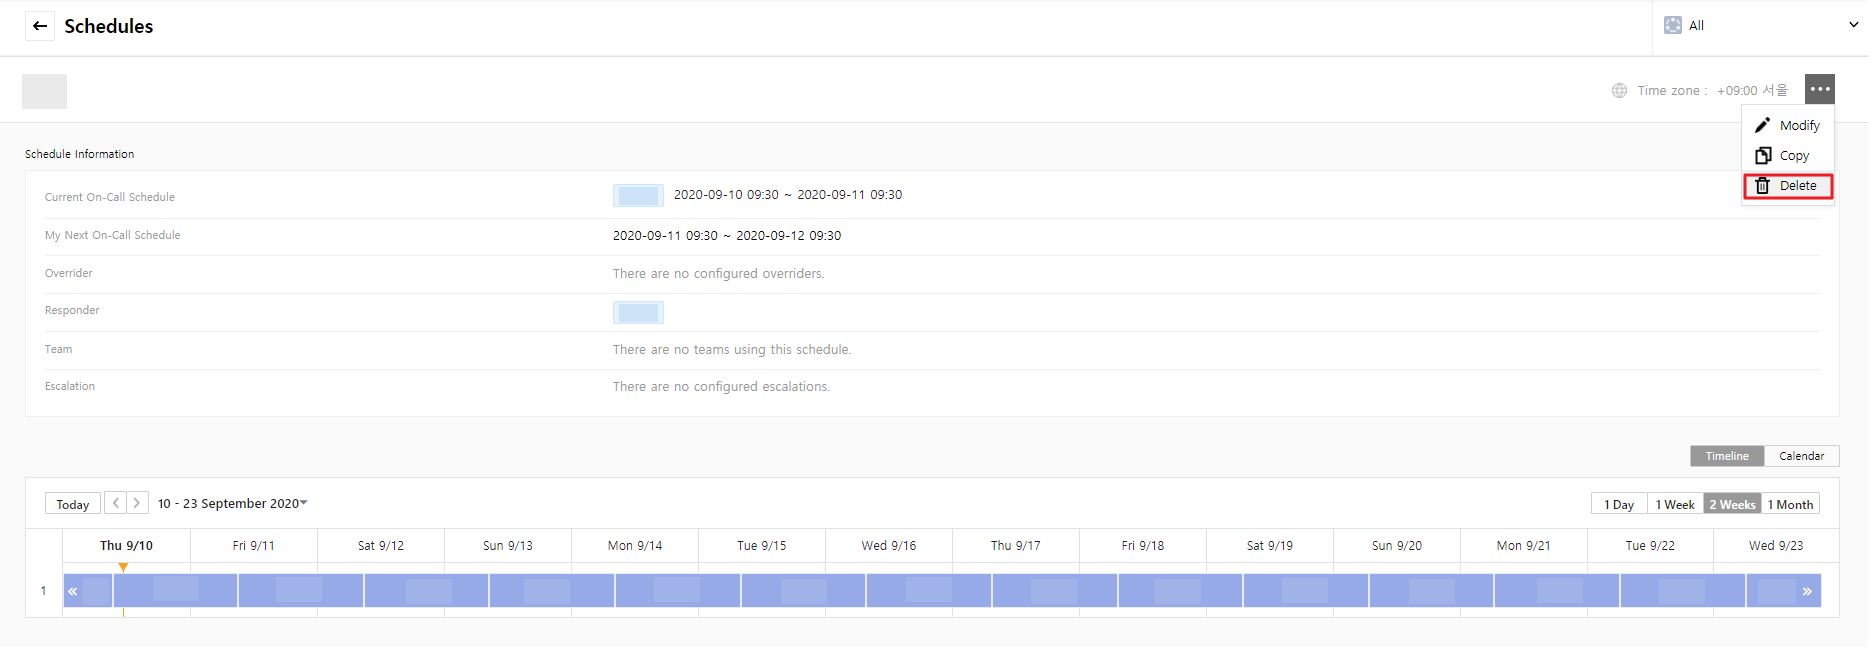
② Click the [Delete] button to delete the schedule. If the schedule has on-going escalations, it cannot be deleted.
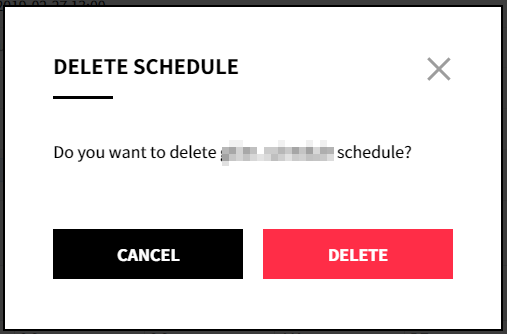
Set Overrides
Override enables a user to take the on-call schedule for a specified amount of time. When an override is created, the specified user replaces the on-call user of the specified layers or all on-call users from all layers. You can select the range of layers, all layers or specific layers, to apply an override while creating the override.
Create Override
① Click the created schedule.
② Click [Modify] on the menu icon at the top right of the detail page.
③ Click [Override] on the menu icon in the modification page.
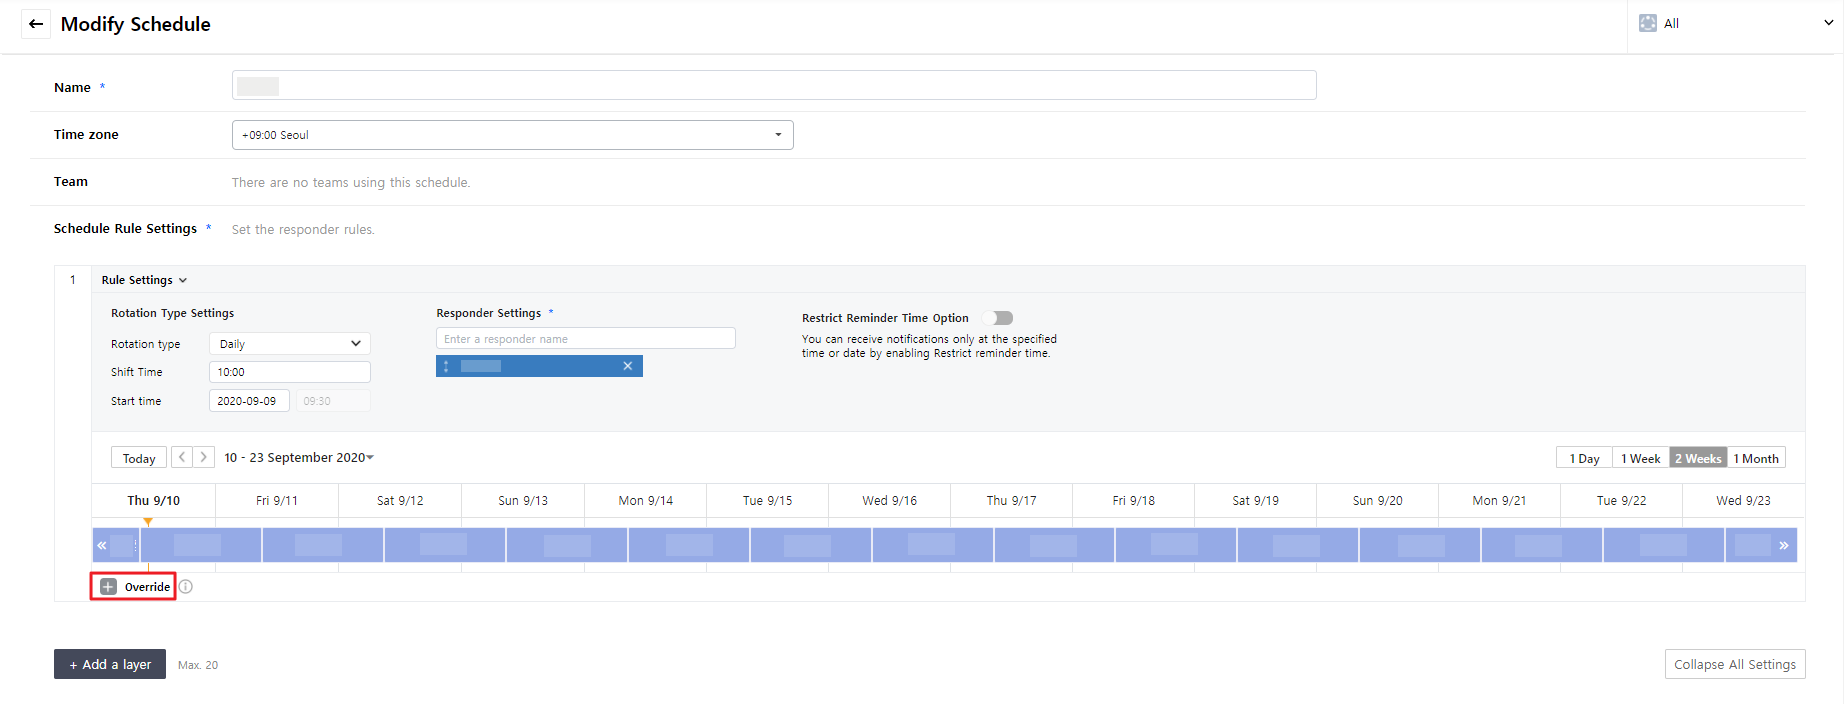
④ You can also create an override by selecting a timeline bar and clicking the [Create Override] button in the popup window.
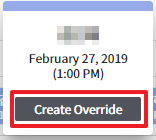
⑤ The Create Override popup will be displayed as below.
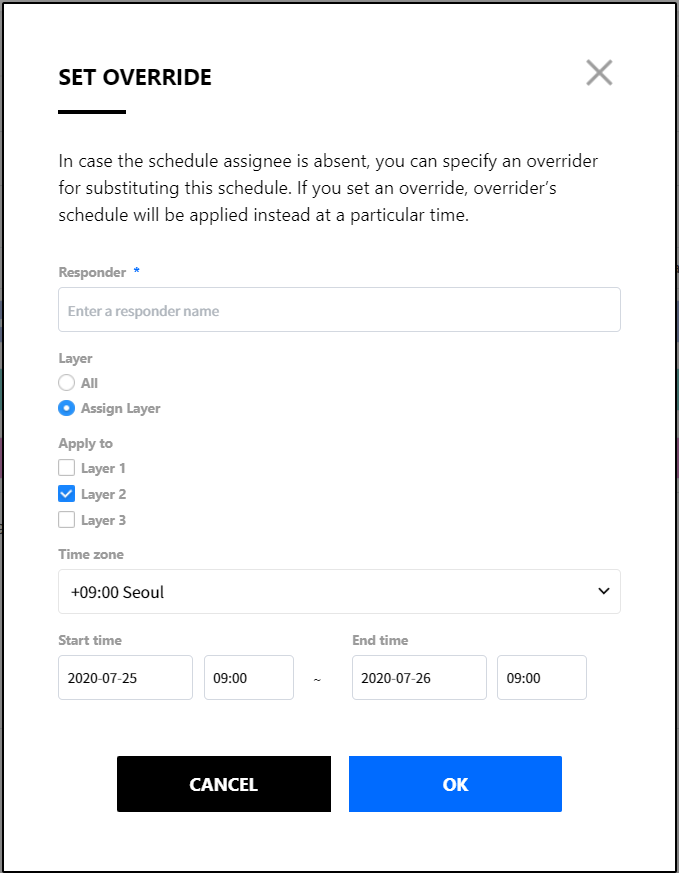
⑥ Enter a user name to assign as an overrider.
⑦ Select the range of layers to apply an override.
⑧ Select the time zone.
⑨ Set the start and end time to substitute the schedule.
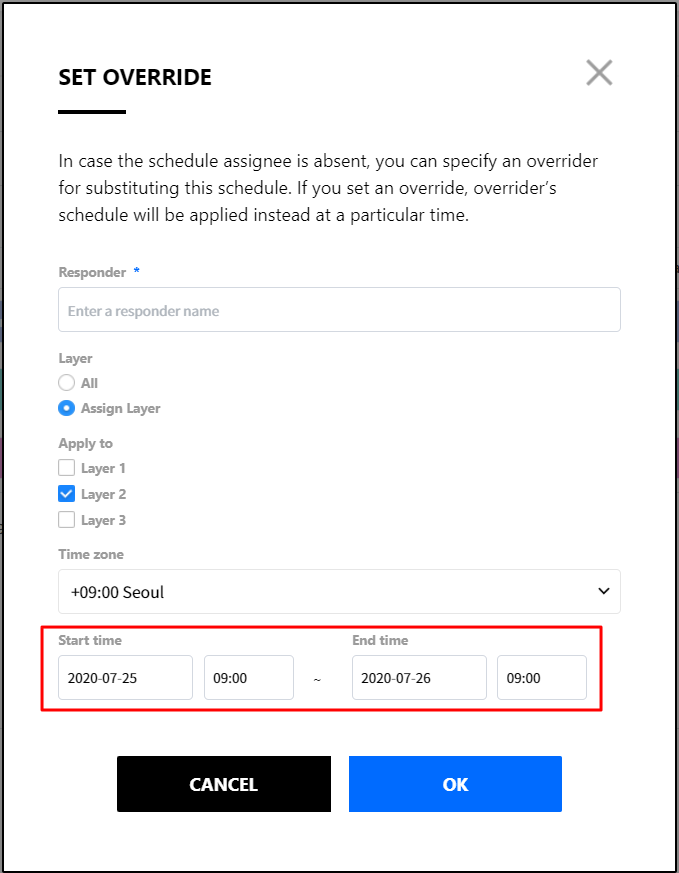
⑩ Click the [OK] button to create an override schedule.
Delete Override
① Select the override timeline bar, and click the [Delete Override] button in the popup window.
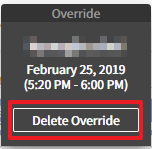
② In the popup window, check the override schedule to delete and click the [Delete] button.
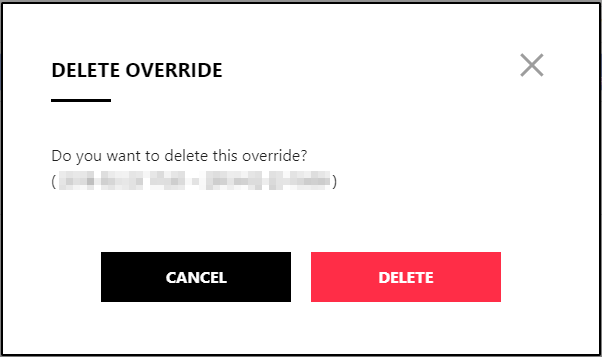
📌 Important: When the range of layers is set to all and the override is deleted, it will be deleted from all layers.
Users
Display a list of users who can receive notifications sent by AlertNow. If a user is listed here without signing in, this user can receive notifications as well. User roles and permissions are listed below.
| User Type | Description |
|---|---|
| Admin | Has overall permission to manage entire AlertNow services, and can create, modify, delete, and view Integrations, Services, Escalations, Extensions, and Incidents. |
| Responder | Is the main assignee who handles incidents after receiving alerts. Responders can view Services, Escalations, and Extensions, and create, modify, and view Incidents as well. |
| Service Manager | Can assign responders to handle incidents. |
| Observer | Can check incident status if required, and only view Services, Escalations, and Incidents. |
Teams
Team is a service for managing all the information related to incidents such as escalations, users (escalation responders) and services in a group. It also enables privacy settings to restrict access to other uses to your team.
Click [Teams].
![]()
The Teams menu consists of the following.
![]()
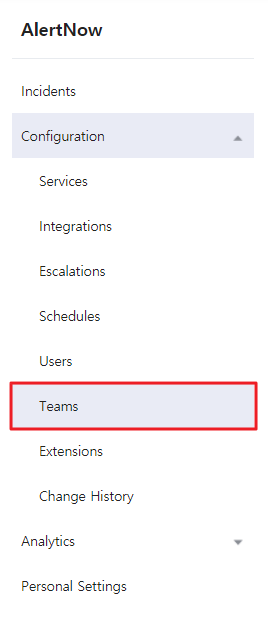
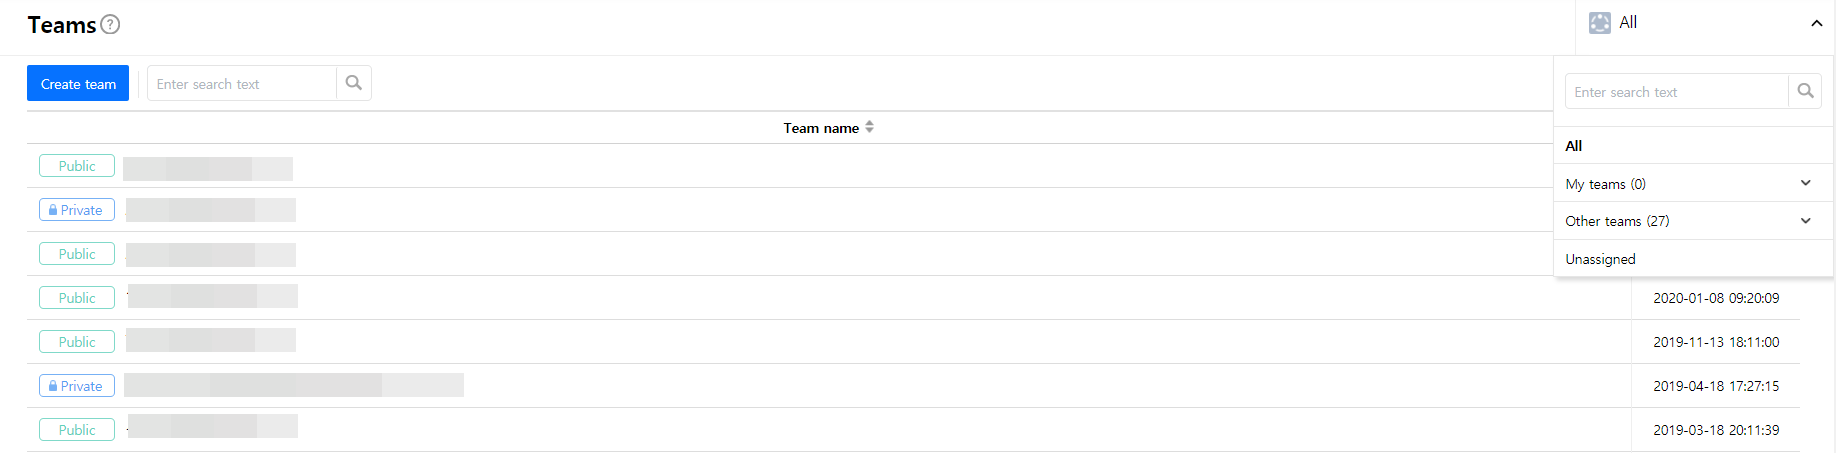
| Screen Configuration | Description |
|---|---|
| Team Name | The team name is displayed along with its privacy. |
| Dropdown menu | All My teams Other teams Unassigned |
- If you select a specific team from the dropdown menu, the items included in that team will be filtered out in each menu. However, the Personal Settings menu is excluded from the menu.
![]()
![]()
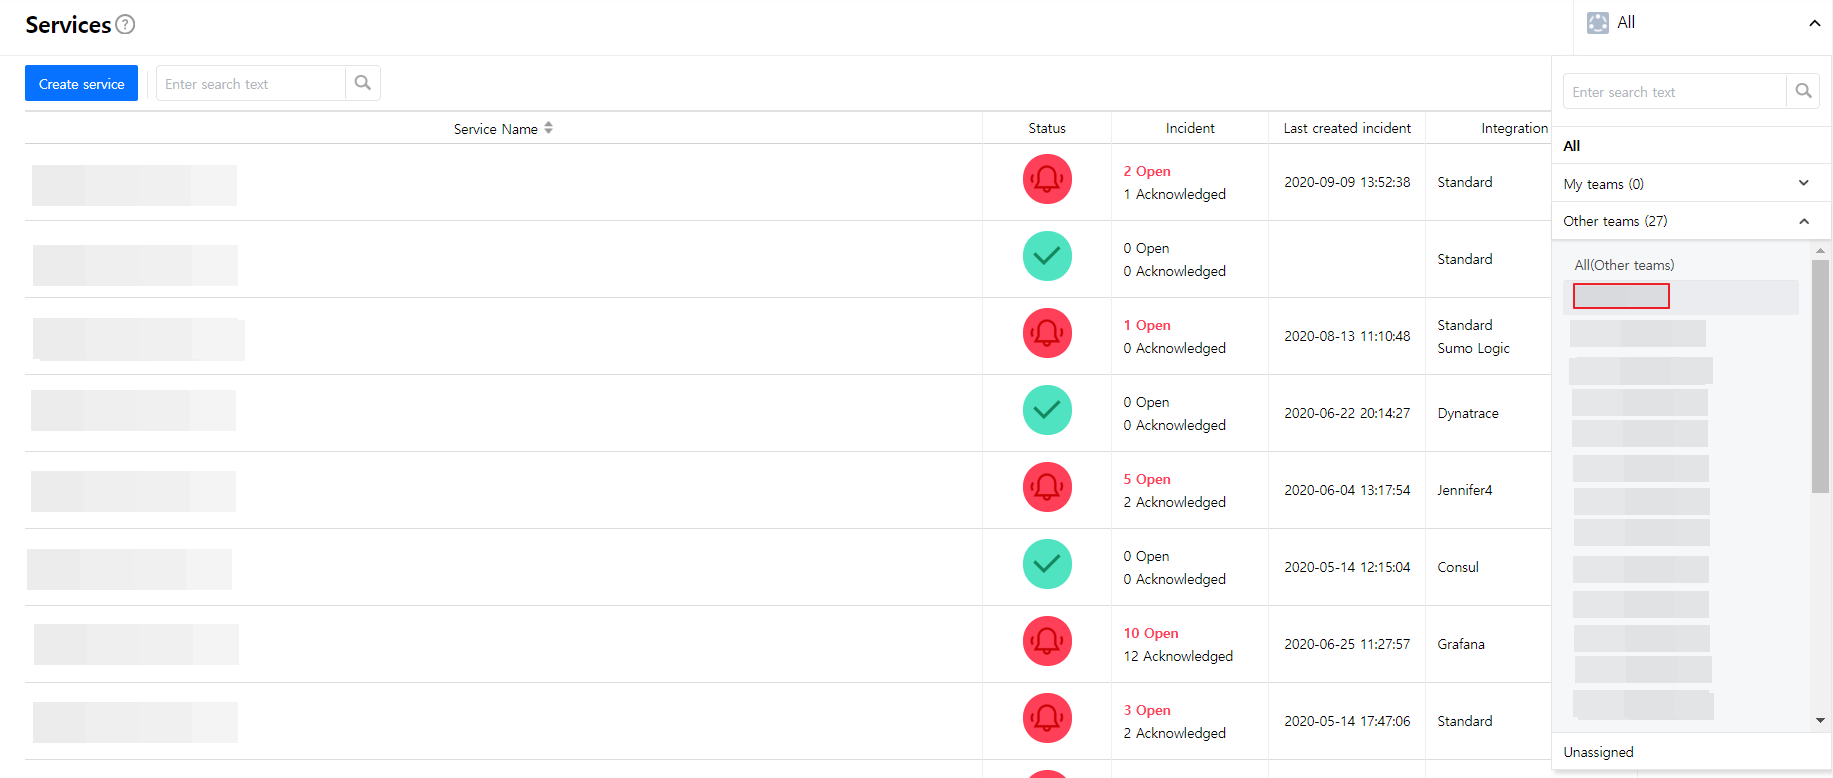
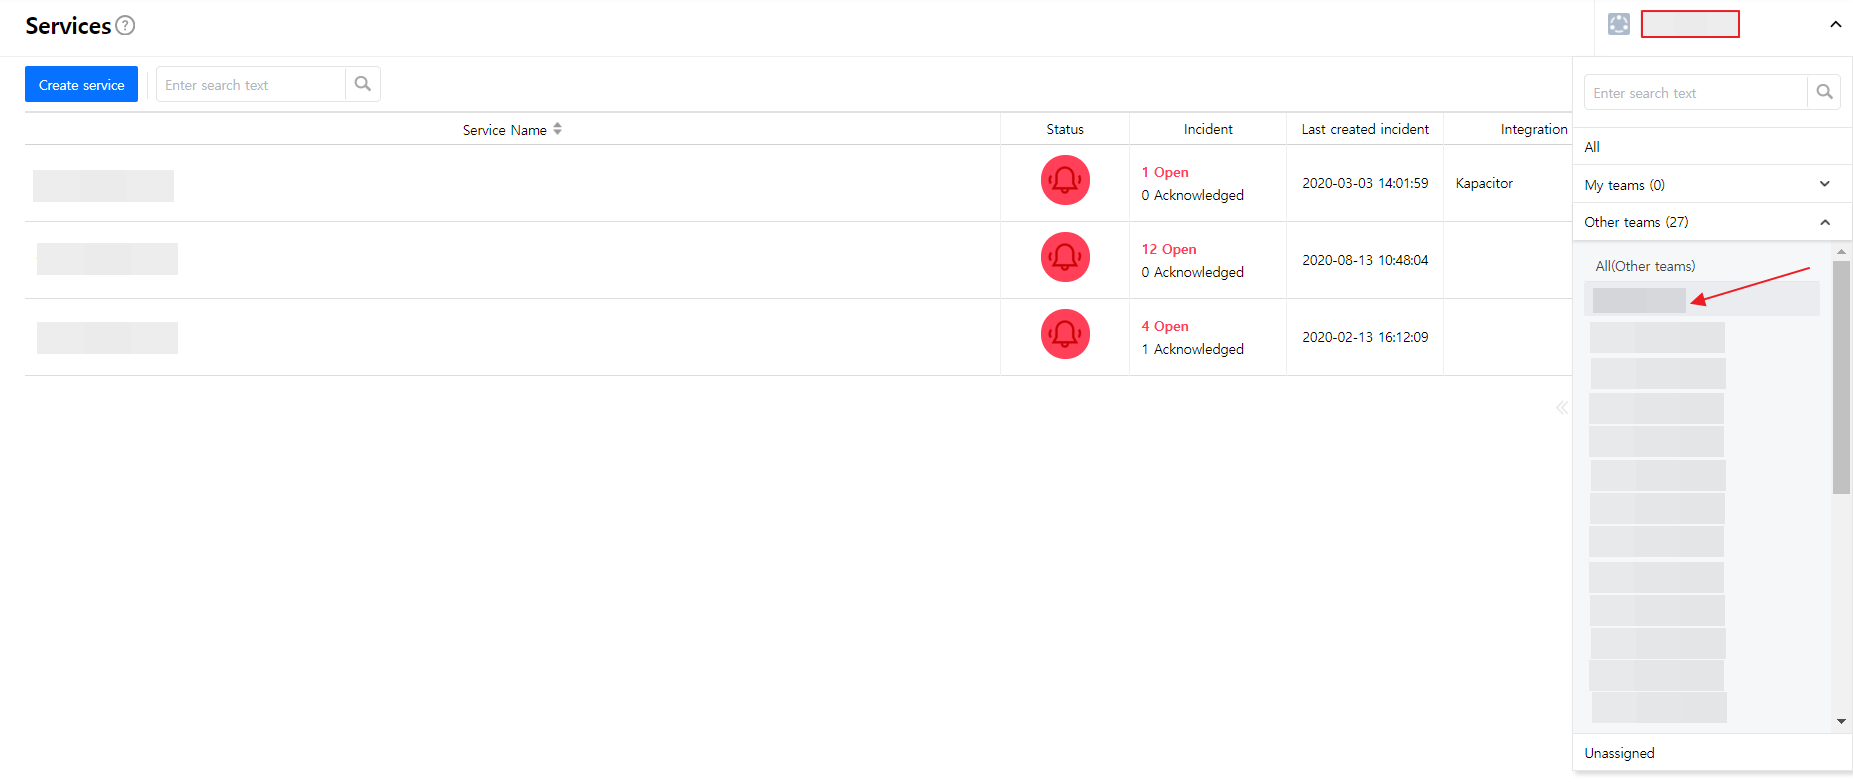
Add Teams
Click [Create Team].
![]()
The input items of the popup window are as follows.
![]()
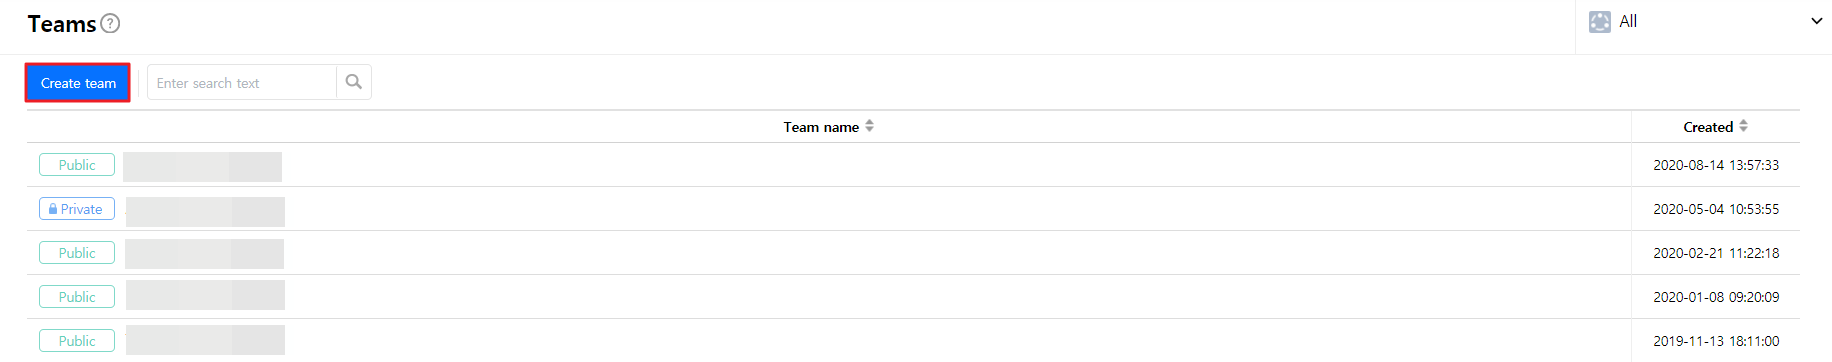
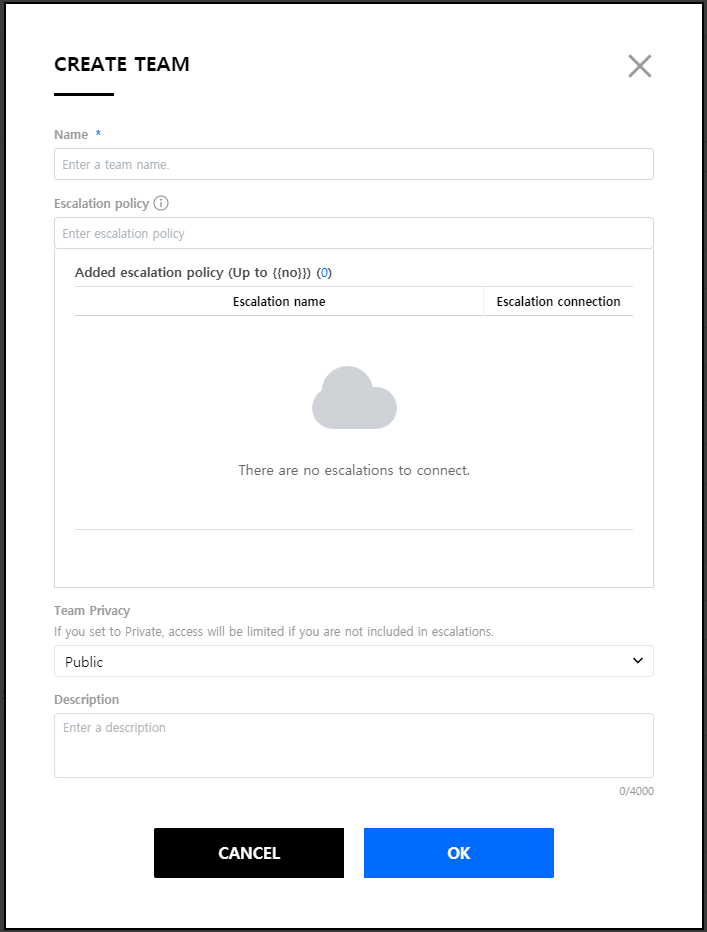
| Item | Description | Note |
|---|---|---|
| Name | Enter a team name. | Required |
| Escalation Policy | Select escalations that need to be added to a team. | Optional |
| Team Privacy | Select the privacy for your team. Default is set to public. | Required |
| Description | Enter the description about your team. | Optional |
- Click [OK] to add the team.
Team Settings
Click a created team.
The detail page will be displayed as below.
![]()
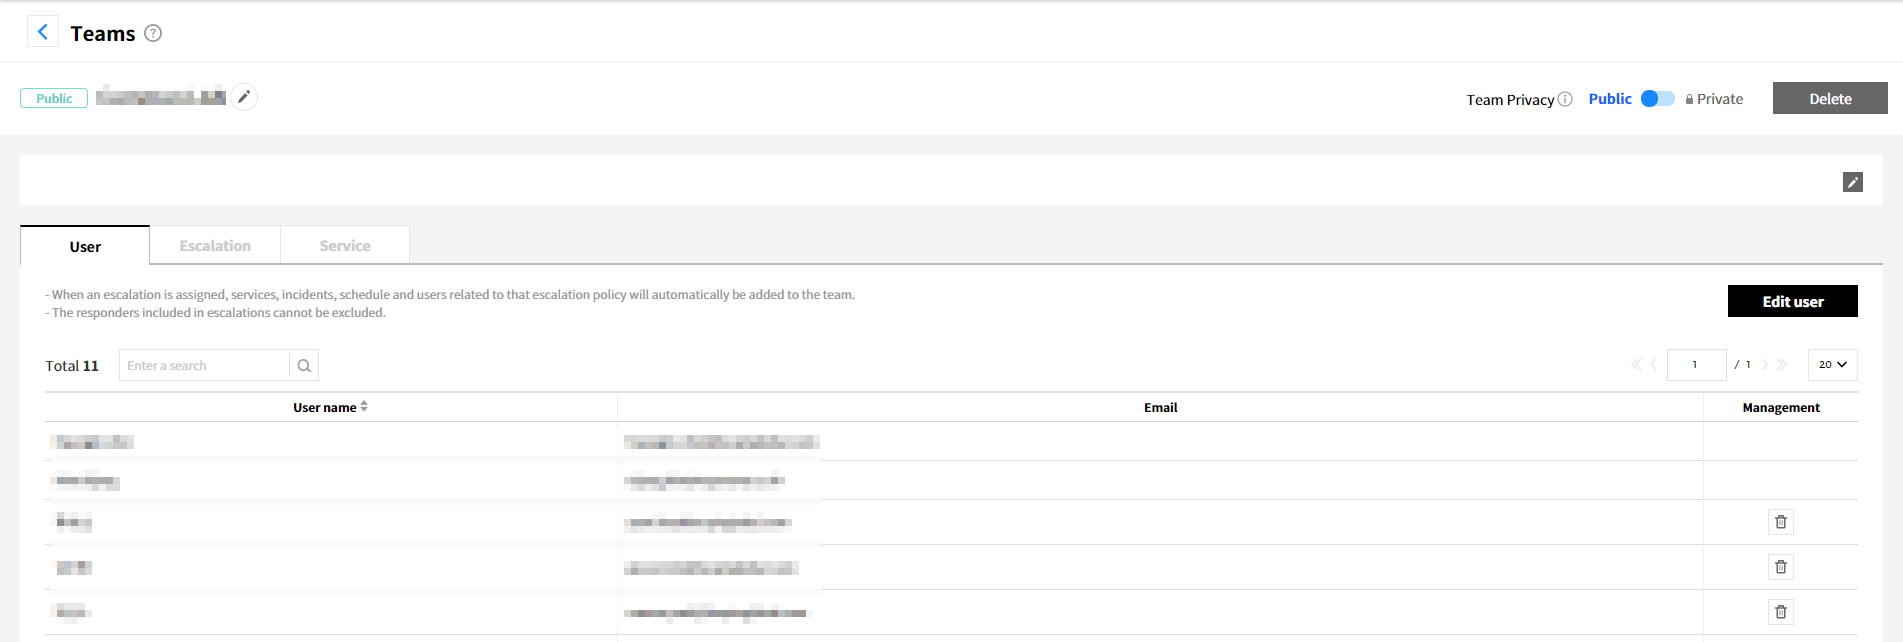
Team Privacy
① Set the privacy for your team.
Public: Available for all users
Private: Available only for team members and managers
② Enable or disable the toggle button to change the team privacy.
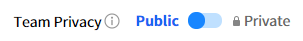
Users
The responders included in escalations for your team will automatically be added.
① Click [Modify User] to add a user. Select a user to add, and click the [OK] button.
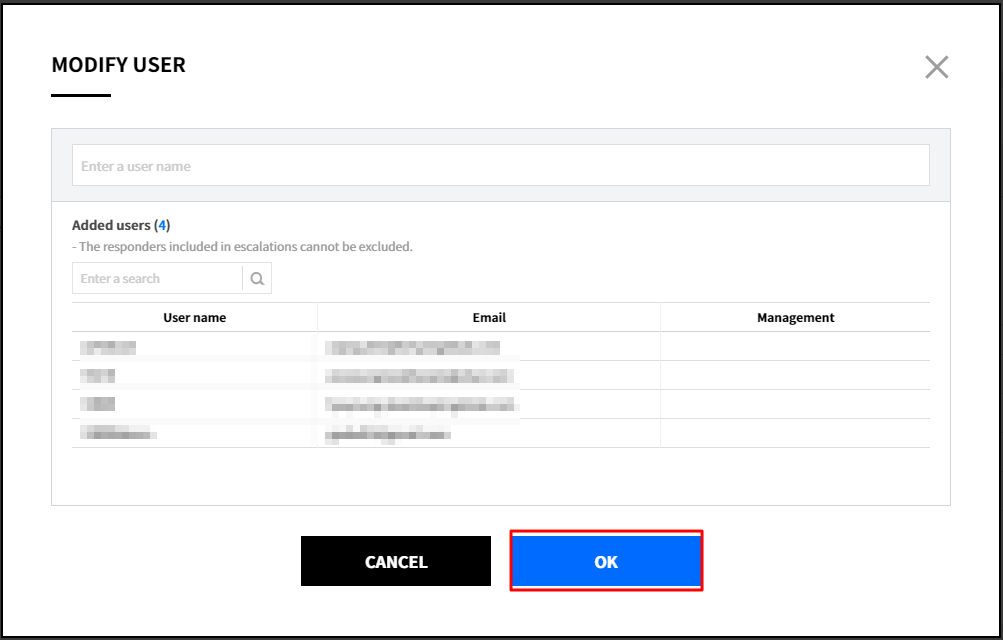
② In the Modify User page, click the [Delete] icon to delete users. However, you cannot delete the users included in escalations.
![]()
Escalations
① Click [Modify Escalation] to add an escalation. Select the escalation to add, and click the [OK] button.
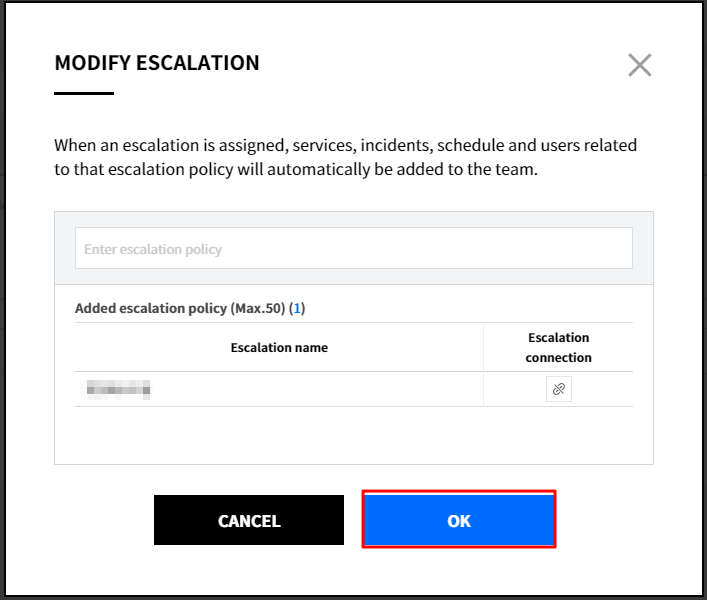
② When adding an escalation, incidents, schedules and users that are related to the escalation will also be added to your team.
③ Click [Exclude Escalation] to disconnect the escalation from the team.
![]()
Services
A list of services that include escalations for your team will be displayed.
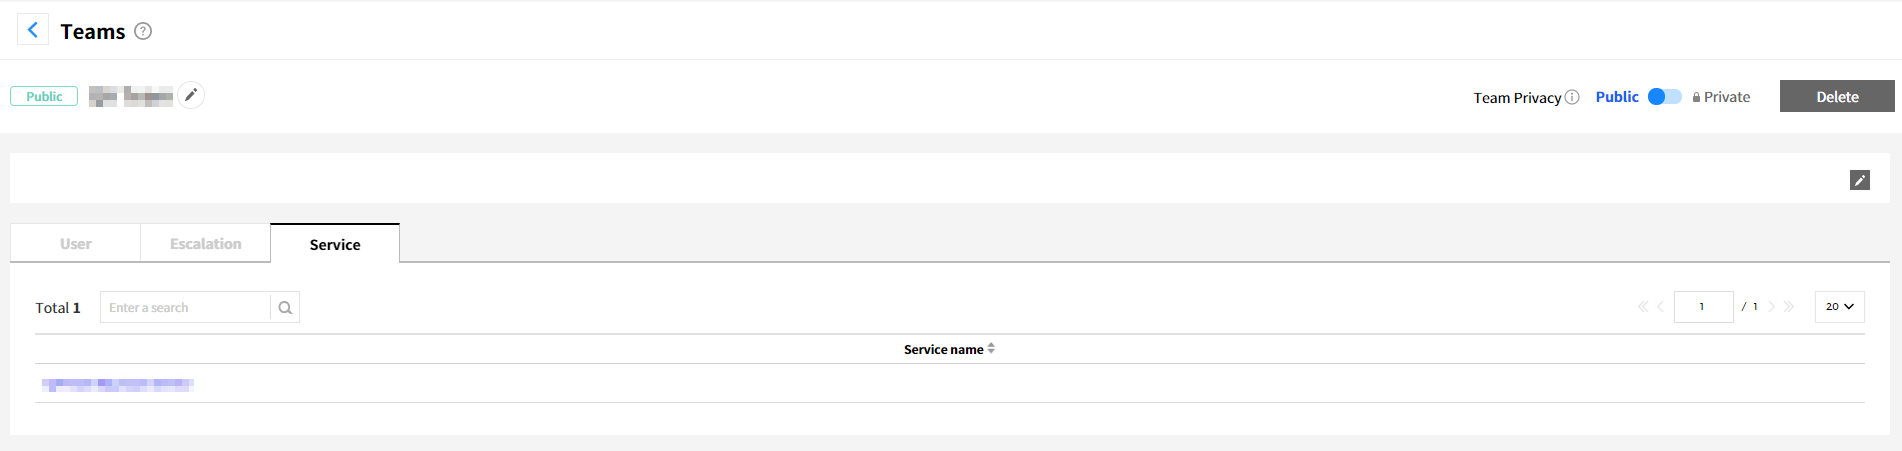
Delete Teams
① Click a created team.
② Click [Delete] from the detail page.
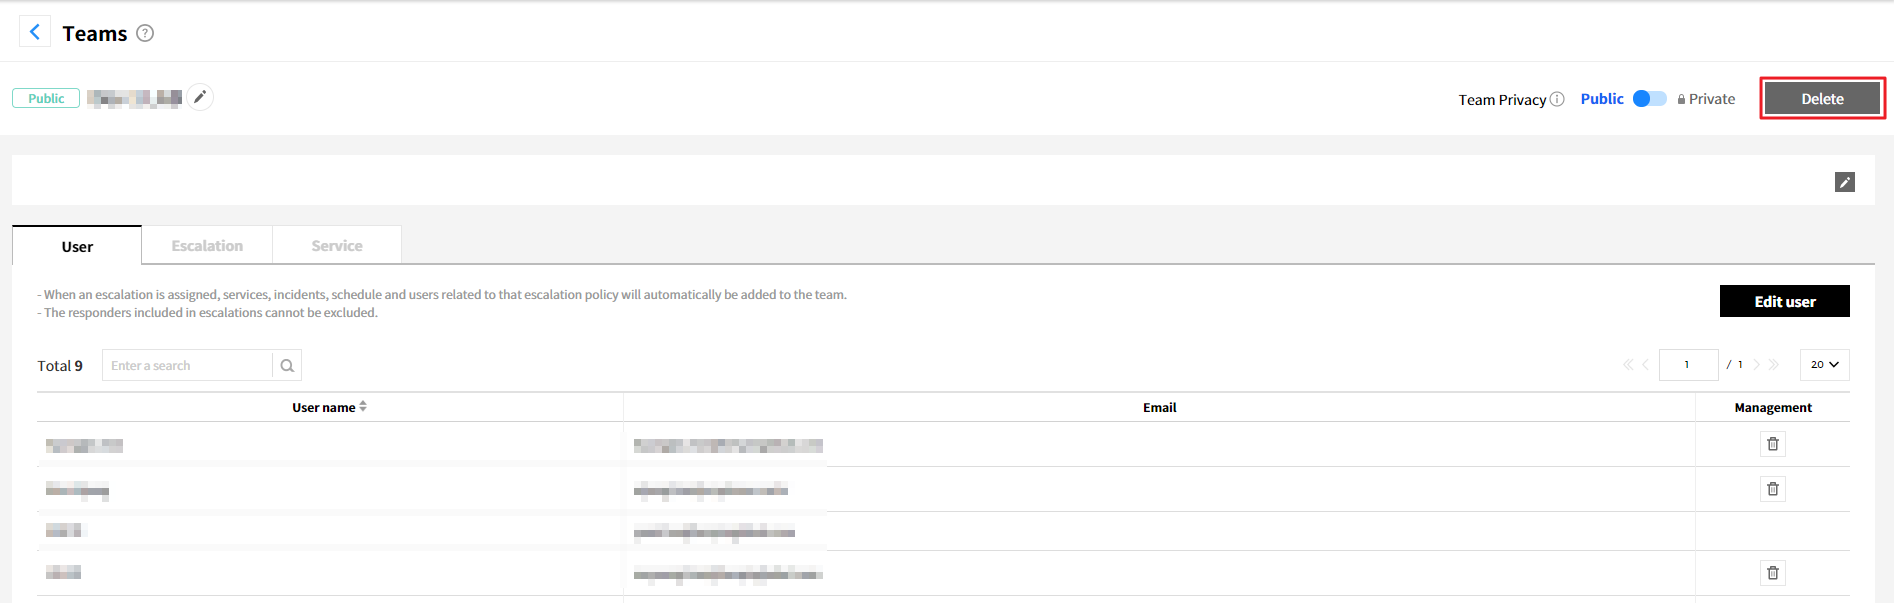
③ Click [Delete] button to delete the team. Users can assign escalation rules included in the existing team to another team before deleting it. If you select a team from [Reassign team to escalations] and click the [Delete] button, the escalation rule assigned to the existing team will be reassigned to the newly selected team.
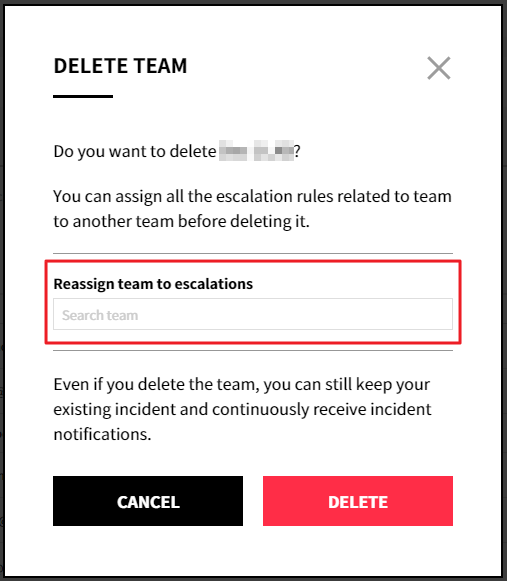
Extensions
Extension allows you to export AlertNow incident-related notifications to external channels or services. AlertNow currently supports Slack, JANDI, and Generic Webhook, and other services will be added soon.
Slack
Add Slack
① Click [Extensions].
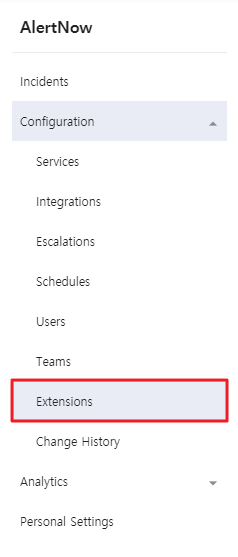
② Click the [Add Extension] button.
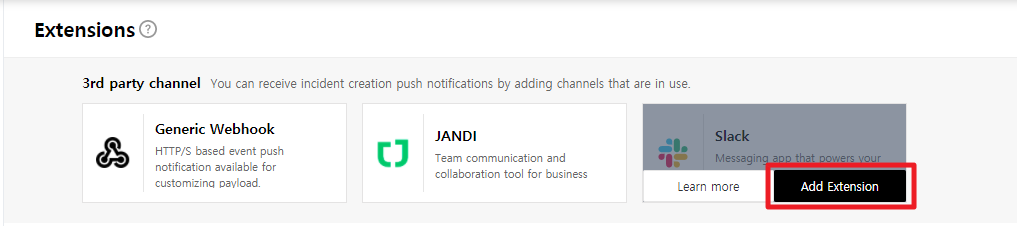
③ Enter the required information below.
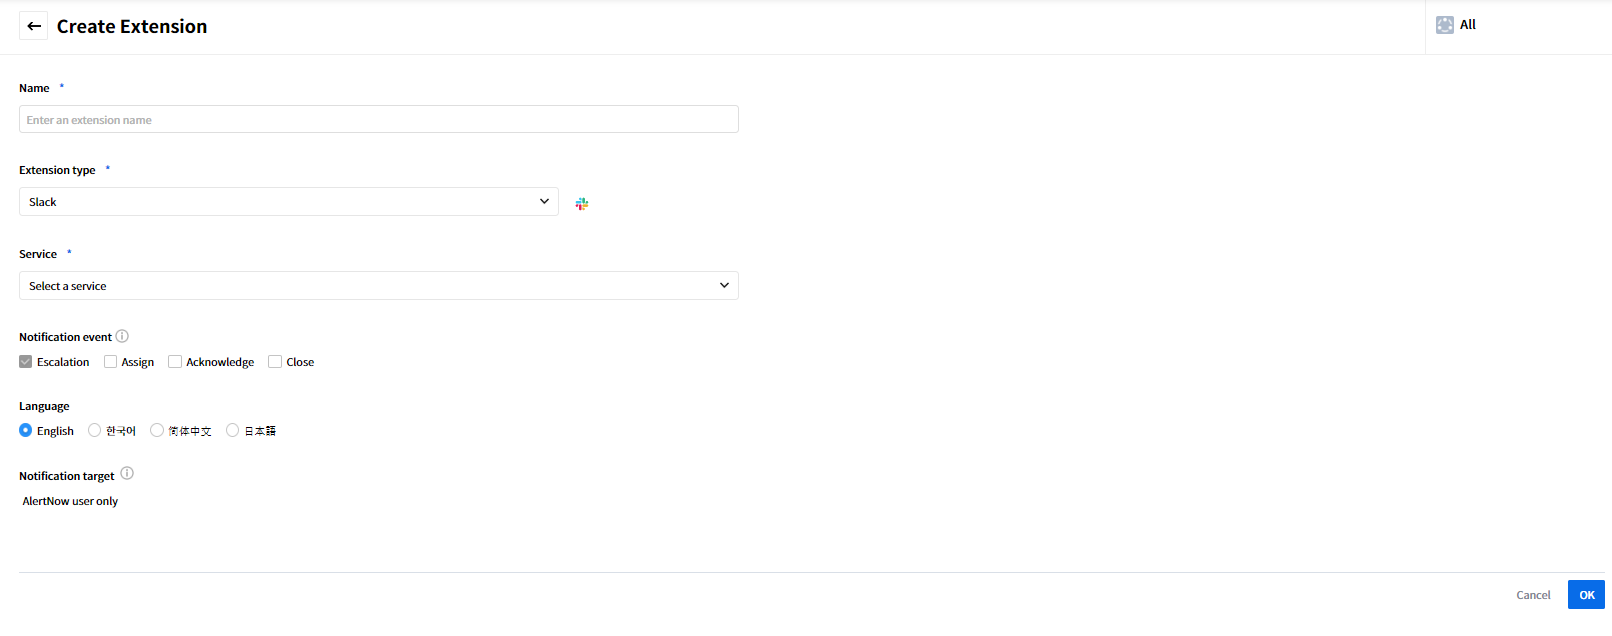
④ The table below provides descriptions of each item.
| Item | Description |
|---|---|
| Name | Enter an extension name. |
| Extension type | Select an extension type. Default is set to Slack. |
| Service | Select a service to be added in the integration. |
| Notification event | Select events to receive incident notifications. |
| Language | Select a language to receive notifications. |
| Notification target | Specify users who can acknowledge or close incidents. Default is set to “AlertNow user only”. |
⑤ Click the [OK] button.
⑥ In Slack channel authorization page, select a channel to post to, and click the [Allow] button.
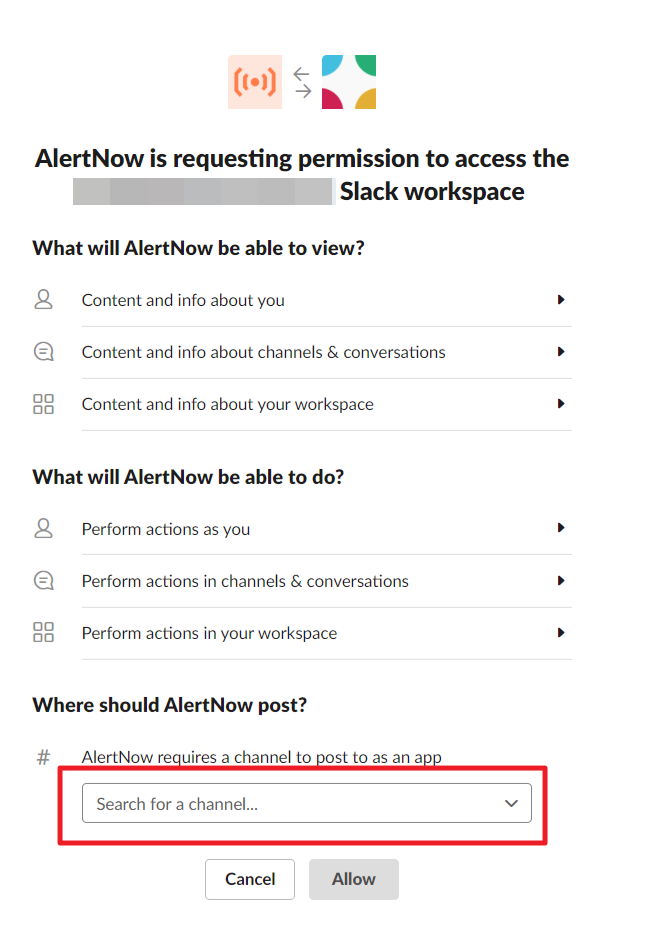
⑦ Extension is added to the service you selected.
📌 Important: A single AlertNow account can be added to a WorkSpace. If another AlertNow account has been mapped to the WorkSpace, you cannot add a new account. To add your account with the mapped WorkSpace, set Run Command as Not Use. However, you cannot run Slack commands, but only receive notifications.
Slack Commands
Users can create, acknowledge, close, or assign incidents within Slack entering commands. Message is updated according to actions taken. The result of the action is posted to the designated channel.
⑴ Run Command Option
To run the command, under the Extension settings, choose Run Command and select Use as shown below.
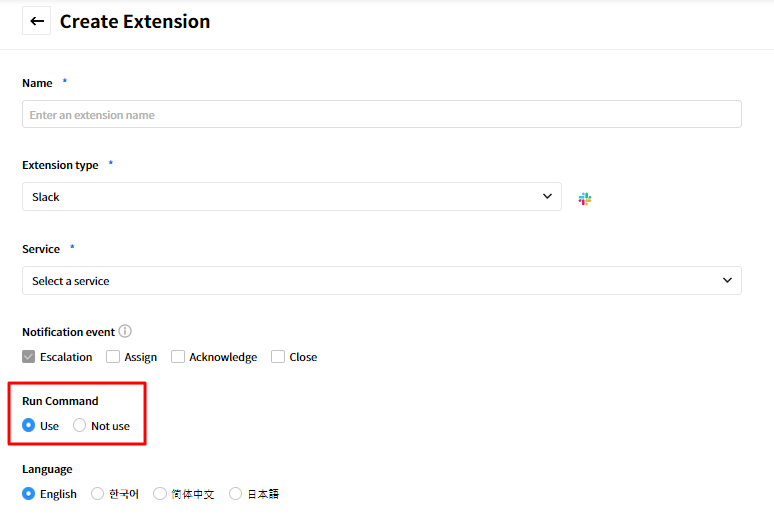
⑵ Available Commands
/an help: Display help message for the command.
/an create: Create a new incident manually.
/an ack [incidentID incidentID2..]: Change the incident status to Acknowledged.
/an close [incidentID incidentID2..]: Change the incident status to Closed.
/an assign [incidentID incidentID2..] to [userID:email]: Assign the incident.
/an list: View a list of incidents that were created in the service.
Generic Webhook
Add Generic Webhook
① Click [Extensions].
② Click the [Add Extension] button.
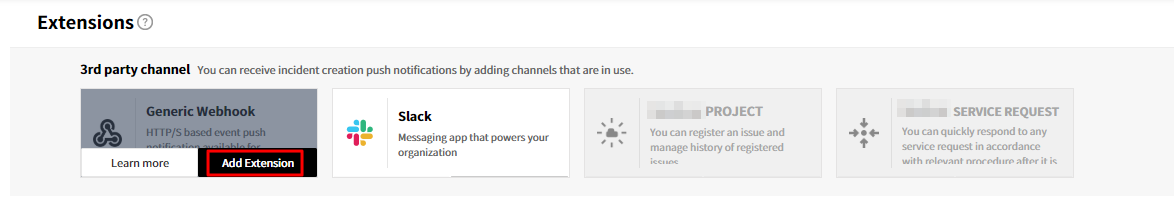
③ Enter the required information below.
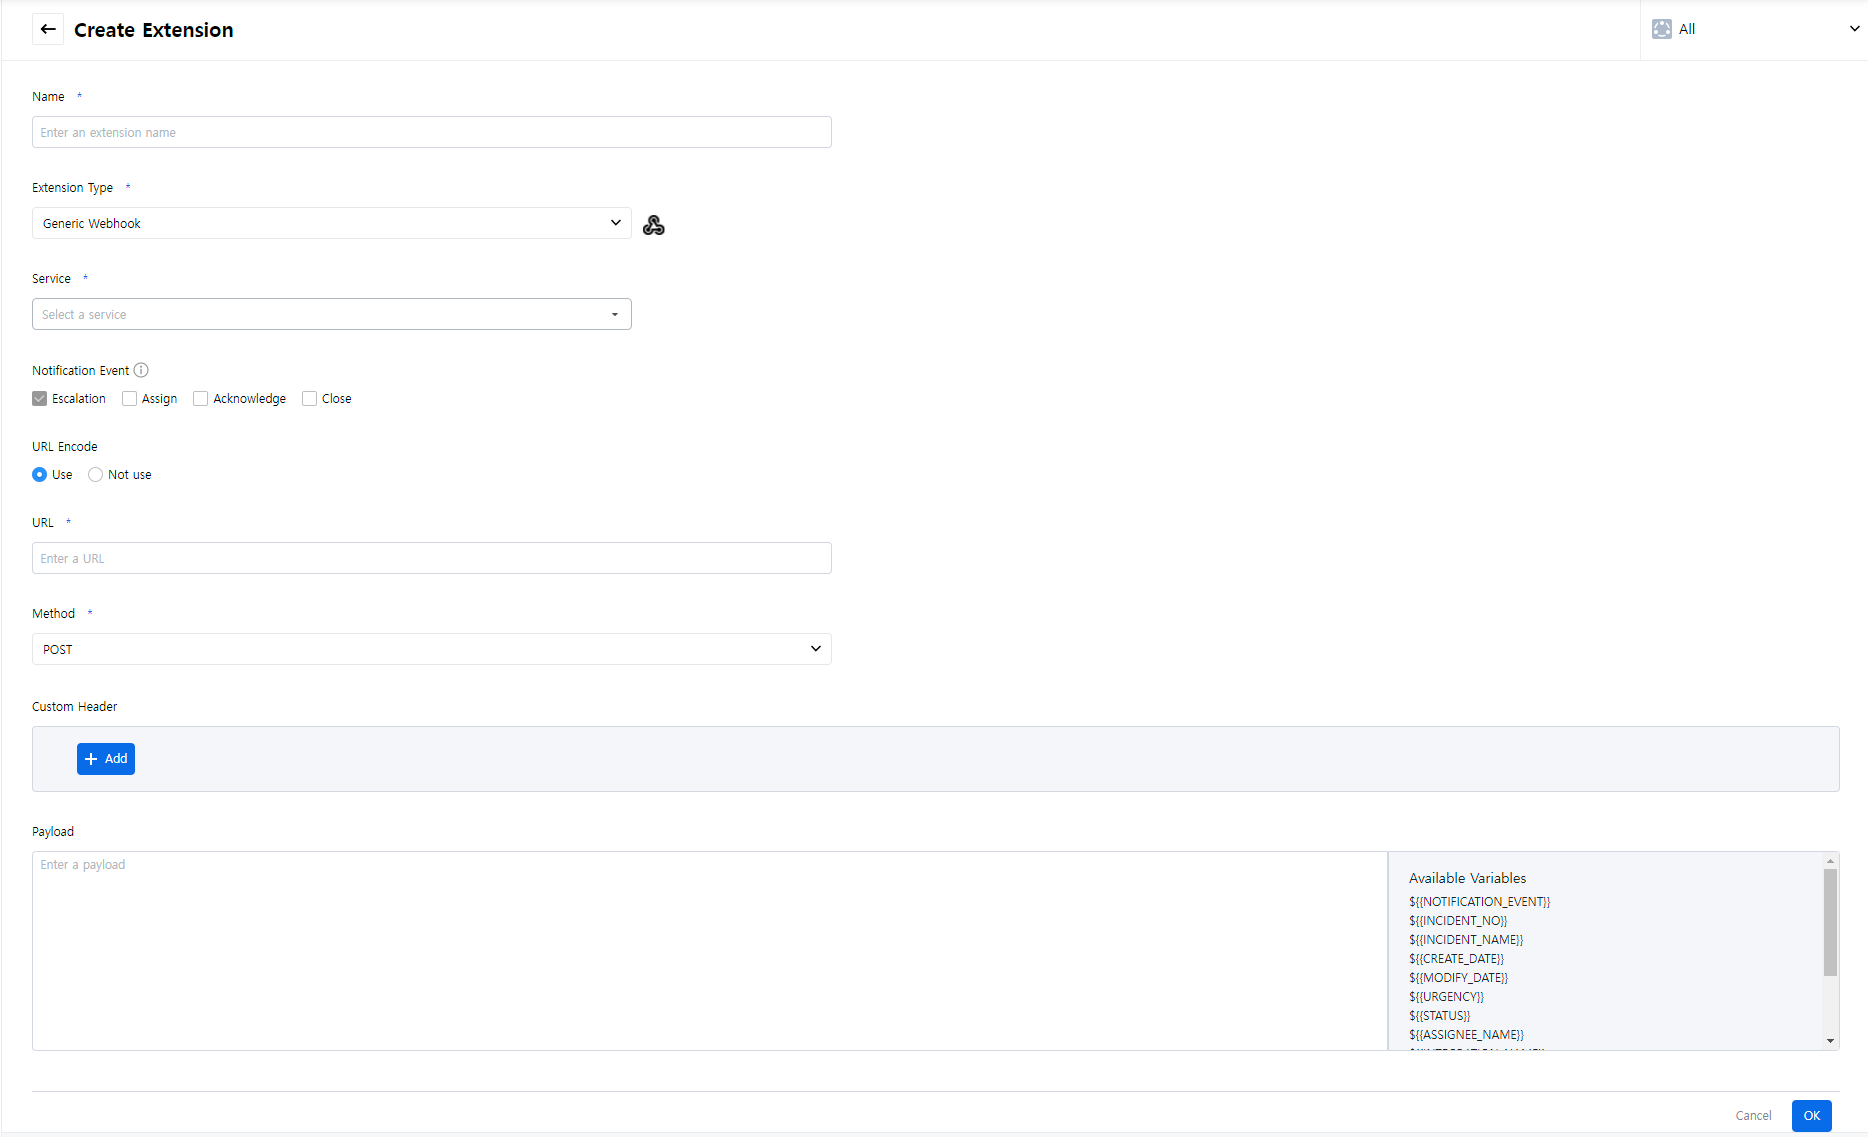
④ The table below provides descriptions of each item.
| Item | Description |
|---|---|
| Name | Enter an extension name. |
| Extension type | Select an extension type. Default is set to Generic Webhook. |
| Service | Select a service to be added in the integration. |
| Notification event | Select events to receive incident notifications. |
| URL | Enter your endpoint URL. |
| URL Encode | Choose whether to use URL Encode when you add a General Webhook. |
| Method | Select a method from POST, PUT, DELETE or GET. |
| Custom Header | To add a Custom Header to your webhook, select + Add. |
| Payload | Configure a payload. |
⑤ Click the [OK] button, and then you can see the added extension.
JANDI
Add Incoming Webhook
① Click [Extension].
② Click the [Add Extension] button.
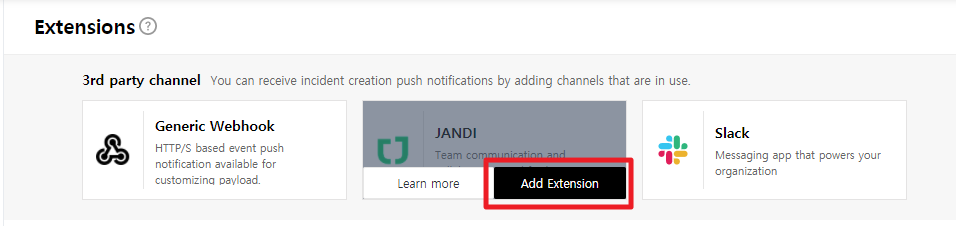
③ Copy the Webhook URL that was created in Incoming Webhook of JANDI Connect, and paste it into the URL field in the Create Extension page.
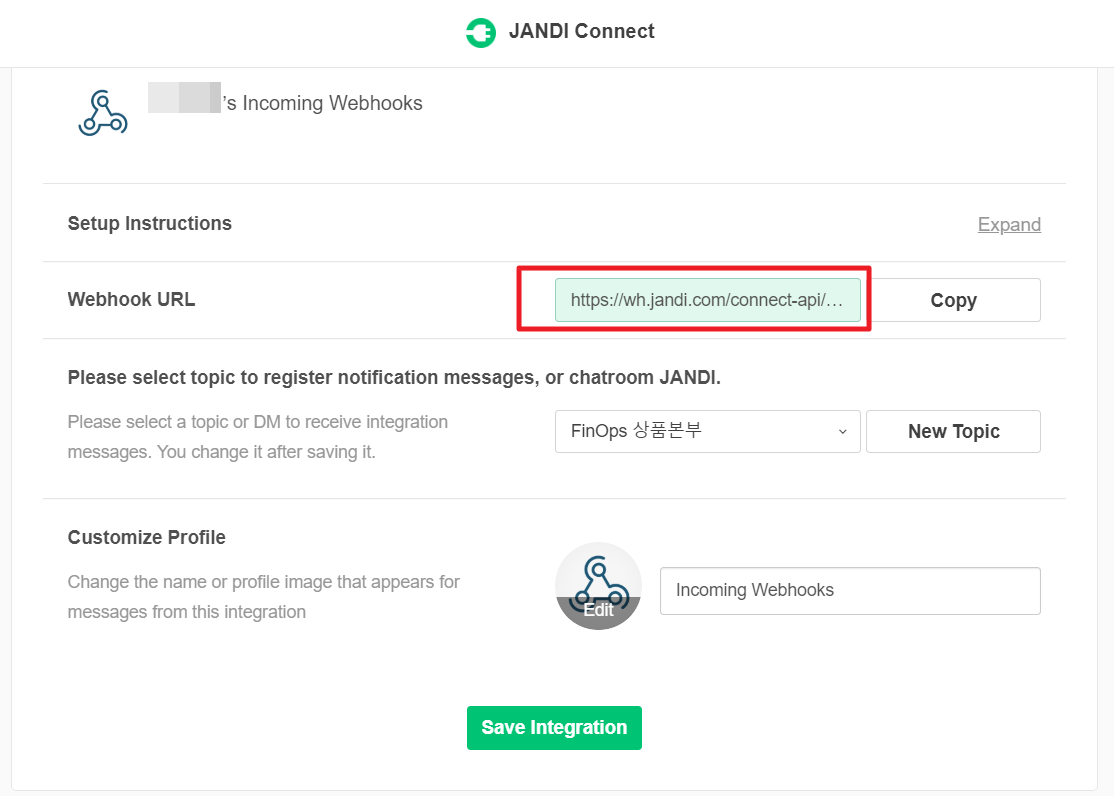
④ Enter the required information below.
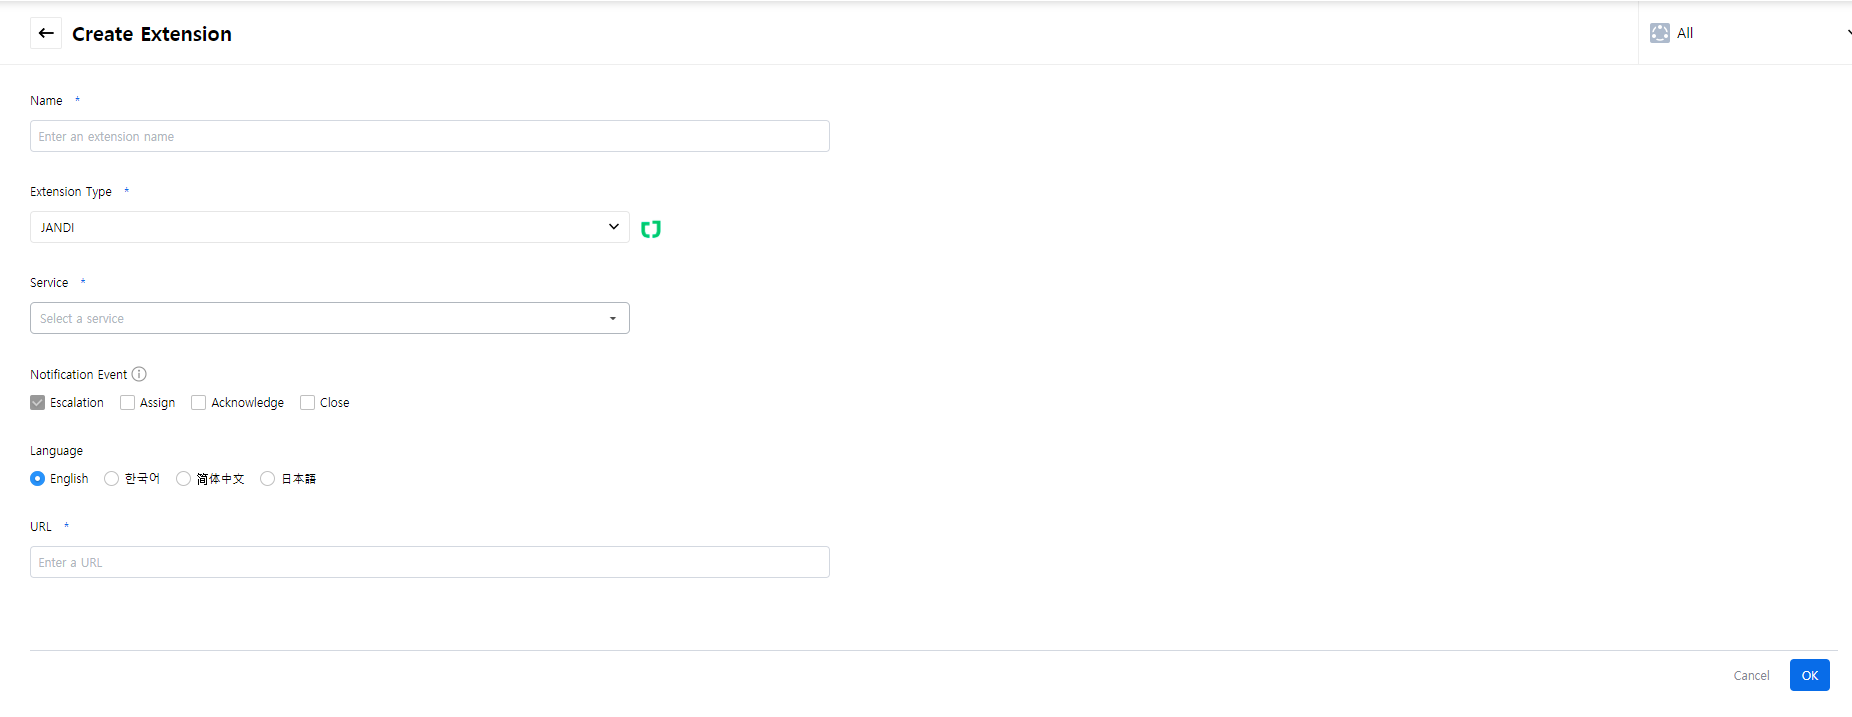
⑤ The table below provides descriptions of each item.
| Item | Description |
|---|---|
| Name | Enter an extension name. |
| Extension type | Select an extension type. Default is set to JANDI. |
| Service | Select a service to be added in the integration. |
| Notification event | Select events to receive incident notifications. |
| Language | Select a language to receive notifications. |
| URL | Enter a Webhook URL created in the JANDI Connect. |
⑥ Click the [OK] button, and then you can see the added extension to the service.
Add Outgoing Webhook
You can directly change the status of incidents you received in Jandi channels.
① Go to Extension -> Extension Settings and tab the detail page of Jandi.
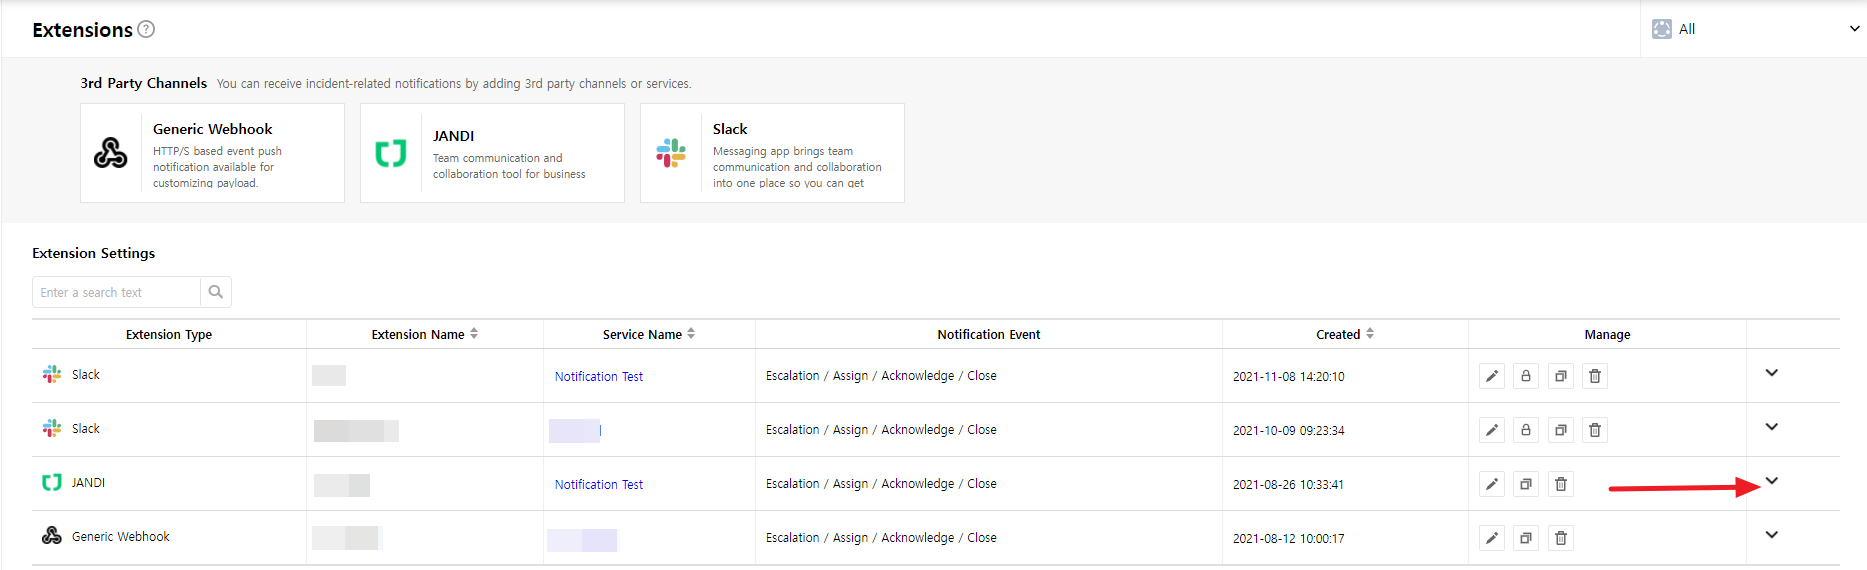
② From the selected extension page, copy the Status Change URL and paste it in the input field of Jandi Outgoing Webhook configuration page.
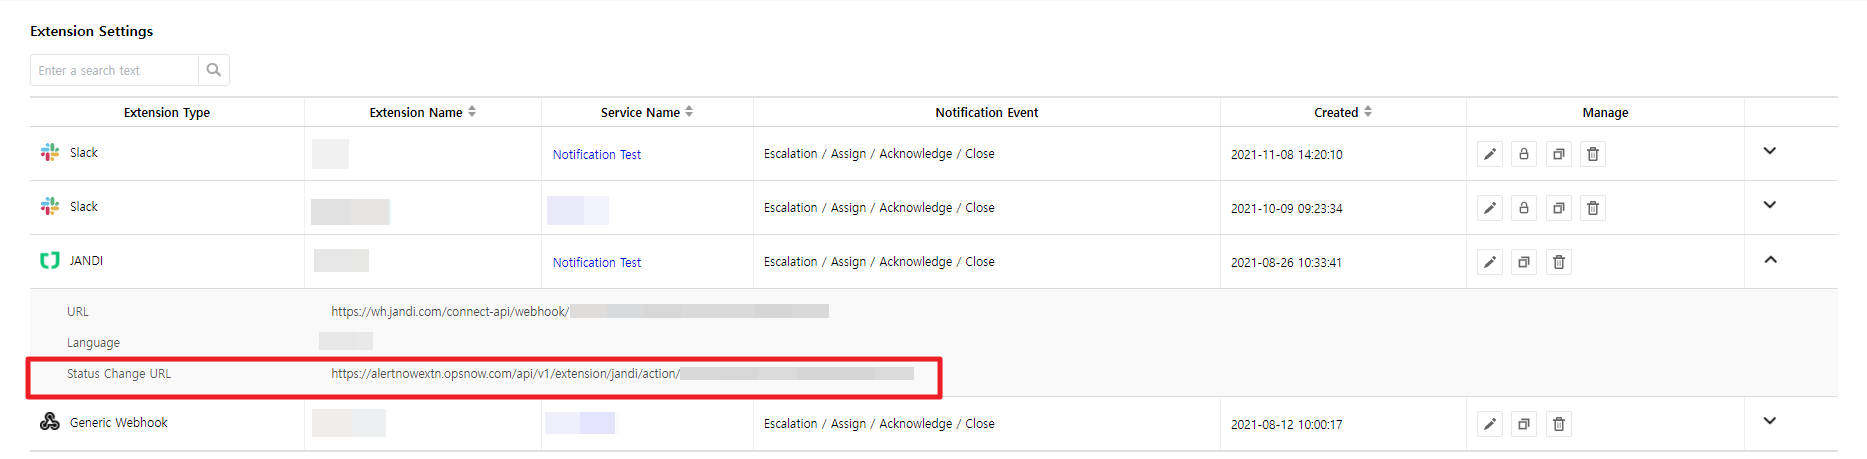
③ Click [Add Integration], and then you see that the Outgoing webhook has been added to your channel.
④ You can directly change an incident status into acknowledge or close in the Jandi channel.
Extension Settings
It allows you to perform the following actions for created extensions. You can modify, copy and delete your extensions in the same way regardless of extension types.
Modify Extension
① Click the [Modify] button in the setting page.
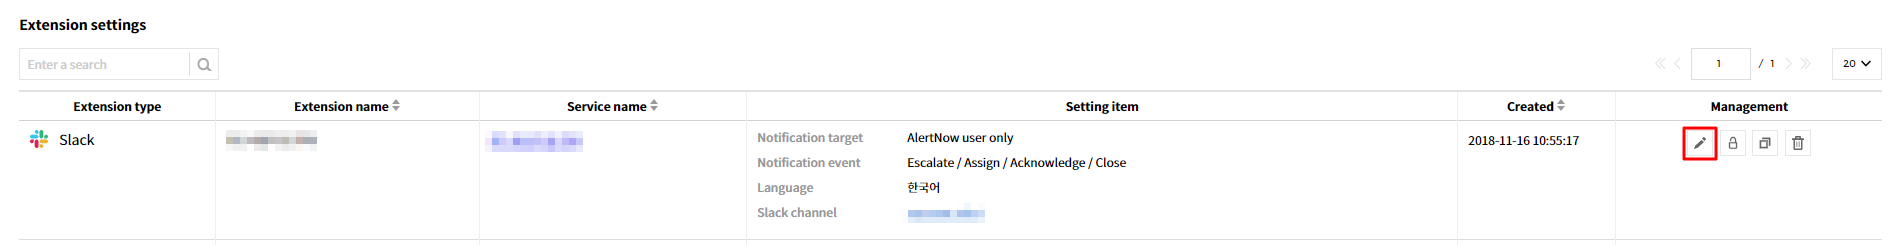
② Change items you want to modify and click the [OK] button.
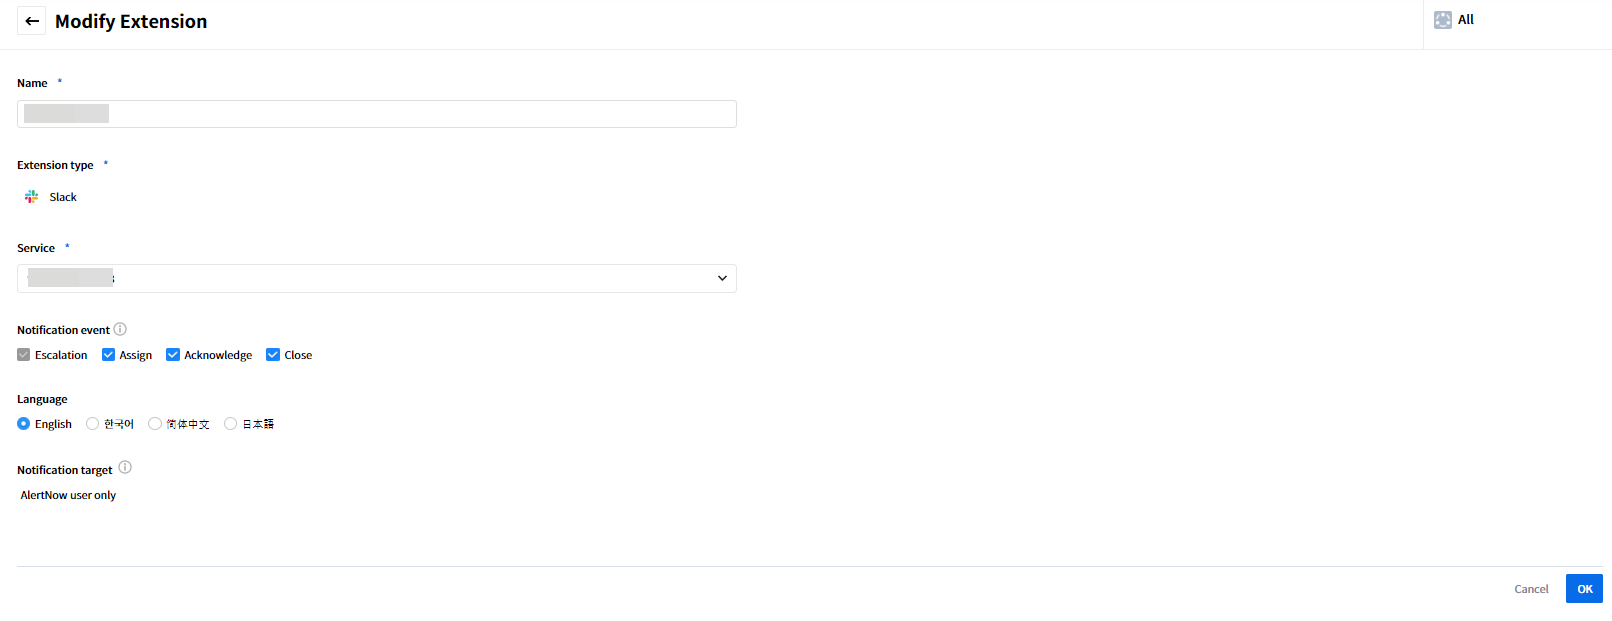
Copy Extension
Copy extensions to other services.
① Click the [Copy] button at the right of the setting page.

② Select a service to copy extension and click the [OK] button. You also need to change an extension name.
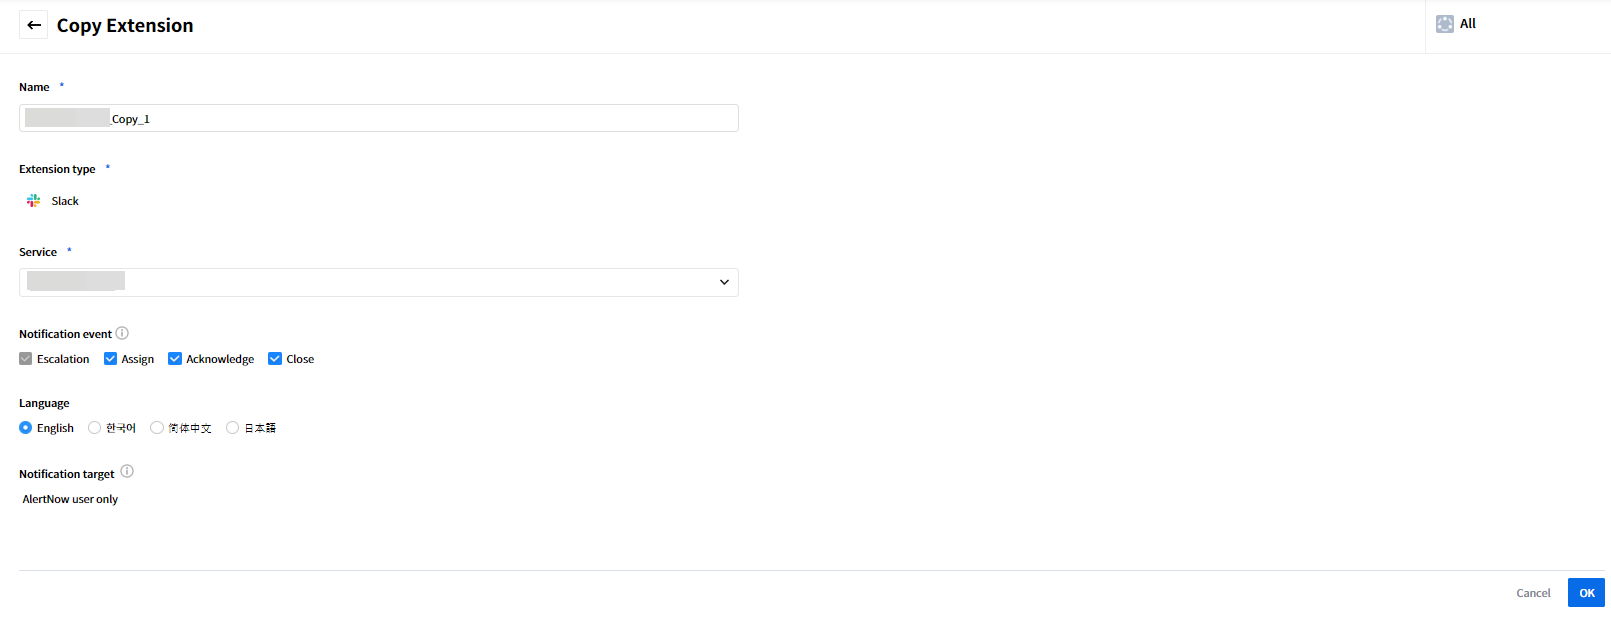
③ In Slack channel authorization page, select a channel to post to, and click the [Allow] button.
④ You can see the same extension in the service list you reset.
Delete Extension
① Click the [Delete] button at the right of the setting page.
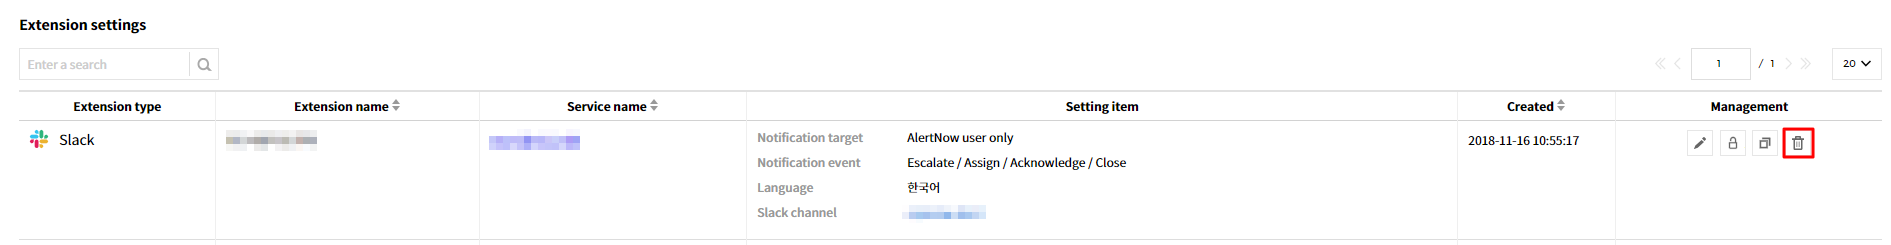
② In delete extension page, click the [OK] button to delete an extension.
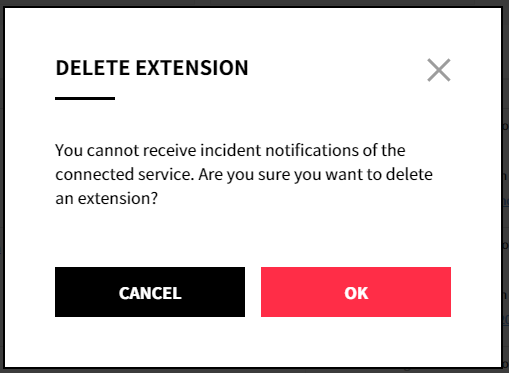
Re-authorize Extension
Re-authorize Extension only applies to Slack, and to change Slack channel, you must authorize the Slack channel again.
① Click the [Re-authorize] button at the right of the setting page.

② In Slack channel authorization page, change the channel and click the [Allow] button.
③ You can see the changed channel in Slack channel of the setting item.
Notice Template
When sending a notice via SMS by manually creating an incident, you can set repetitive text structures in advance using the Notice Template.
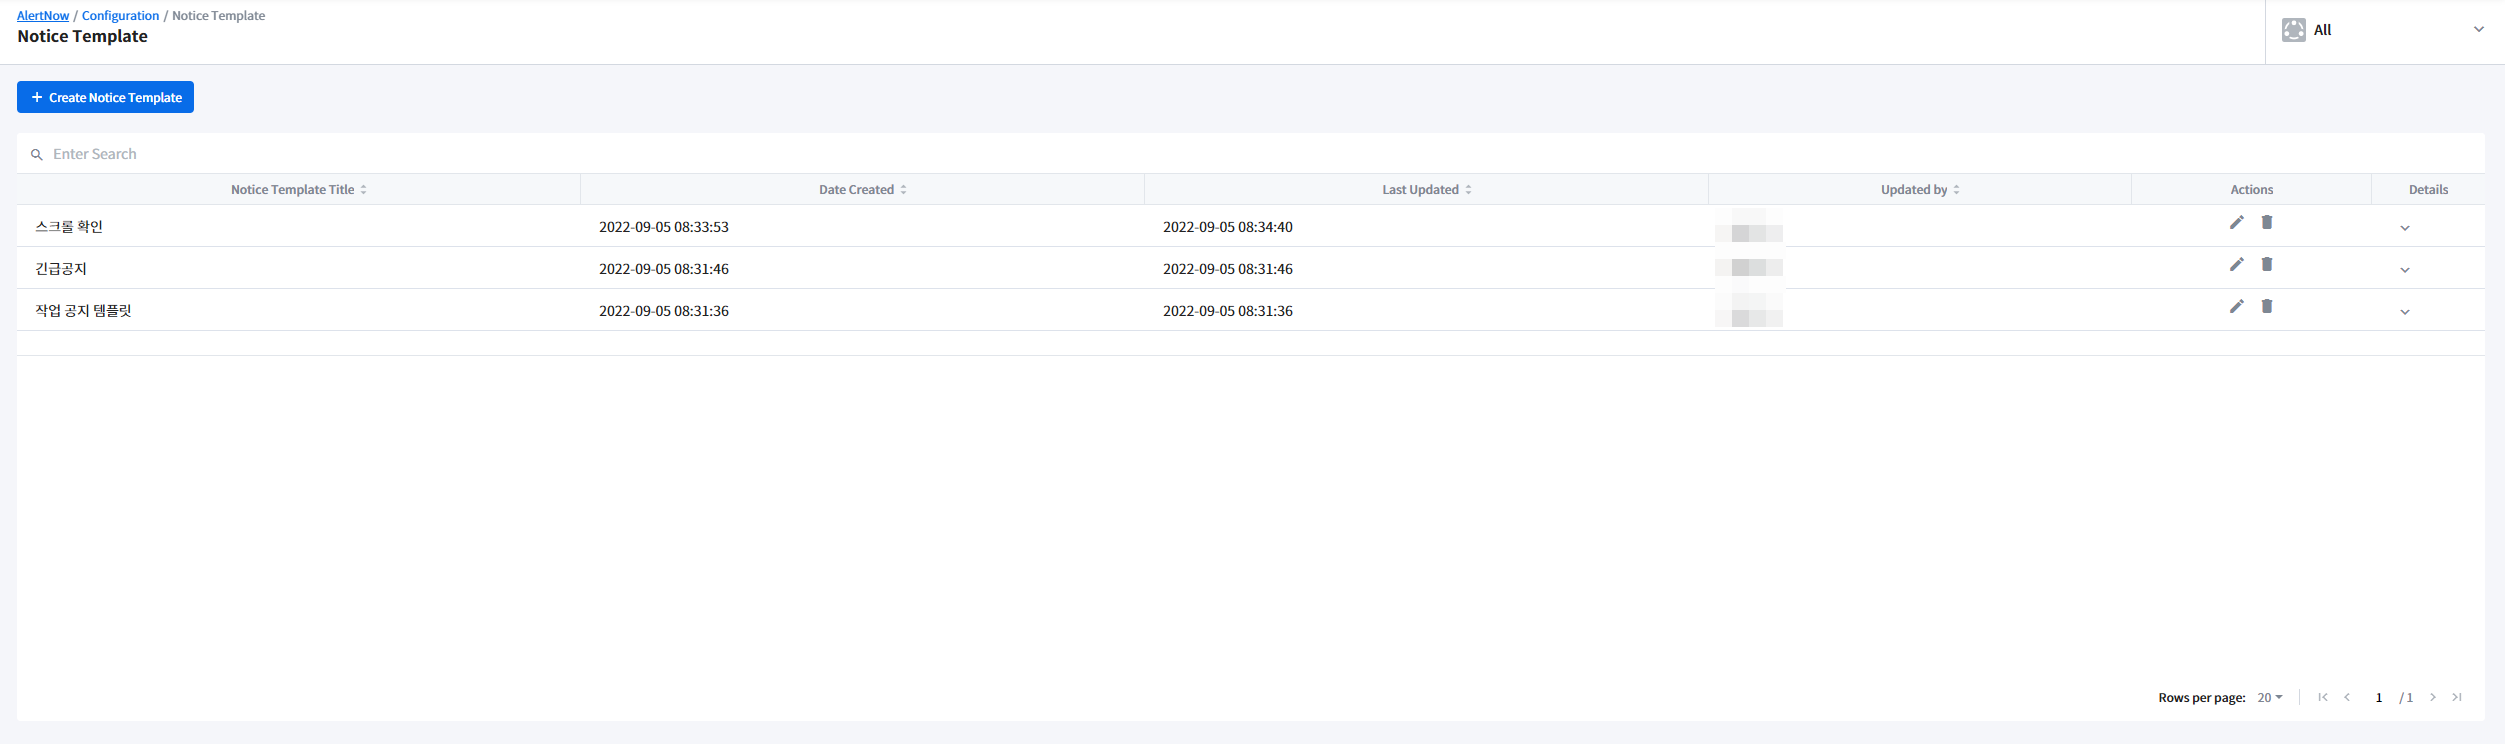
Create a notice template
① Go to Settings > Notice Template on AlertNow.
② Click + Create Notice Template on top left.
③ Fill out the title and content of the template. The entry cannot exceed 140 bytes. The SMS to be sent will only include the content, not the title.
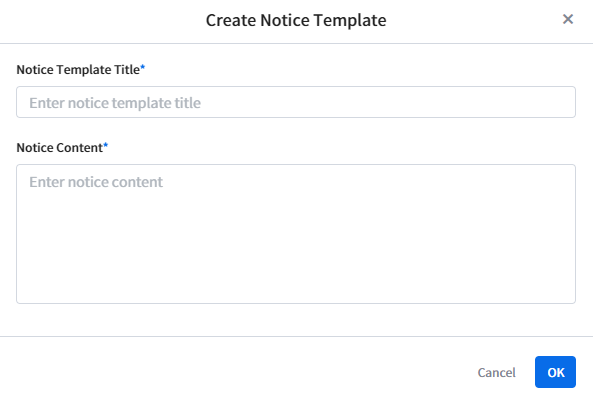
④ Click OK to create the notice template. You can check it on the list.
Send a notice via SMS using a template
To send a notice via SMS, you should create an incident first.
① Go to Incidents on AlertNow.
② Click Create Incident on top left.
③ Fill out the fields on the pop-up window and scroll down.
📜Note
Check out the description of each field on the pop-up window on the Create Incident Manually section of this guide.
④ Select the Send Notice checkbox, and select a notice template created in advance. You can modify the content of the notice on the pop-up window. Or, you can write a notice from scratch without selecting a template.
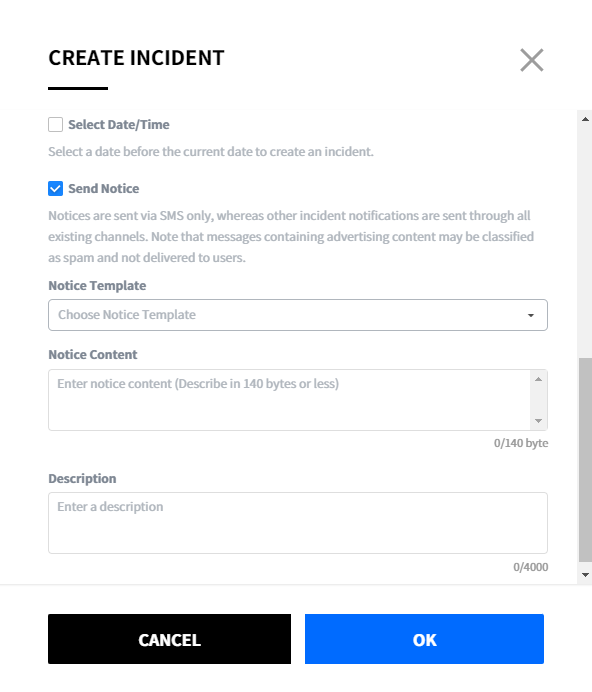
⑤ Click OK to send out the notice via SMS to users you selected.
⚠️Attention
Notice-type incidents are closed as soon as they are created, which is why they affect MTTA and MTTR. Therefore, it is recommended for you to create a dedicated service for notices.
Change History
Change History lists the changes made to AlertNow service, who made the changes, and when each change was made. It also allows you to check all change histories for the selected period, and filter the results by the service type or change type.
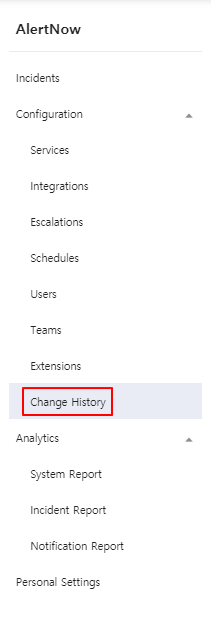
Change History Configuration
It allows you to check all of changed histories for the selected period, and filter the history logs by the service type or change type.
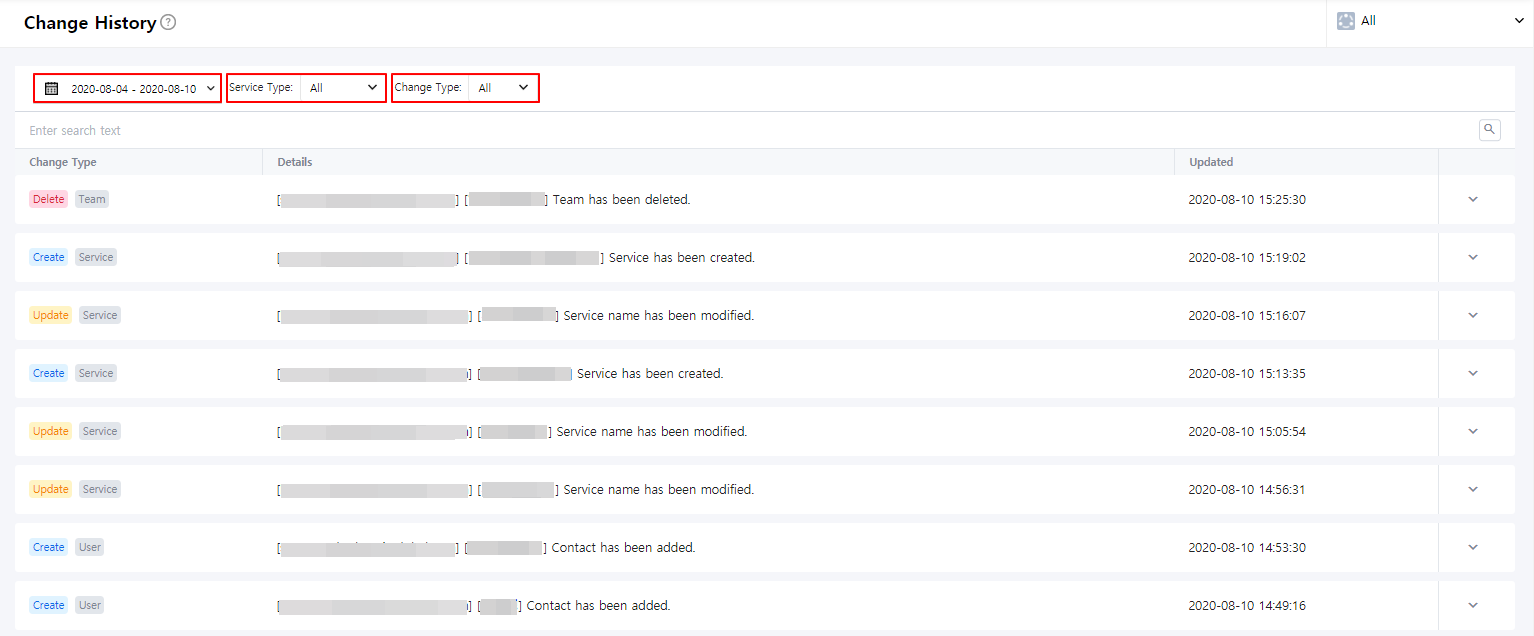
| Item | Description |
|---|---|
| Select Period | Select the period to view change histories. You can select a period from Recent 1 Week, Recent 1 Month, Recent 3 Months, or Custom options. |
| Service Type | Filter the change histories by service type. |
| Change Type | Filter the change histories by change type. |
| Details | Display the detailed information about change histories. |
| Updated | Display the date and time of changes made. |
Notification History
Notification History provides a history of SMS and Voice calls sent by AlertNow. At the top of the page, you can see the total number of notifications offered and used by your company. You can also check the notification history sent by users in the table.
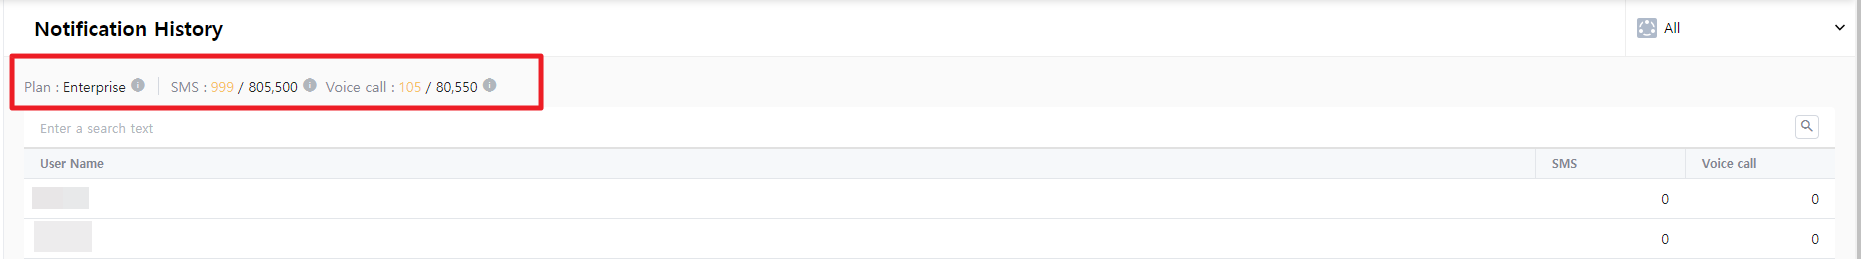
Report
System Report
System Report visualizes incident-related data via graph and table. It helps you to analyze failures more efficiently and measure performances. Thus, the report contributes to improving the service quality.
With the system report, users can check the number of incidents by escalation and service, average time to acknowledge and close incidents, and the number of escalated incidents at a glance. In addition, you can check a list of incidents belonging to the selected services and escalations, and download the information about selected incidents in a CSV file.
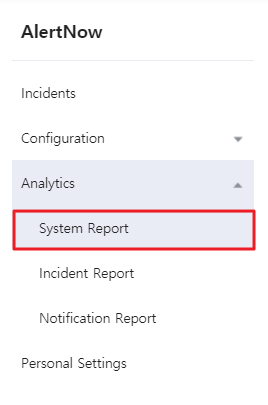
System Report Configuration
For system reports, you can check incident data by service and escalation.
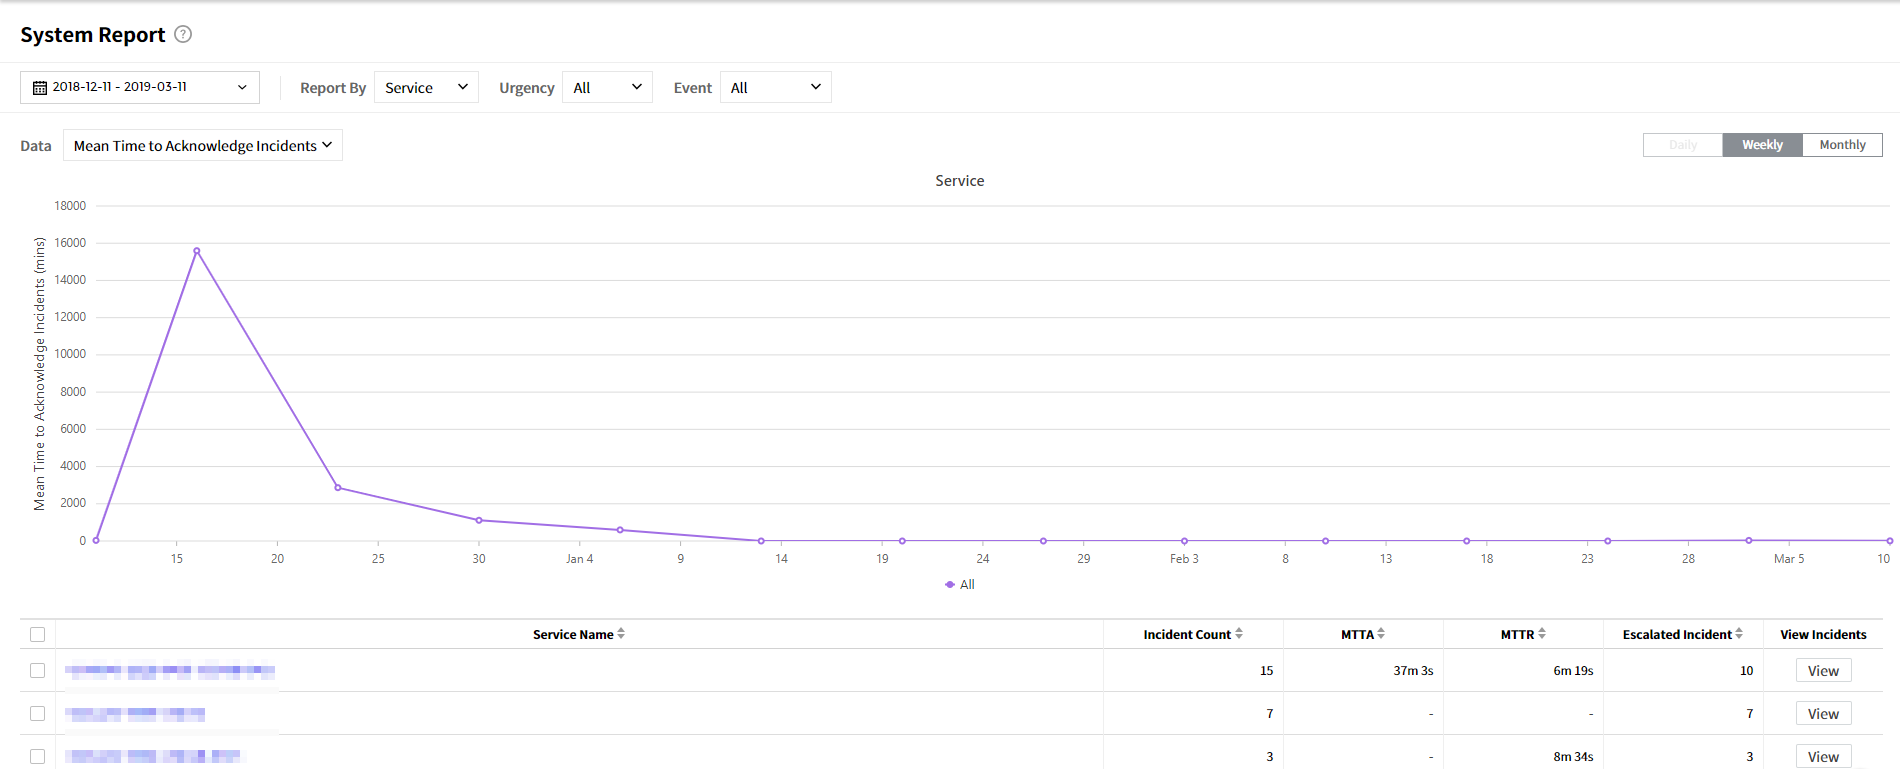
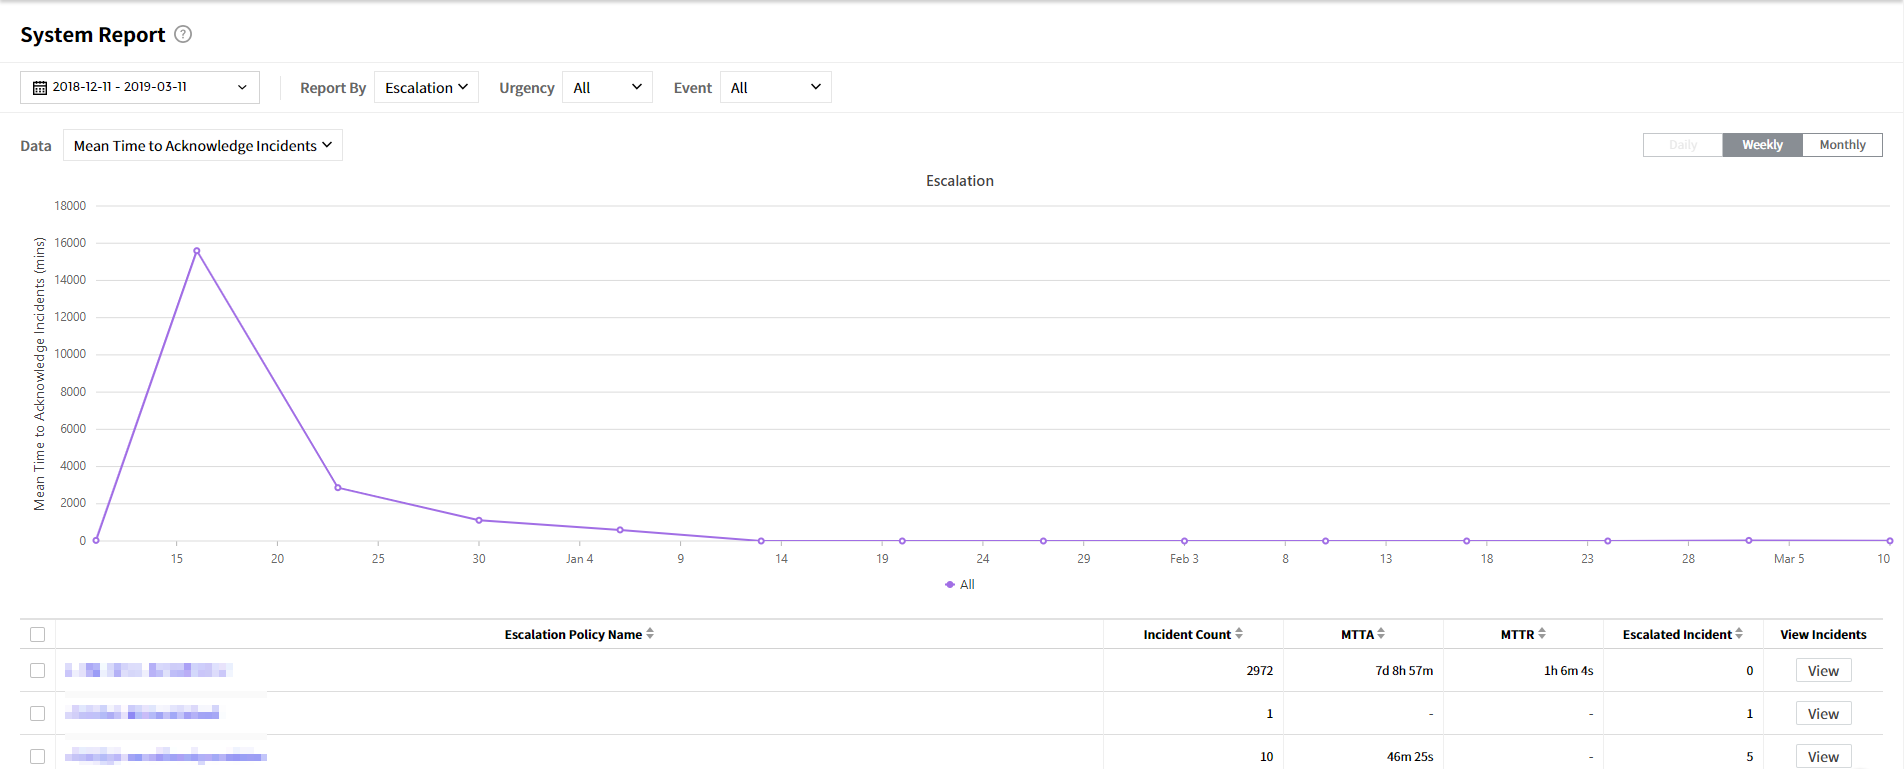
Graph
① Select Periods: Select the period to view the report. You can select a period from Recent 1 Week, Recent 1 Month, Recent 3 Months, or Custom options.
② Report By: Select the menu to view report by Escalation or Service.
③ Data: Select the data to display on a graph. You can check the number of incidents and the average time to acknowledge and close incidents.
④ Urgency: You can see the incident data by urgency, All is selected by default.
⑤ View report options: You can set the x-axis on a daily, weekly, or monthly basis.
⑥ Event: You can check a list of services and escalations by each of the following items.
- Escalated: Display a list of escalated incidents
- Reassigned: Display a list of incidents which assignee has been changed
- Still Open: Display a list of opened incidents
Table
① Escalation/Service: A list of escalations and services will be displayed. If you click the name, the details of escalation or service will be displayed.
② Incident Count: Display all of the incidents for the selected period.
③ MTTA (Mean Time to Acknowledge): Average time from opening to acknowledging incidents.
④ MTTR (Mean Time to Resolve): Average time from acknowledging to closing incidents.
⑤ Escalated Incident: Display the number of incidents that are escalated until the incidents closed.
⑥ View Incidents: Click the [View] button to go to the incident details page.
- Select the checkbox on the left of the table to view the incident data for selected services and escalations.
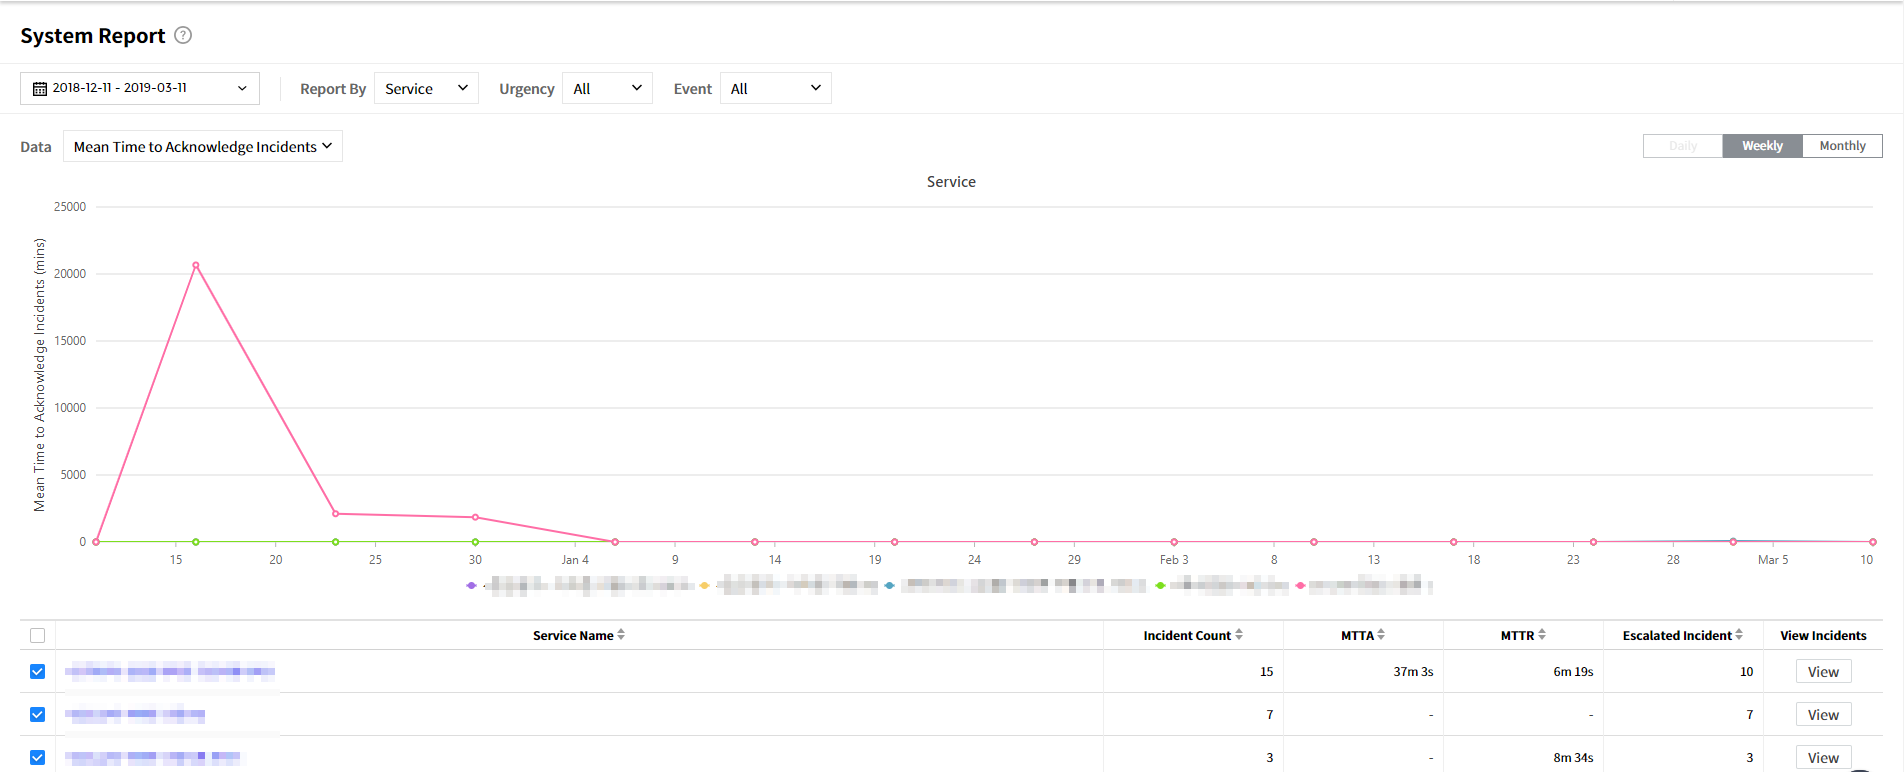
View Incidents
In the incident detail page, you can check a list of incidents of selected services and escalations, and download the incident data in a CSV file. Click the [View] button in a report table to go to the incident detail page.
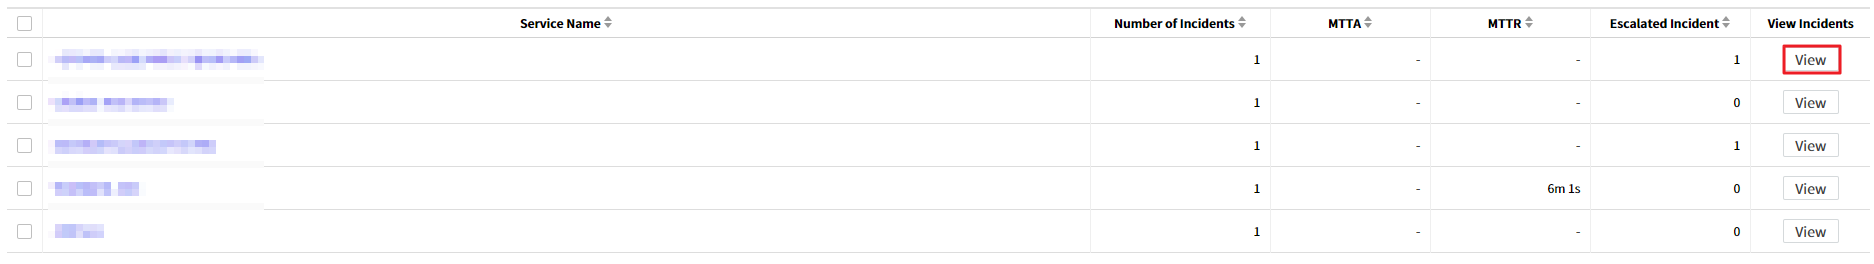
⑴ The detail page is consisted of the following items:
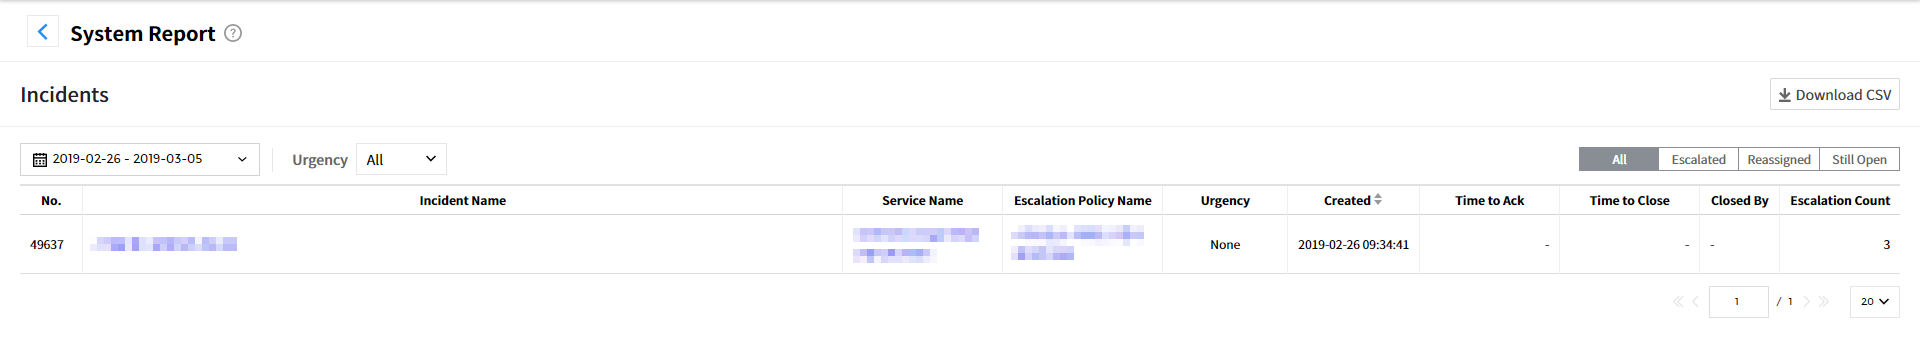
| Item | Description |
|---|---|
| No. | Incident number is displayed. |
| Created | The created time of incidents is displayed. |
| Time to Ack | The time from opening to acknowledging incidents is displayed. |
| Time to Close | The time from acknowledging to closing incidents is displayed. |
| Closed By | The user who closed the incident is displayed. |
| Escalation Count | The escalated incident count is displayed. |
⑵ Click the [Download CSV] button to download the incident data.
Display items in CSV file
① Incident No.: Incident number
② Incident/Service/Escalation Policy Name: Names of incident, service, and escalation
③ Created: The date and time of incidents created
④ Closed: The date and time of incidents closed (It will be displayed as “-” if it is not closed)
⑤ Time to Acknowledge/Close: The time to acknowledge and close incidents (Displayed in seconds)
⑥ Acknowledged/Closed by: The user who acknowledged/closed incidents
⑦ Auto Closed: Displays whether the incident has been automatically closed (in Y/N)
⑧ Escalation Count: The number of incidents escalated
⑨ Assignment Count: The number of incidents assigned
⑩ Assignee: The one who is in charge of handling incidents
⑪ Urgency: Displays incident urgency
Incident Report
Incident Report enables you to gain insights by analyzing incident trends and providing metrics based on service, integration, and urgency. It helps you to predict the occurrence of incidents based on old data and prevent the occurrence of incidents by service in advance. Incident Report enables you to check the number of incidents and alerts occurred for the selected period and view the overall incident analysis chart and data.
Start by clicking Analytics > Incident Report.
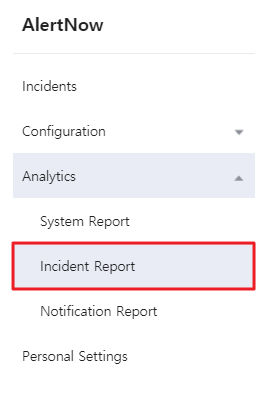
Incident Report Configuration
Incident Report allows you to check the metrics for a selected period such as total number of incidents opened, number of still opened incidents and number of alerts occurred. In addition, you can check the incident charts by service, integration, urgency, the incident trend, and the trend of both open and acknowledged incidents.
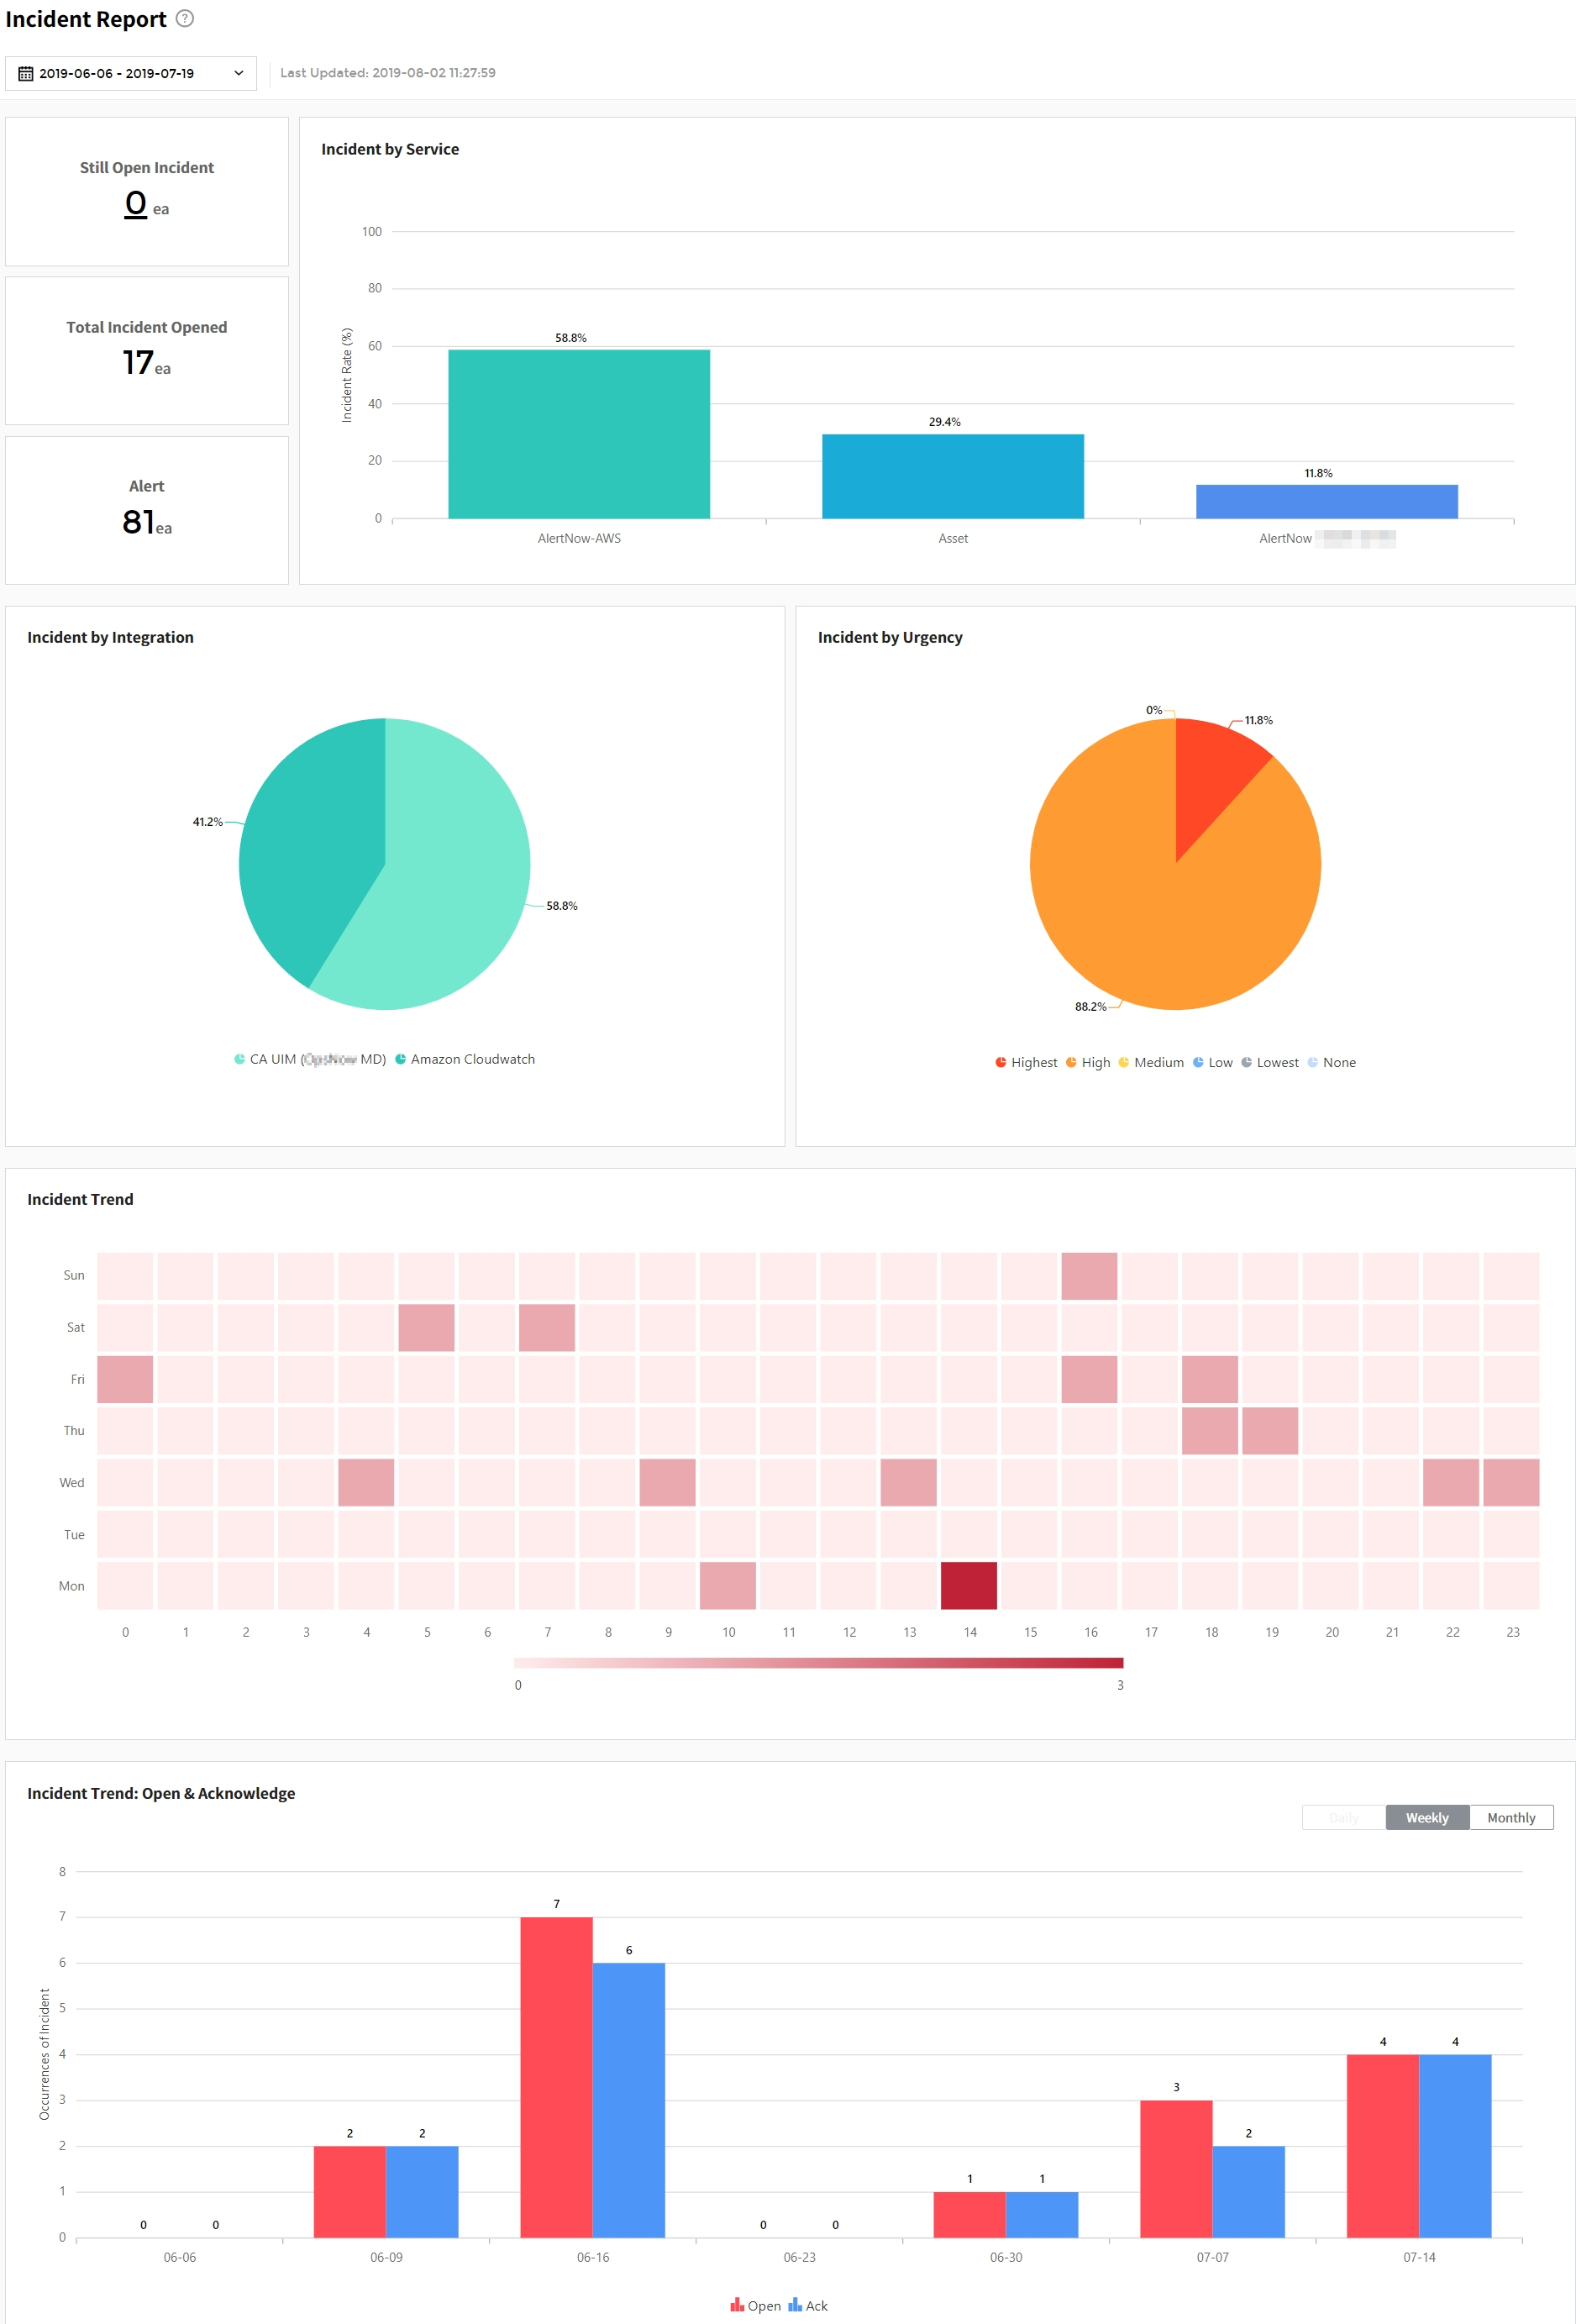
Graph
① Select Period: Select the period to view the report. You can select a period from Recent 1 Week, Recent 1 Month, Recent 3 Months, or Custom options.
② Incident by Service: This bar chart shows the occurrences of incident by service for the selected period. The x-axis represents the service and the y-axis represents the incident rate.
③ Incident by Integration: This pie chart shows the occurrences of incident by integration for the selected period.
④ Incident by Urgency: This pie chart shows the occurrences of incident by urgency for the selected period. Urgency is divided into 6 types: Highest, High, Medium, Low, Lowest and None.
⑤ Incident Trend: This chart shows the incident trend for the selected period. The x-axis represents the time ranging from 0:00 to 23:00 and y-axis represents the day of the week. It also shows the occurrences of incidents ranging from 0 to 9 with brightness variations.
⑥ Trend of Incident Open & Acknowledge: This bar chart shows the trend of open and acknowledge incidents for the selected period. The x-axis represents the date and y-axis represents the number of incidents occurred. You can set the x-axis on a daily, weekly, or monthly basis. Duration of the following table varies based on an option selected. Daily option becomes inactive when the duration is set to 35 days or more.
Table
① Duration: Displays the duration depending on selected options from daily, weekly or monthly.
② Incident Count: Displays the total incidents for the selected period.
③ View Incidents: Click the [View] button, it goes to the incident details page.
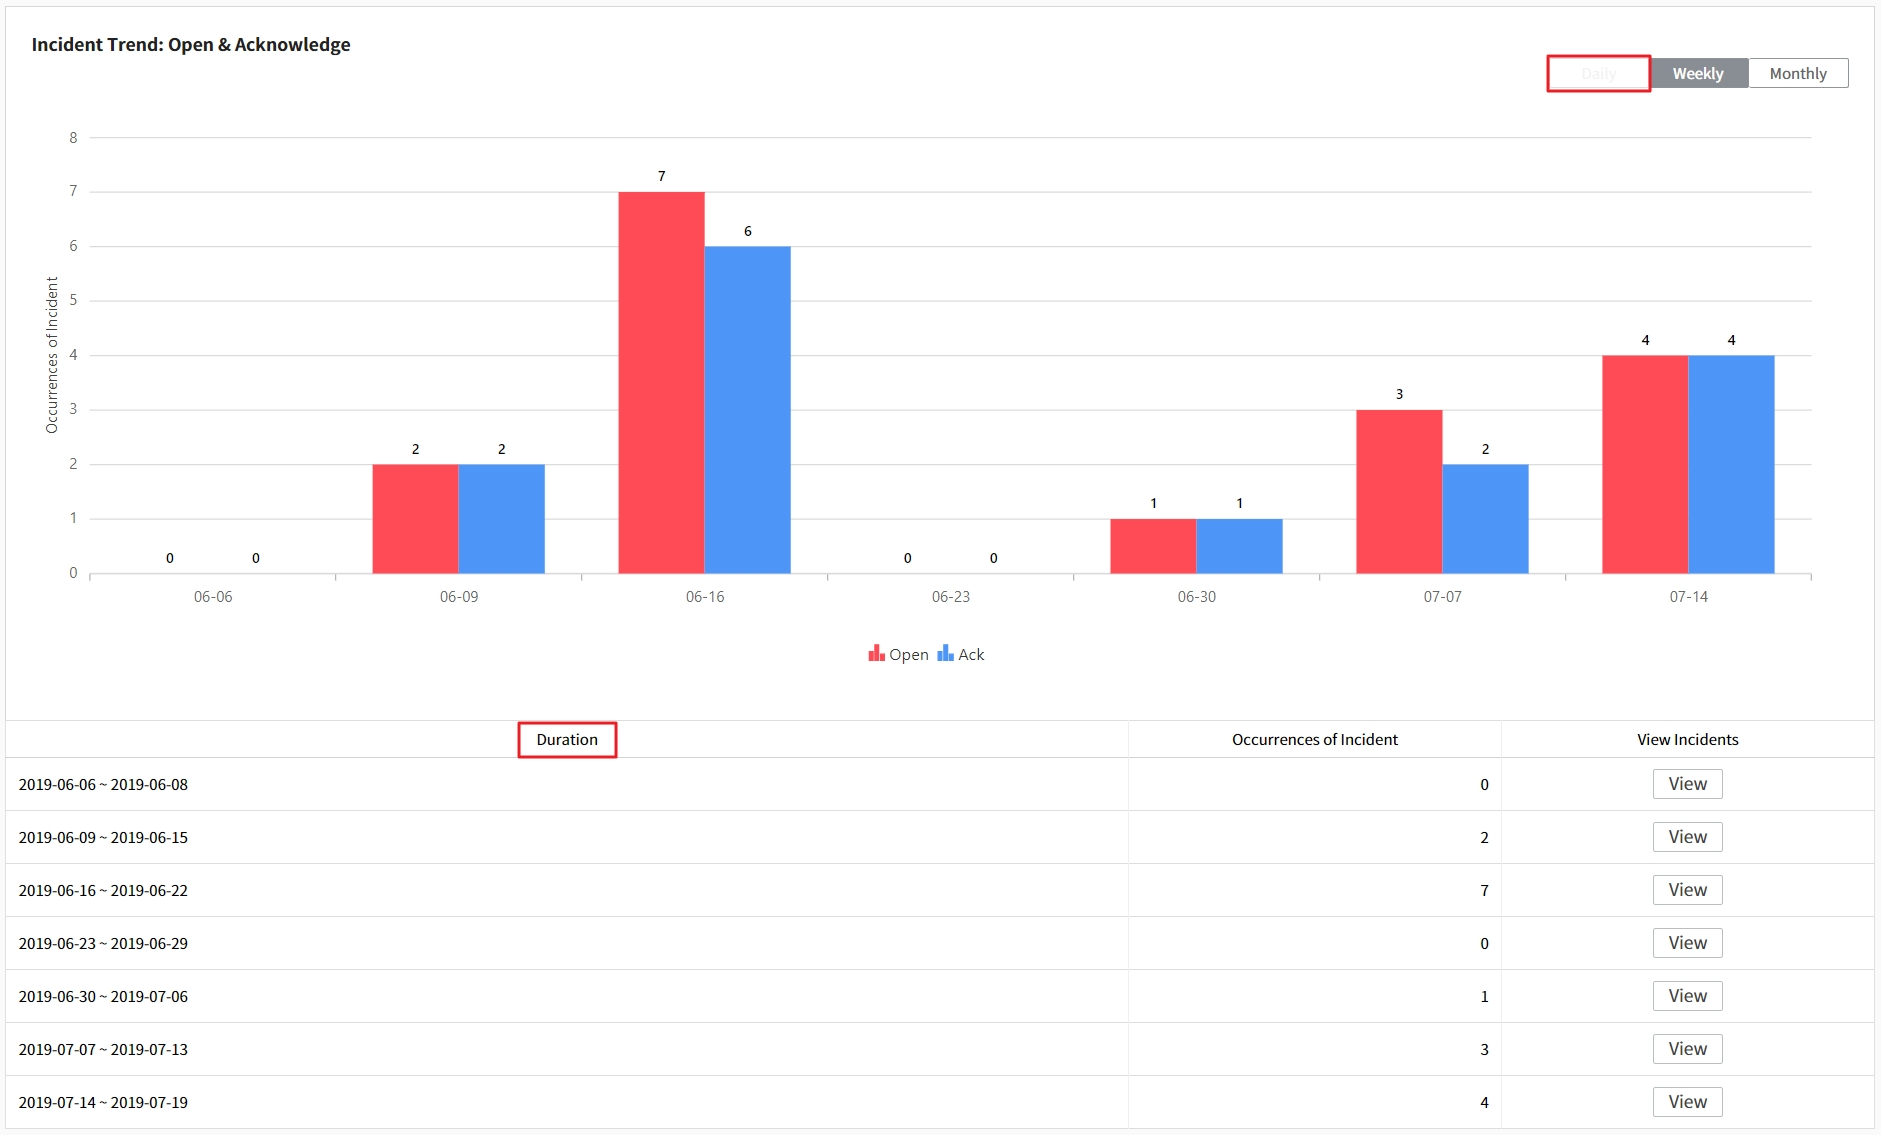
View Incidents
From the incident details page, you can check a list of incidents for the selected period, and download the incident data in a CSV file. Click the [View] button in a report table to go to the incident details page.
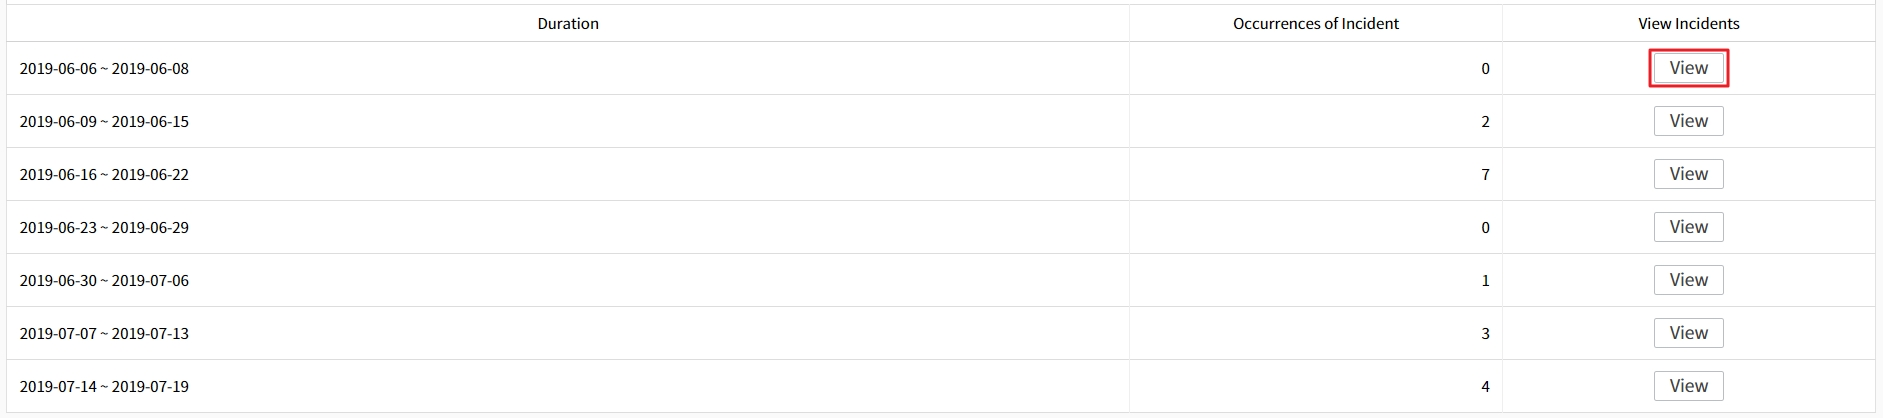
It consists of the following items:
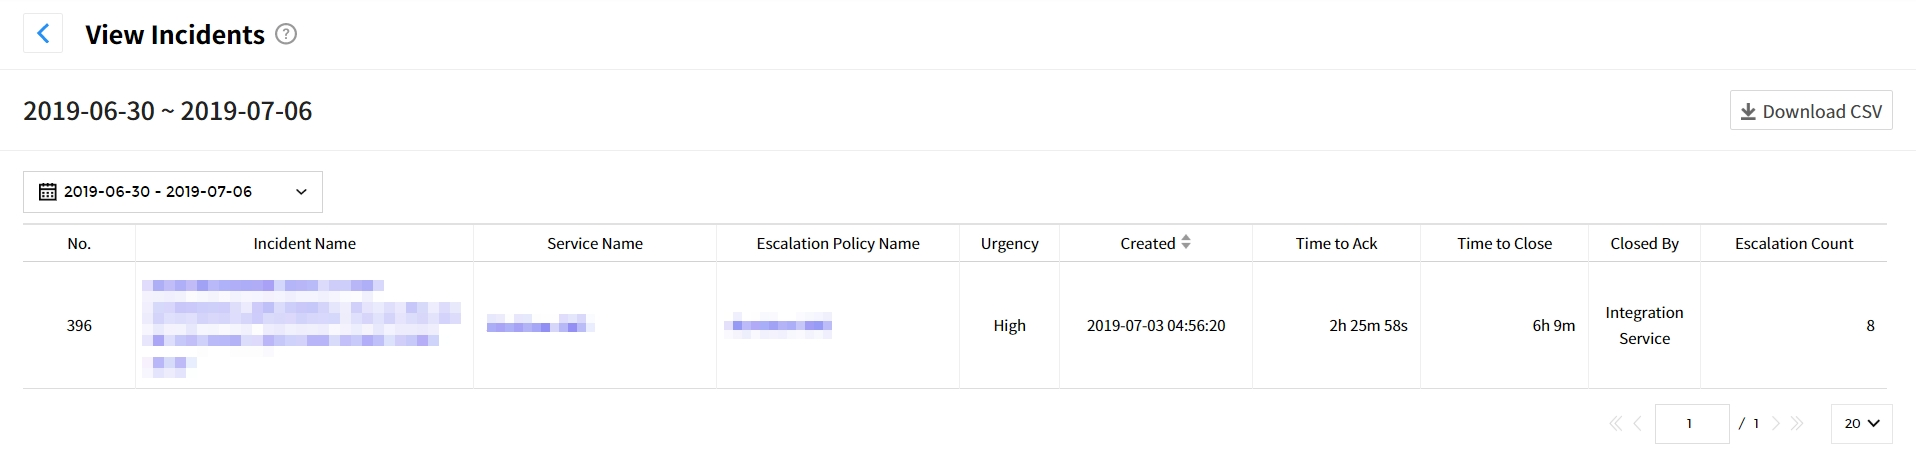
| Item | Description |
|---|---|
| No. | Incident number is displayed. |
| Created | The created time of incidents is displayed. |
| Time to Ack | The time from opening to acknowledging incidents is displayed. |
| Time to Close | The time from acknowledging to closing incidents is displayed. |
| Closed By | The user who closed the incident is displayed. |
| Escalation Count | The escalated incident count is displayed. |
Click the [Download CSV] button to download the incident data.
Display items in CSV file
① Incident No.: Incident number
② Incident/Service/Escalation Policy Name: Names of incident, service, and escalation
③ Created: The date and time of incidents created
④ Closed: The date and time of incidents closed (It will be displayed as “-” if it is not closed)
⑤ Time to Acknowledge/Close: The time to acknowledge and close incidents (Displayed in seconds)
⑥ Acknowledged/Closed by: The user who acknowledged/closed incidents
⑦ Auto Closed: Whether the incident has been automatically closed (in Y/N)
⑧ Escalation Count: The number of incidents escalated
⑨ Assignment Count: The number of incidents assigned
⑩ Assignee: The one who is in charge of handling incidents
⑪ Urgency: Incident urgency
Notification Report
Notification Report provides visualized data and graphs about notifications that are sent to users for a specified period. It also allows you to check detailed information like total number of notifications and number of notifications that are sent by notification types. Users can view detailed data by looking at the number of notifications that are sent based on a date or type over a specified period.
Notification Report Configuration
For Notification Report, you can check the total number of notifications and notification types that are sent. In addition, the data about notification reports will be displayed by its type and date.
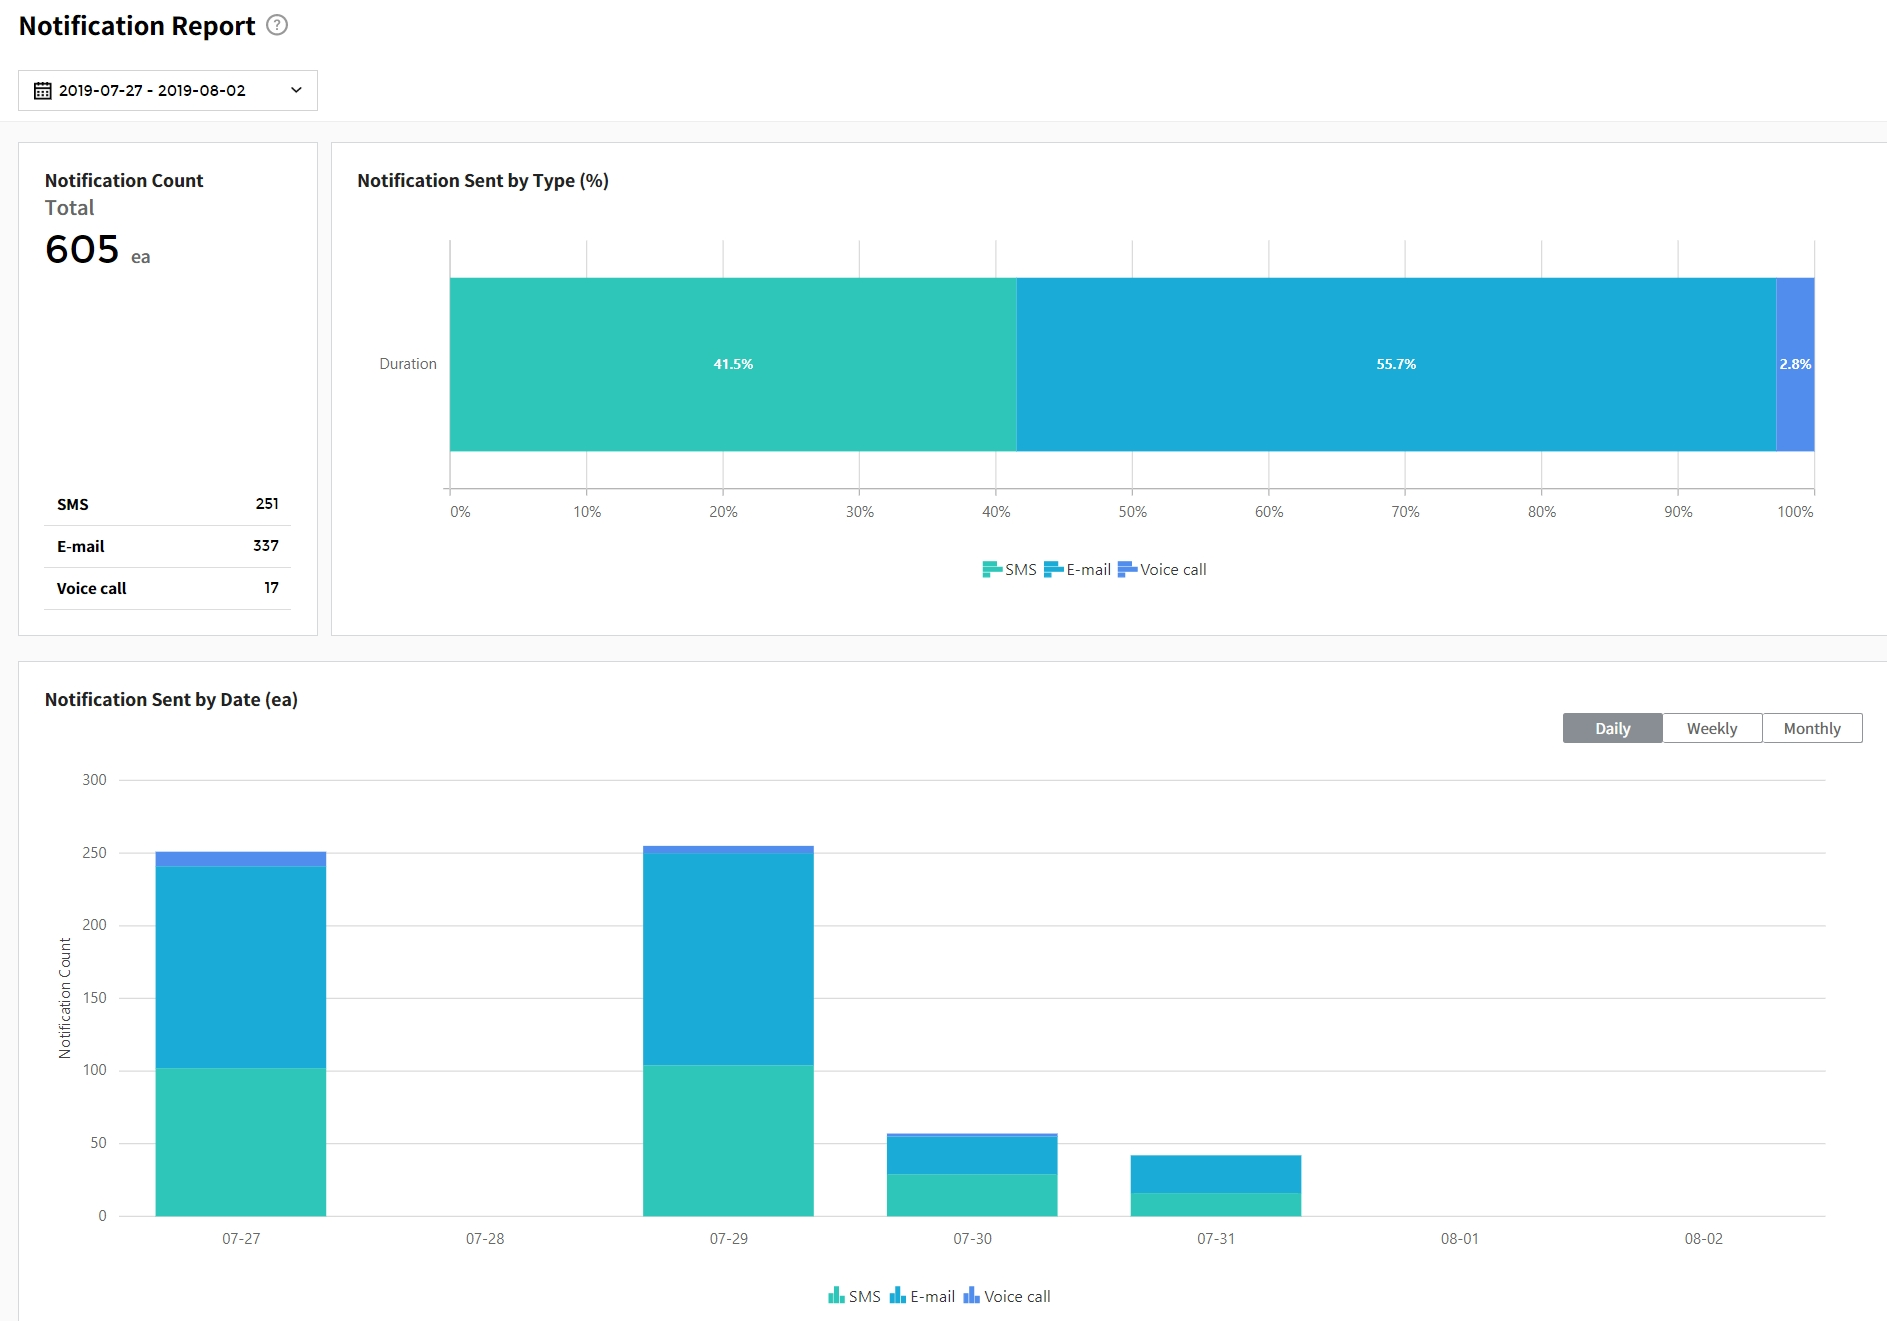
Graph
① Select Period: Select the period to view report. You can select one from Recent 1 Week, Recent 1 Month, Recent 3 Months, or Custom options.
② Notification Sent by Type: This bar chart shows the notification sent by type for the selected period. The x-axis represents the percentage of notifications sent and the y-axis represents the duration.
③ Notification Sent by Date: This bar chart shows the number of notifications sent by date for the selected period. The x-axis represents the date and y-axis represents the notification count. It also displays notification types with different colors for SMS, voice call, and email. You can set the x-axis on a daily, weekly, and monthly basis. Duration of the following table varies based on the option selected. Daily option becomes inactive when the duration is set to 35 days or more.
Table
① Duration: Displays the duration depending on selected options from daily, weekly or monthly.
② Total: Displays the total notification count for the selected period.
③ Notification Type (SMS, Voice call, Email): Displays number of notifications sent by its type for a selected period.
④ View Notification: Click the [View] button, it goes to the notification details page.
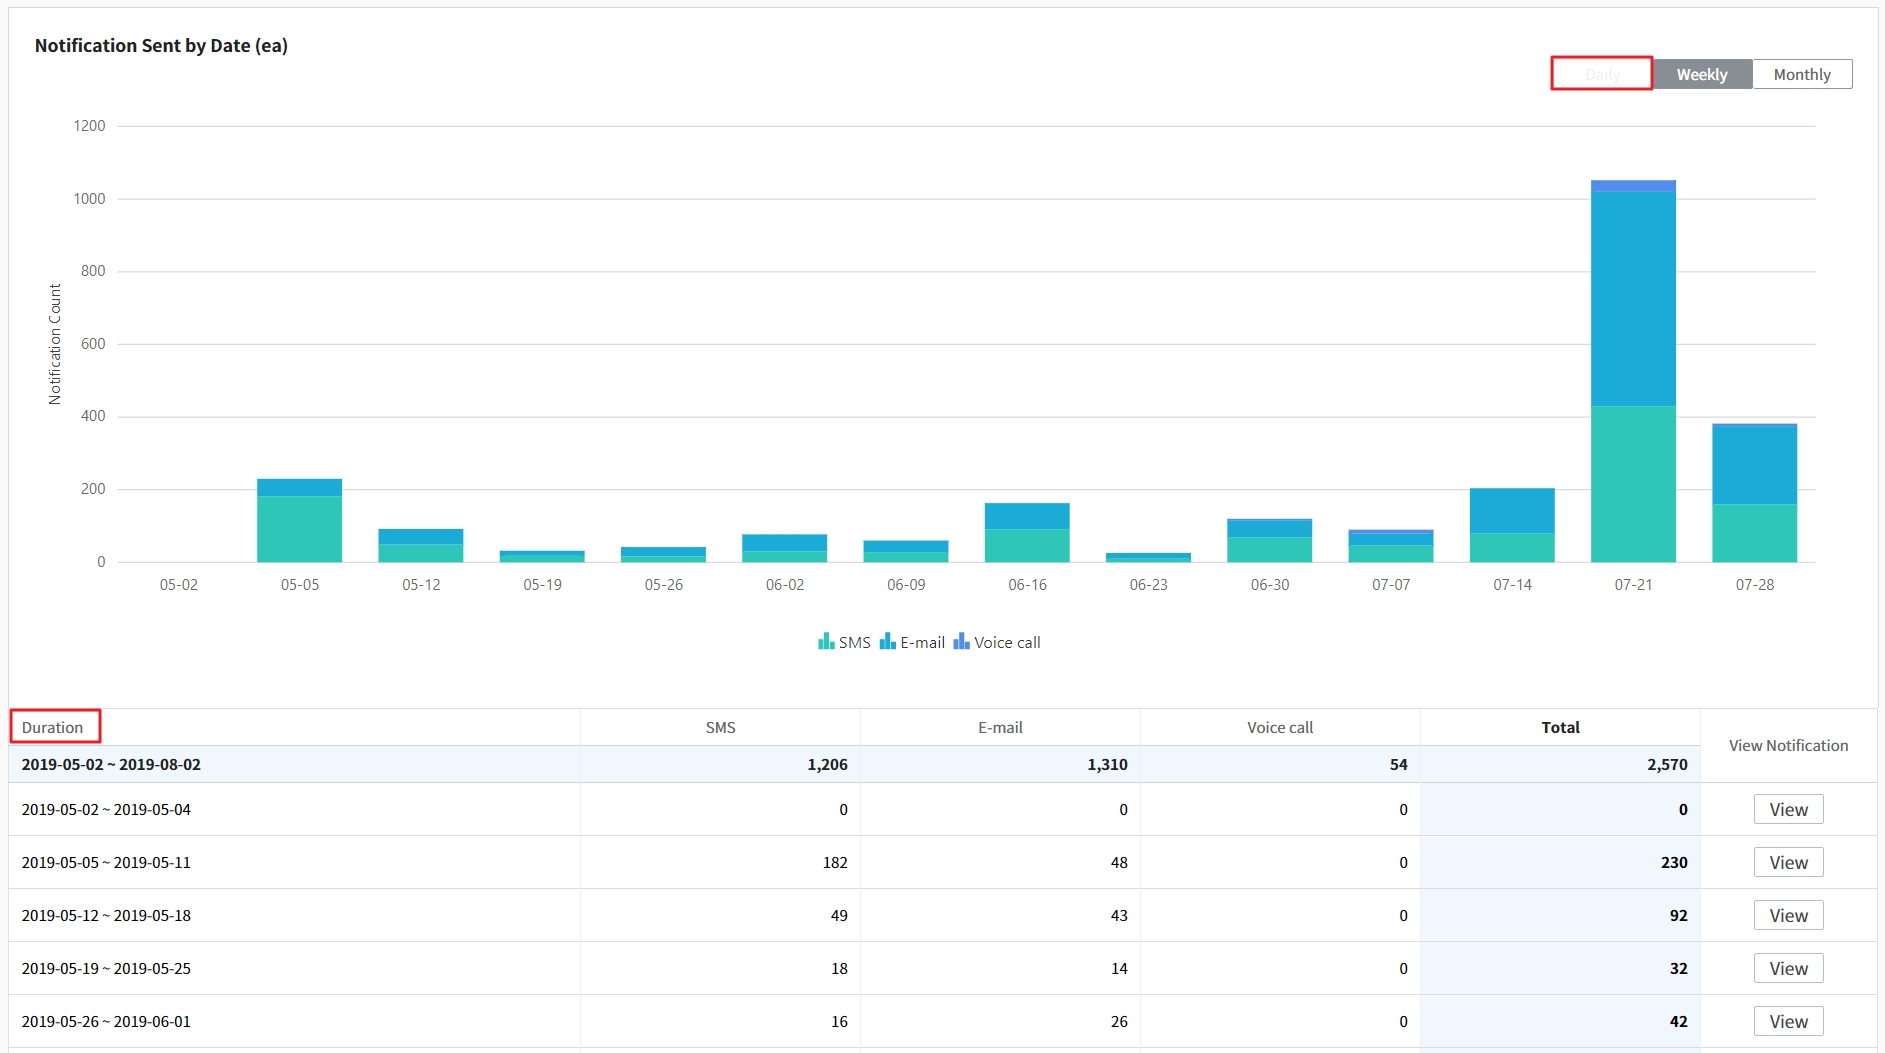
View Notification
In the notification details page, you can check a list of notifications for the selected period, and download the data in a CSV file. To go to notification details page, click the [View] button in a report table.
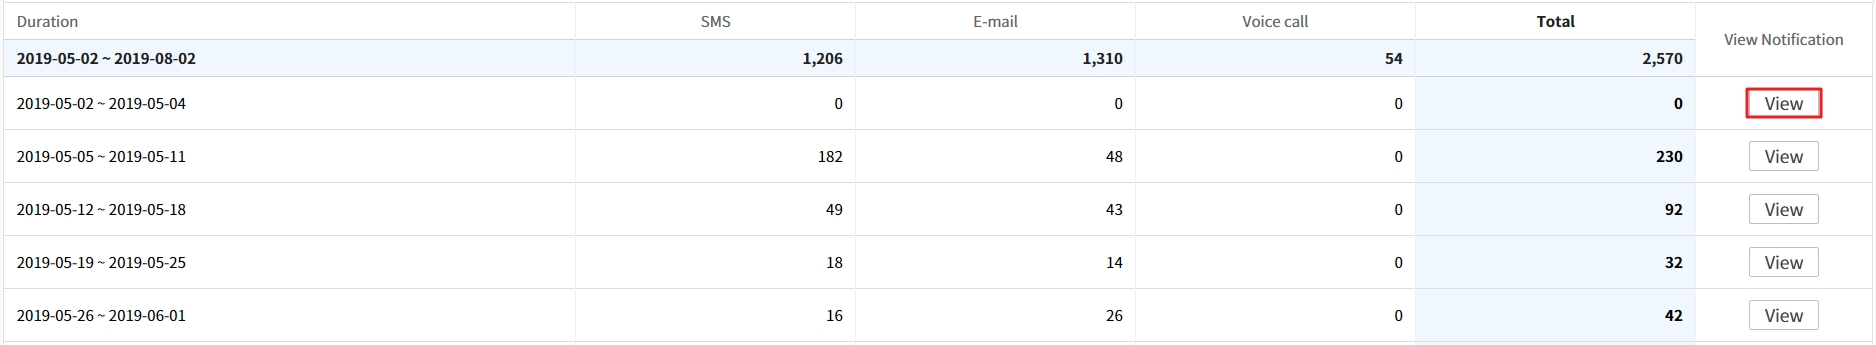
It consists of the following items:
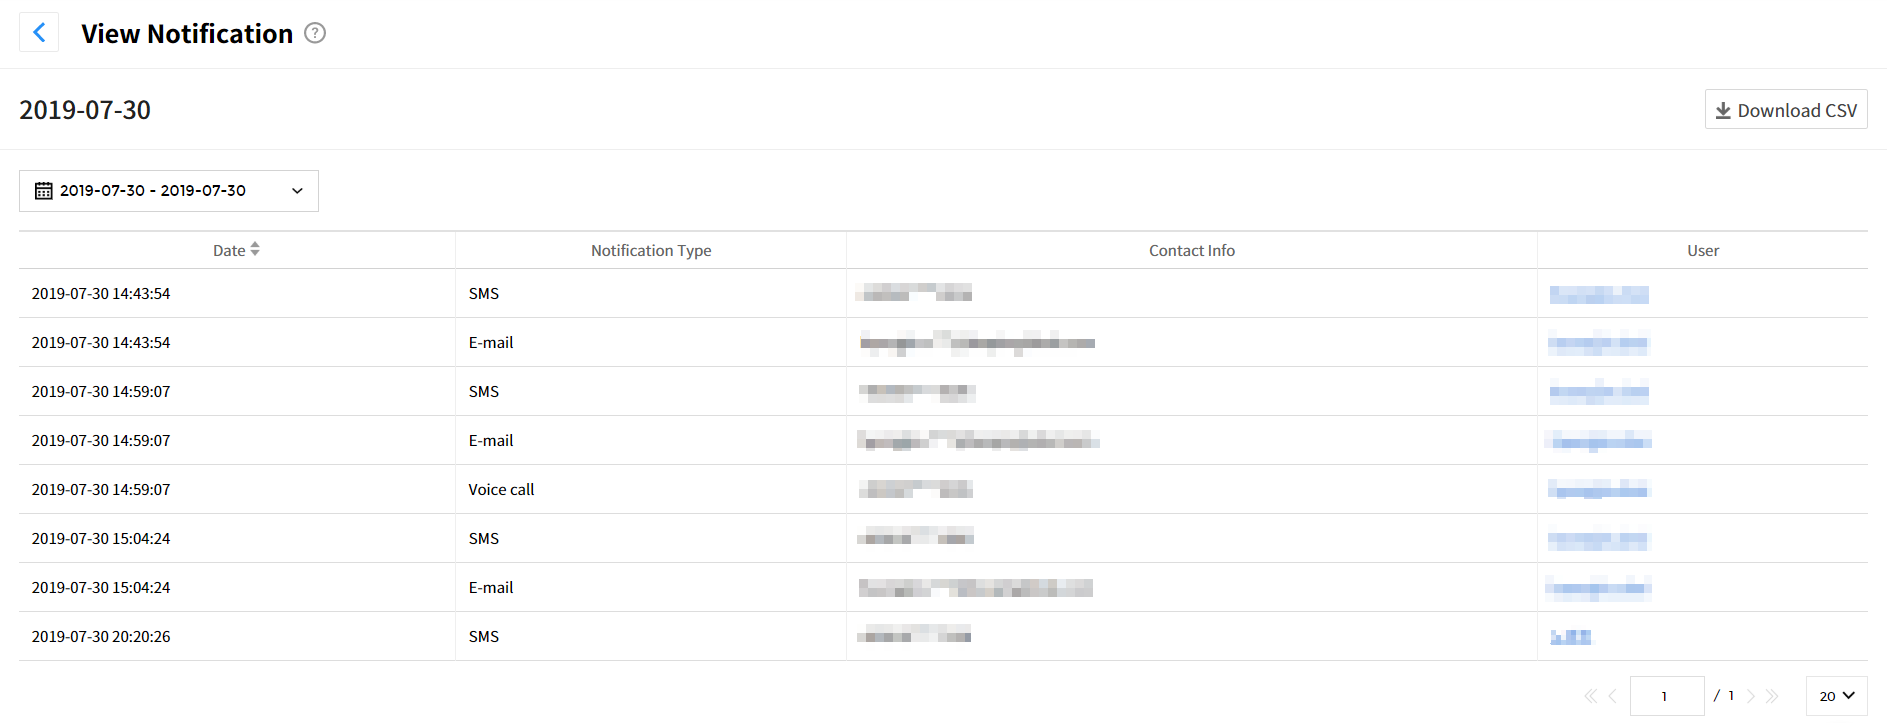
| Item | Description |
|---|---|
| Date | The date of notification sent is displayed. |
| Notification Type | The type of notification sent is displayed. |
| Contact Info | The contact information of the notification sent is displayed. |
| User | The name of users who received the notification is displayed. |
Click the [Download CSV] button to download the incident data.
Display items in CSV file
① Date: The date of notification sent
② Notification Type: The type of notification sent
③ Contact Info: The contact information of notification sent
④ User: The user name of notification received
Personal Settings
Set up contact information, notification rules, roles & permissions, and user settings.
Personal Information
① You can set contact information for receiving incident notifications, and up to 5 contacts can be added. However, the free version offers 3 contacts only.
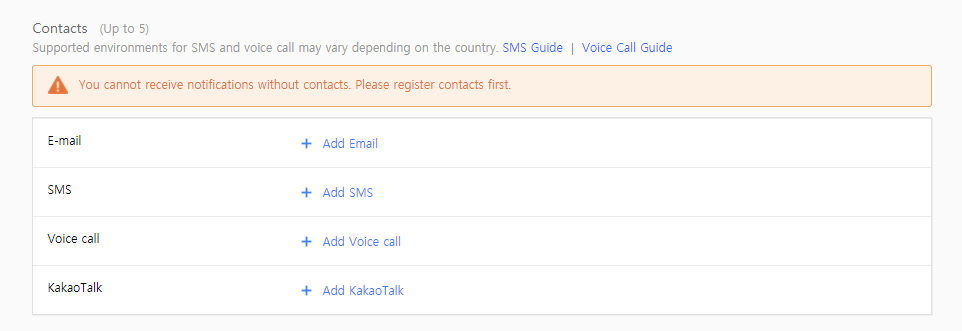
② Click the [Add] icons to add your email address, SMS, Voice call, KakaoTalk, WeChat and Telegram. Add each item in the Contacts in order to set notifications in the Default Notification.
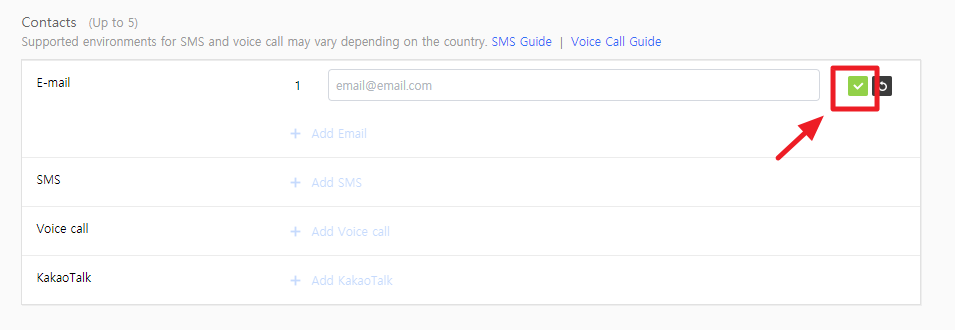
Notification Settings
Configure incident notification settings to receive notifications via SMS, Email, Voice Call, KakaoTalk, Telegram, and WeChat.
Email notifications
① Choose the [Email] from the dropdown menu, and select checkboxes for receiving notifications and click the [Save] button.
② When an incident is created, you will receive notifications via email.
③ For email, must change incident status to Acknowledge or Close and its assignee manually in the incident page to receive notifications.
SMS notifications
💡 Calling numbers may vary depending on national restrictions.
① Choose the [SMS] from the dropdown menu, and select checkboxes for receiving notifications and click the [Save] button.
② Select the [Escalation] checkbox to receive SMS notifications when an incident is created.
- Reply to SMS by Item
| No. | Item | 2-way | 1-way |
|---|---|---|---|
| 1 | Incident Number | O | O |
| 2 | Service Name | O | O |
| 3 | Incident Name | O | O |
| 4 | The number to change incident status to ‘Acknowledged’ (ends with 1) | O | X |
| 5 | The number to change incident status to ‘Closed’ (ends with 3) | O | X |
③ Select the [Assign] checkbox to be assigned as the manager and receive notifications as below.
④ Press the number to change incident status to Acknowledged, you will receive SMS notifications as below.
⑤ Press the number to change incident status to Closed, you will receive SMS notifications as below.
⑥ The policy to send and receive SMS texts per country is as follows.
| Country | SMS |
|---|---|
| Korea | 2-way |
| China | 2-way |
| USA | 2-way |
| Canada | 2-way |
| Poland | 1-way |
| Philippines | 1-way |
| India | 1-way |
| Vietnam | 1-way |
| German | 2-way |
| Saudi Arabia | 1-way |
| United Arab Emirates | 2-way |
| Singapore | 2-way |
| Brazil | 2-way |
- One-Way: You can only receive incident notifications via SMS.
- Two-Way: You can receive incident notifications and reply to the notification to change the incident status.
📑 Note: There are some countries where responders may be unable to reply to notifications due to supported environments and several factors. You may experience problems when you reply to the notification message depending on your carrier.
Voice Call notifications
💡 Depending on the situation of telecommunication carriers in the country or region, the calling numbers may change, lower reception rates, or the reception status indicators may be different.
① Choose the [Voice Call] from the dropdown list, and select checkboxes for receiving notifications and click the [Save] button.
② You will receive voice calls in the following cases.
• Incident created or escalated
• Assigning or chaning assignee
③ The contents of voice call messages are as follows. Currently Korean and English versions of voice calls are supported.
| Item | Language | Voice message |
|---|---|---|
| If an incident occurs (2-way) | English | This is an AlertNow notification. You have an incident on {service name} service. The incident number is {incident number}. To acknowledge incidents, please press {Number}. To close incidents, please press {Number}. To repeat the message, please press {*}. |
| If an incident occurs (2-way) | Korean | 얼럿나우 알림입니다. {service name} 서비스에 인시던트가 생성되었습니다. 인시던트 번호는 {incident number}입니다. 인시던트를 확인하시려면 숫자 일번을, 종료 하시려면 숫자 이번을 누르세요. 메시지를 반복하려면 별표를 누르세요. |
| If an incident occurs | English | This is an AlertNow notification. You have an incident on {service name} service. The incident number is {incident number}. |
| If an incident occurs | Korean | 얼럿나우 알림입니다. {service name}에 인시던트가 생성되었습니다. 인시던트 번호는 {incident number}입니다. |
💡 The number of sending and receiving voice calls may differ depending on your carrier.
④ The policy to receive Voice Calls per country is as follows.
| Country | Voice Call |
|---|---|
| Korea | 2-way |
| USA | 2-way |
| Canada | 2-way |
| Poland | 2-way |
| Philippines | 1-way |
| India | 1-way |
| Vietnam | 1-way |
| German | 2-way |
| Saudi Arabia | 1-way |
| United Arab Emirates | 1-way |
| Singapore | 1-way |
| Brazil | 1-way |
| Mexico | 1-way |
| Colombia | 1-way |
- One-Way: You can only receive incident notifications via Voice Call.
- Two-Way: You can receive incident notifications and change the incident status during the call.
📑 Note: There are some countries where users may be unable to respond to these voice call notifications, due to supported environments and other factors.
KakaoTalk Notifications
① Click + Add Notification Method under Set Notification Methods and select KakaoTalk from the dropdown list.
② Activate or deactivate notification statuses (Escalation, Assign, Ack, Close) and click ![]() .
.
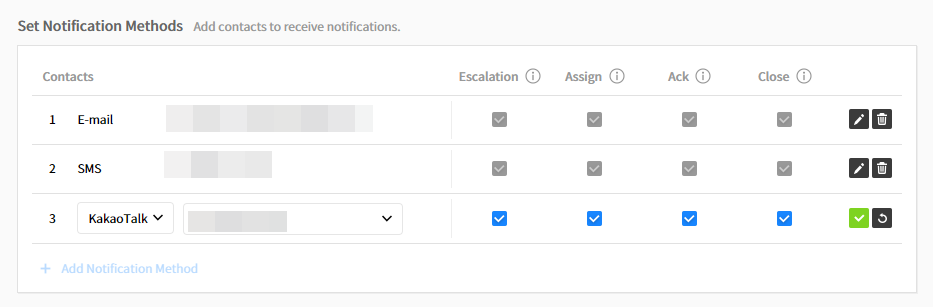
💡 Tips
Select the Escalation checkbox to receive SMS notifications when an incident is created.
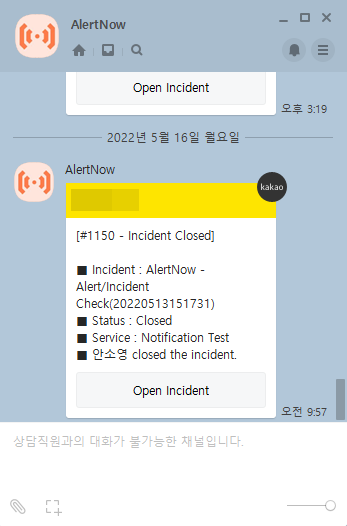
- Change incident status directly from KakaoTalk notification
Tab Open Incident at the bottom of KakaoTalk incident notification message.
![]()
Tab Acknowledged or Closed at the bottom of the incident page to change the status.
![]()
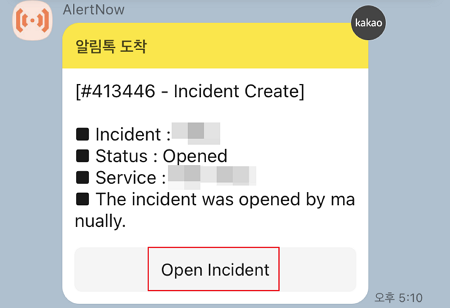
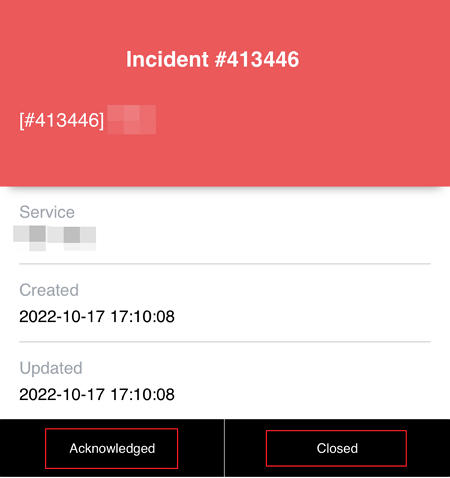
Telegram Notifications
① Run Telegram on your PC or mobile phone and enter @BotFather in the search tab.
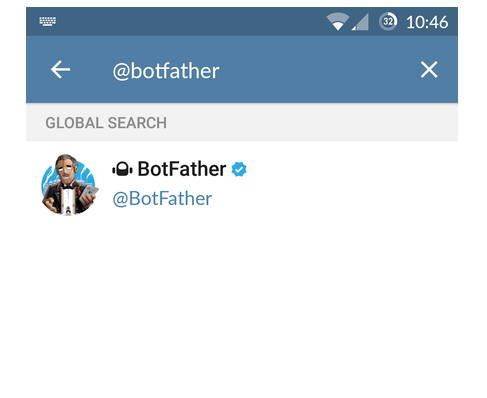
② In the BotFather channel, enter /help to see a list of commands to manage bots.
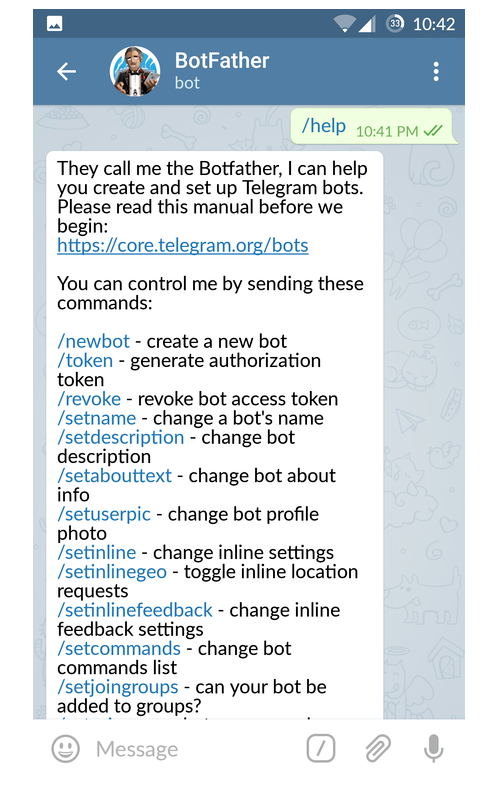
③ Enter /newbot in the chatroom to create a new bot. Choose a name and a username for your bot.
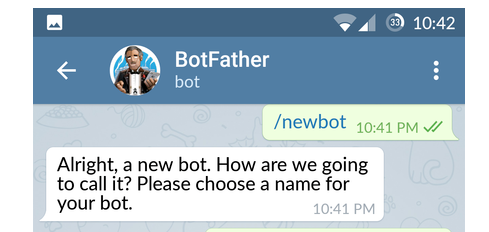
④ Copy the bot token created.
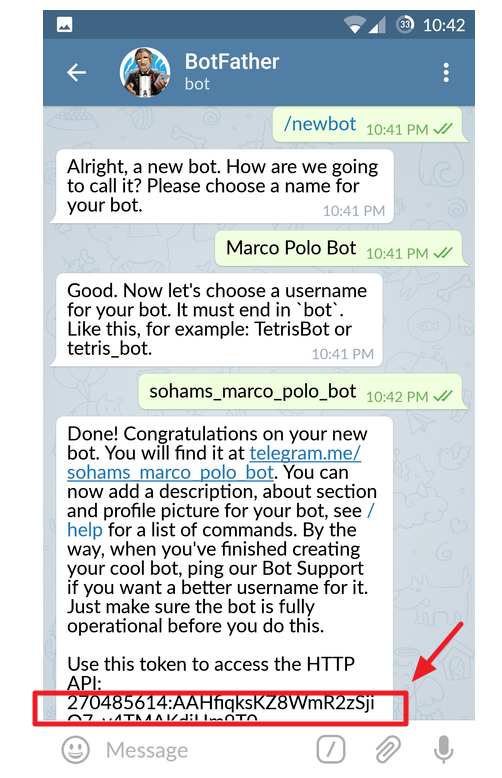
⑤ To connect the bot with AlertNow, go to the bot channel and enter alertnow in the chatroom.
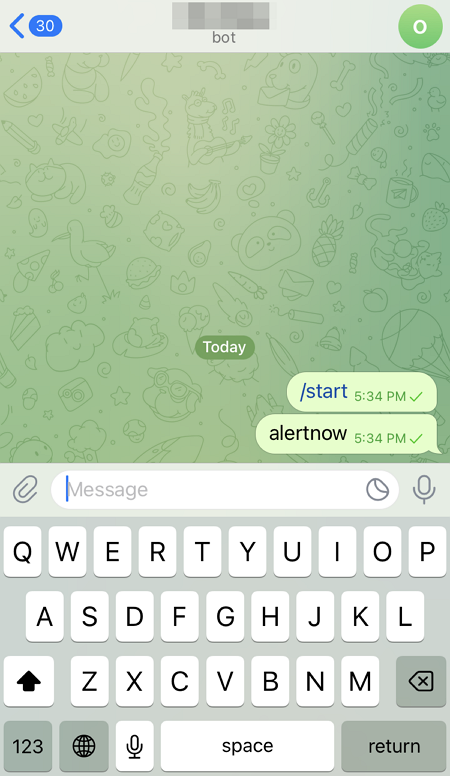
⑥ On AlertNow > Personal Settings > Contacts > Telegram, click [Add Bot Token] and enter the token.
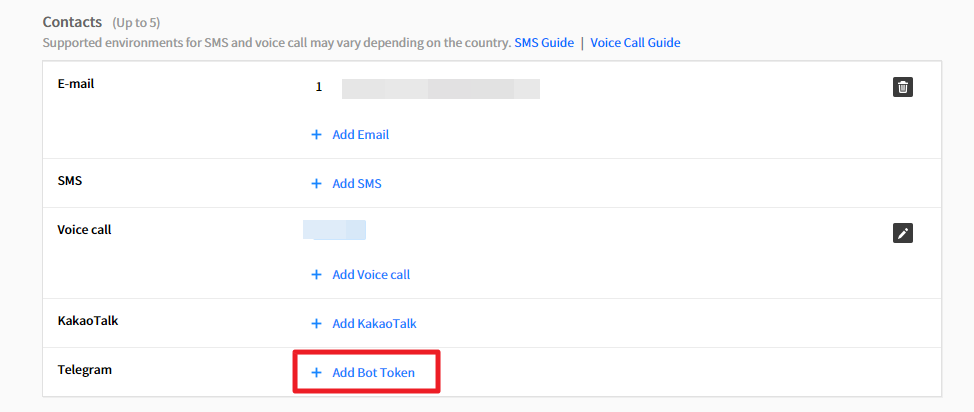
⚠️ Attention
You may see an error message if the connection is not established sucessfully. In this case, repeat the step ⑤ above and enter the bot token again.
⑦ Scroll down to Set Notifications Methods, select Telegram, activate or deactivate notification statuses (Escalation, Assign, Ack, Close) and click ![]() .
.
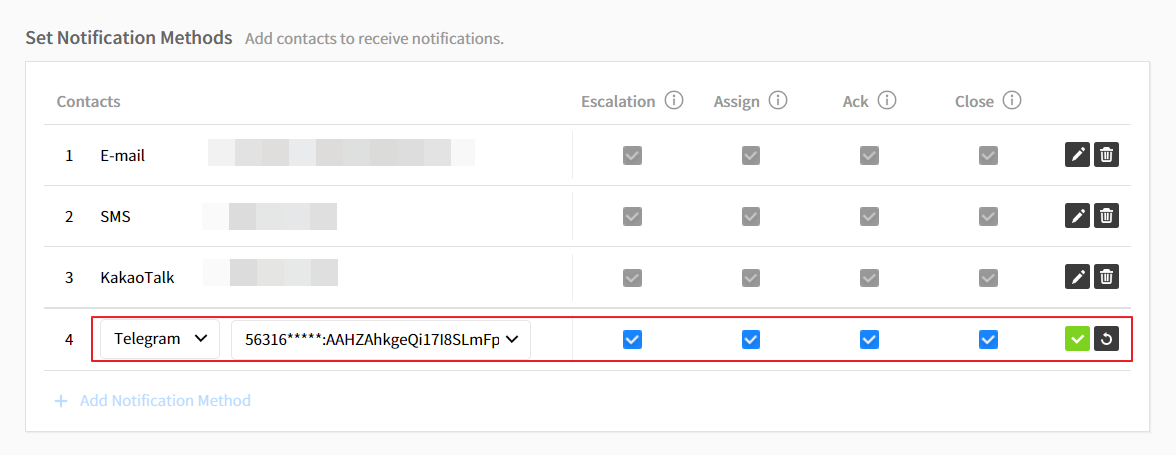
- Change incident status directly from Telegram notification
Tab Open Incident at the bottom of KakaoTalk incident notification message.
![]()
Tab Acknowledged or Closed at the bottom of the incident page to change the status.
![]()
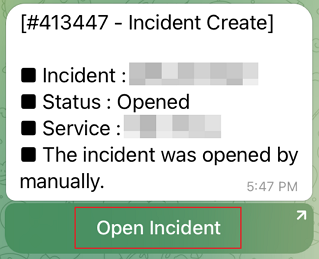
WeChat notifications
💡 Depending on your country or region, this feature may not be available.
① Choose the [WeChat], and select checkboxes to receive notifications and click the check button.
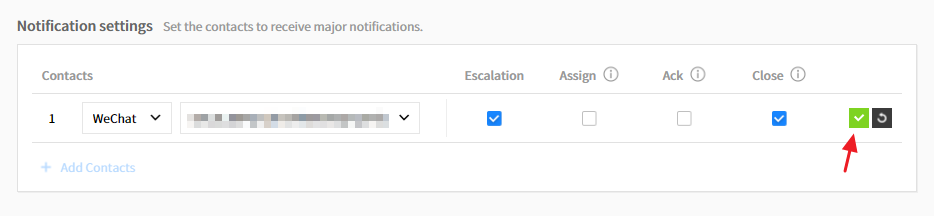
② Like SMS, you will receive a message displayed below when an incident is created for escalations configured in Additional Information.
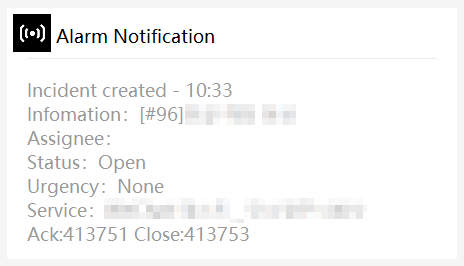
③ If notification is escalated, you will receive a message as below.
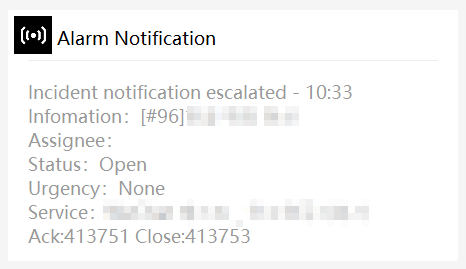
④ If no one acknowledges notifications for any of the escalation steps, you will receive an escalation reminder message as below.
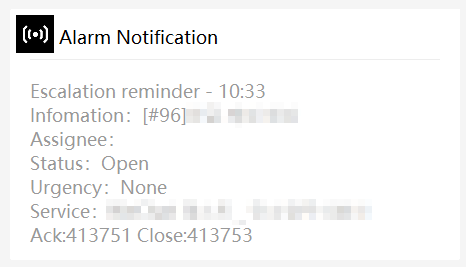
⑤ If incident status is changed to either Acknowledge or Close, you will receive a status change message as below.
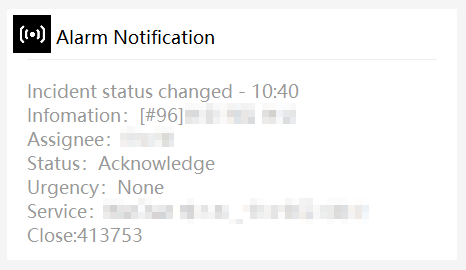
⑥ If an incident assignee is changed, you will receive assignee change as below, and changed assignee will be displayed in “Assignee”.
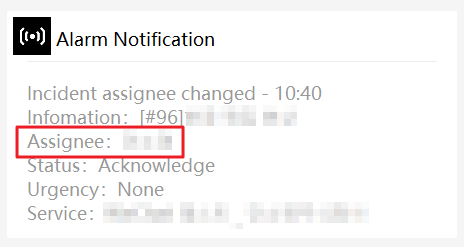
Notification Rules
Users can configure notification rules to receive notifications based on user-defined rules.
① Click the [+ Add Notification Rule] button.
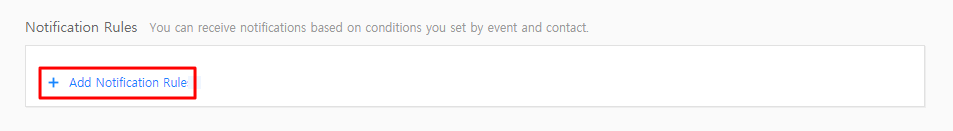
② Enter a notification rule name, and choose Escalation, Assign, and Acknowledge or Close as Apply to and select a notification channel. To add more events, click [+ Add].
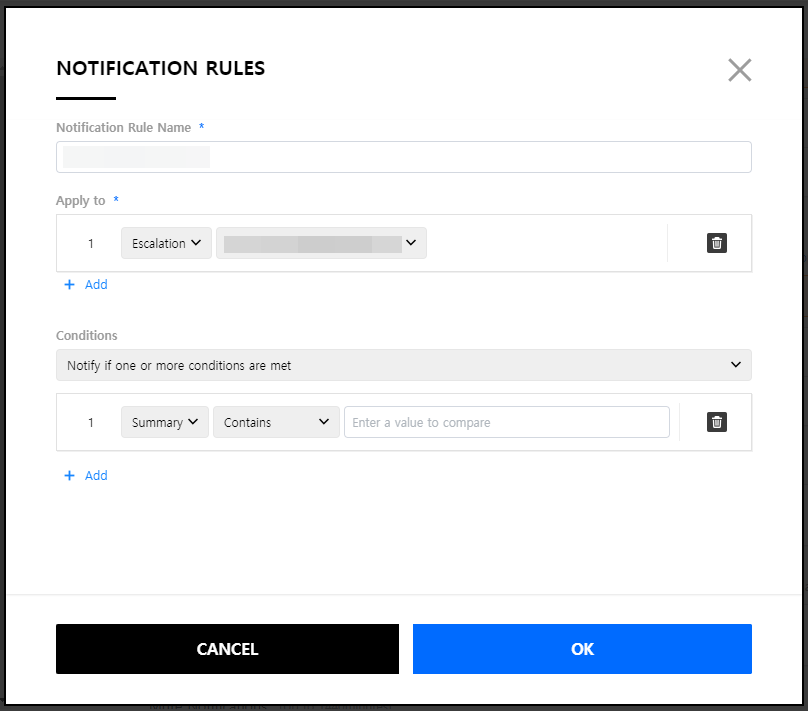
③ Configure conditions to apply. To add more events, click [+ Add] and then [OK] to add the rule.
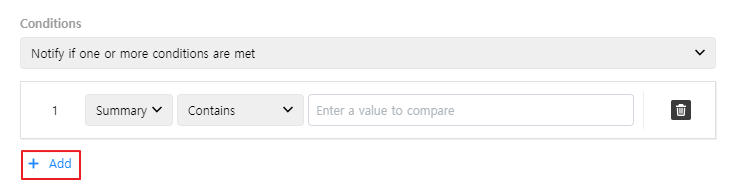
| Item | Description |
|---|---|
| Apply to | Choose notification channels as follows. • Escalation • Assign • Ack • Close |
| Conditions | Choose notification conditions as follows. • Notify if one or more conditions are met • Notify if all conditions are met |
| Conditions details - 1 | Choose Summary and enter text or numbers to be included in the incident’s name. For example, when you choose the Summary and Contains as an operator, and enter ‘Test’, you will receive notifications about incident’s name with Test. Available Operators: Equal, Not Equal, Greater Than, Greater or Equal, Less Than, Less or Equal, Contains, Not Contains, Starts with, Not Starts with, Ends with, Not Ends with |
| Conditions details - 2 | Choose Urgency for the level of incidents and set it as Highest, High, Medium, Low or Lowest. |
Notification Restrictions
Restriction to Time Intervals
Users can specify the time of the day or the duration of the week in order not to receive notifications. During the specified hours or the specified day, Alertnow will not send notifications to the user.
① Click the [+ Add Restriction to Time Intervals] button.
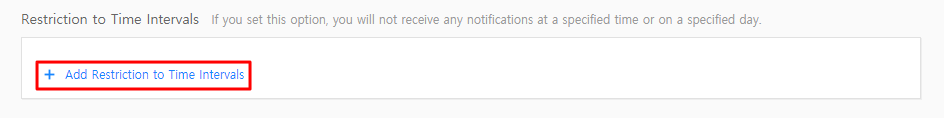
② Select one from Daily or Weekly option. Specify hours of the day or the duration of the week and click the [Add] button. If you choose Daily and set the time to 09:00~12:00, you will not receive any notifications during the specified hours everyday. For Weekly, if you set a date to Monday and time to 09:00~12:00, you will not receive any notifications during those hours every Monday.
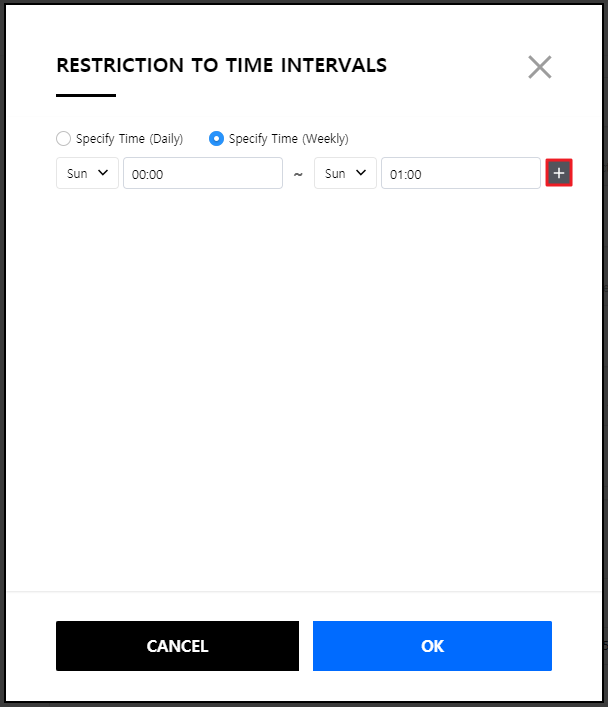
③ Click the [OK] button to add a restriction to time intervals.
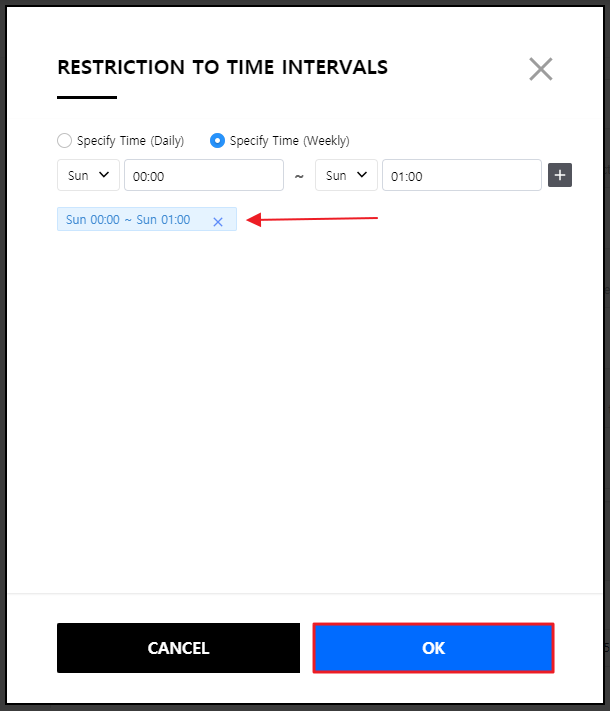
Mute Notifications
Users can mute notifications for a specified time. If you enable this option, you will not receive any notifications during the specified time.
① 0 is set as a default setting. Click the [Modify] button to add a desired time period for mute, but note that the time can be added at a maximum of 1440 minutes.
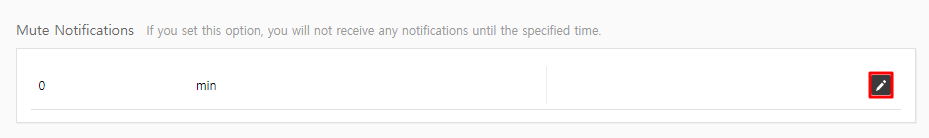
② Click the [Save] button to complete the setting.
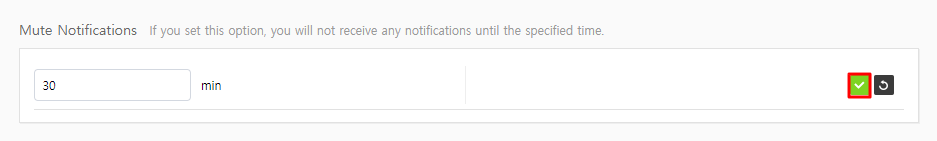
③ You can change the specified time using the [Modify] button or delete it by clicking the [Delete] button.
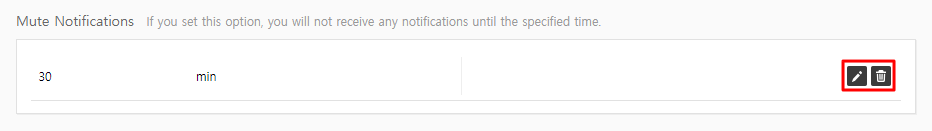
Notification Forwarding Rules
When users may not be able to receive notifications, AlertNow allows you to create a notification forwarding rule to forward your notifications to another user for a specified time frame. You can add up to 5 notification forwarding rules.
① Click [+ Add Notification Forwarding Rule].
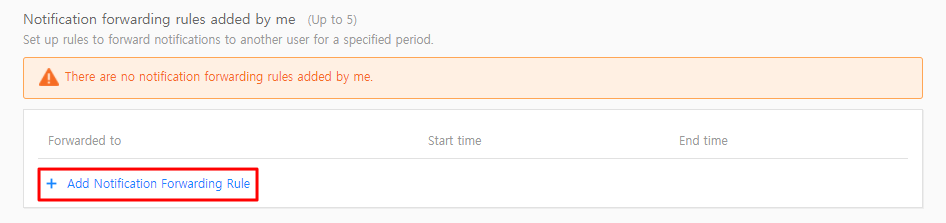
② Select a responder to forward notifications, and specify the start time and end time.
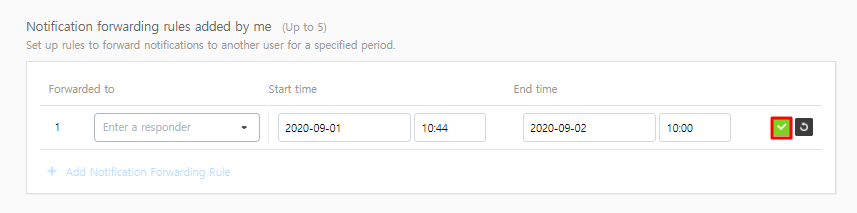
③ Click the [Save] button to add a notification forwarding rule.
Notification forwarding rules added by me
If you cannot receive notifications, you can assign other users to receive notifications for you for a specified time period. Click [Notification Forwarding Rule] to specify a responder and start & end times to create a rule.
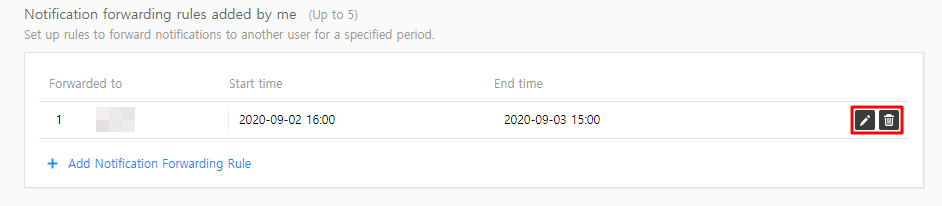
Notification forwarding rules added to me
Others can assign you to receive notifications for them by adding the [Notification Forwarding Rule]. When someone adds you to a Notification forwarding rule, you can check notifications you will receive and who will assign you for these notifications as well.
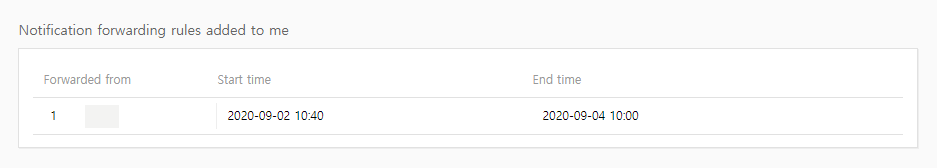
Mobile Notification Settings
Mobile notification can be set both on the web and the app. You can set up notifications to receive incident notifications in mobile apps in one of two ways:
On the Web
① Click the [+ Add Notifications] button in the Default Notifications of Personal Settings.
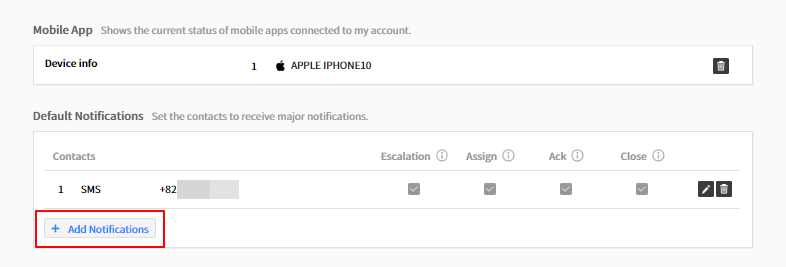
② Select Mobile App from the dropdown menu, and select checkboxes for receiving notifications and click the [Save] button.
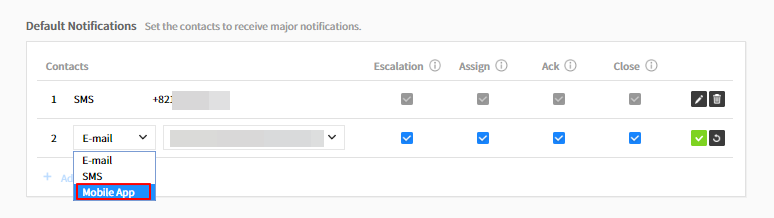
③ When you select [Escalation] checkbox, you will receive notifications on your mobile app when an incident is created.
④ When you select the [Assign] checkbox, you will receive notifications on your mobile app when you are added as a responder for an incident.
If you having problems receiving notifications after changing your mobile device, turn off and on Push Notifications again in your device’s Personal Settings.
On the App
To receive notifications, turn on push notification on your mobile app.
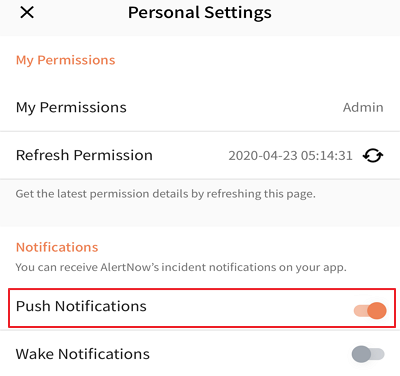
- Mobile App Status
① You can view the current status of mobile apps connected to your account.
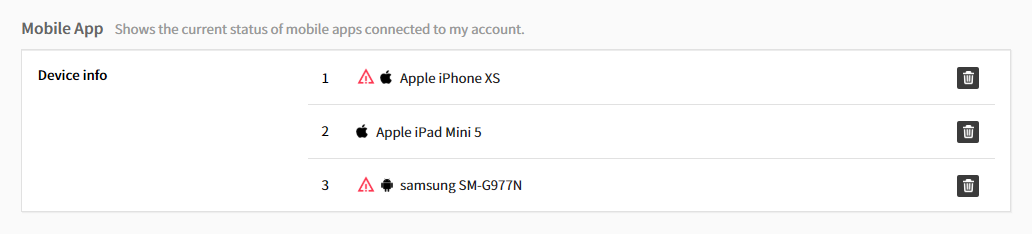
② Divide can be deleted, however if you delete a device, you cannot receive notifications on your app and your device will be deactivated.
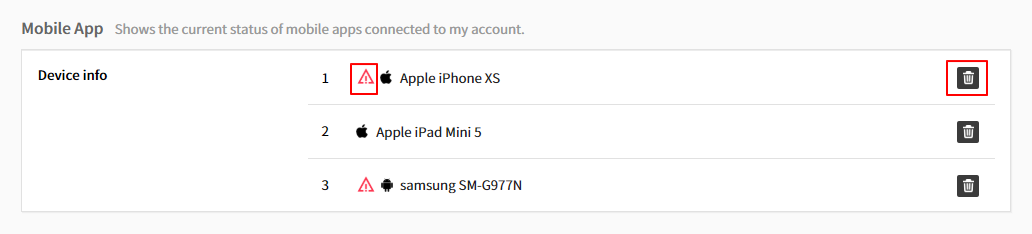
Additional Information
① The additional information items are as follows.
| Item | Description |
|---|---|
| Time Zone | Users can change the time zone to a desired one. By default, the time zone is set to the browser time. |
| Language | Users can set a language preference. Supported languages are Korean, English, Chinese, and Japanese. |
| Default Permission | Information about AlertNow roles that the user belongs to: Admin, Manager, Responder, and Observer |
| Teams | Display a list of teams that the user belongs to or created. |
| Escalations | Display a list of escalations that the user belongs to or created. |
| Schedules | Display a list of schedules that the user belongs to or created. |
Mobile App
AlertNow mobile app is available on the Apple App Store and Google Play. You can receive notifications on your mobile app, and acknowledge or close incidents as well. Also, you can assign or change a responder.
📌 Important: Mobile App is only available in certain regions. Depending on where you are located, you may not be able to use it. The app is currently available in Korea and China and will be available in Southeast Asia Middle East and Africa regions in 4Q 2022.
Getting Started
① When you open the AlertNow app for the first time, you will be prompted to enter your email address to login.
② Enter your email and select service territory, and then tap the [Next] button.
③ Select a domain to login and tap the [OK] button.
④ Enter your password to login.
If you enabled the Multi Factor Authentication (MFA) feature in Additional Security Settings of My Account, you need to enter MFA authentication numbers to login.
⑤ After login, you can see incidents. The All tab shows all open and acknowledged incidents in the account. The Open tab shows open incidents only, and you can filter incidents by My Team. You can also see incidents that are assigned to your teams.
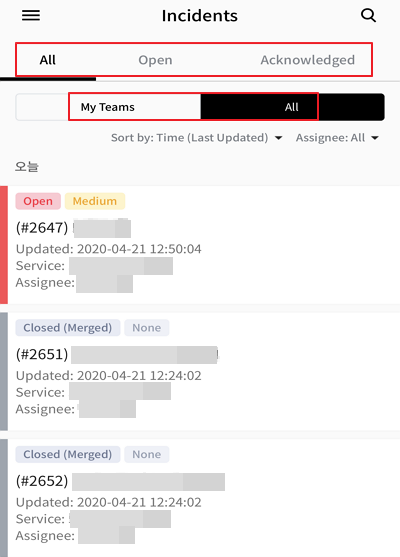
Acknowledging Incidents
① Open incidents will be under the Open Incidents tab.
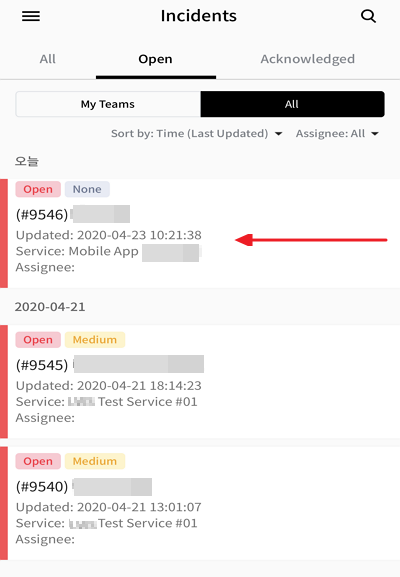
② You can acknowledge an incident by tapping the incident and tapping the [Acknowledge] button on the incident details page.
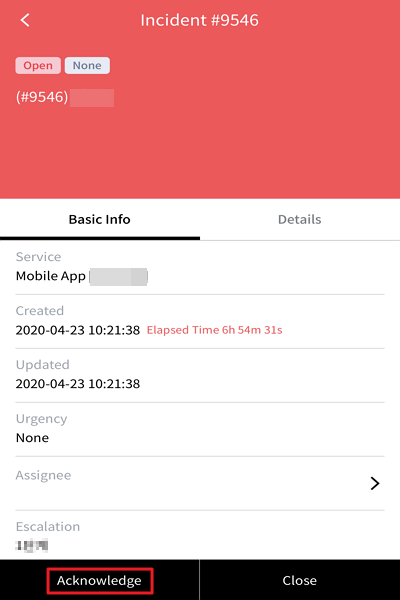
Closing Incidents
① To close an open or acknowledged incident, tap the incident.
② Tap the [Close] button on the incident details page.
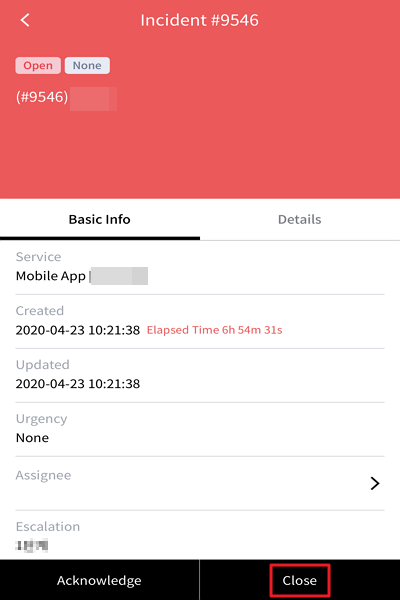
Adding and Changing Assignee
You can add or change incident assignees.
Add Assignee
① Go to the incident you want to assign and tap the >.
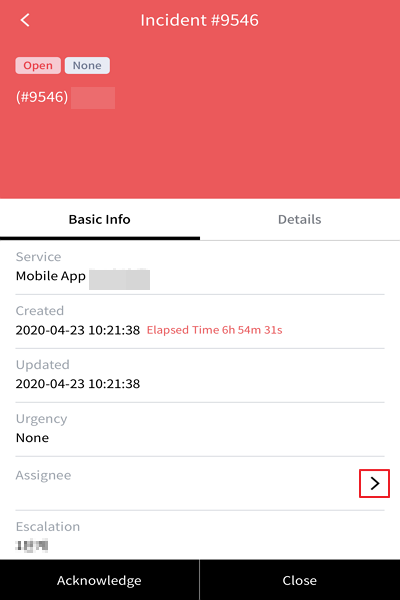
② Search for an assignee. Tap the name of the person you want to assign.
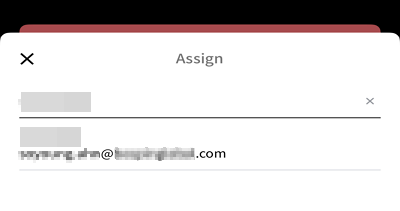
Change Assignee
① Go to the incident you want to reassign and tap >.
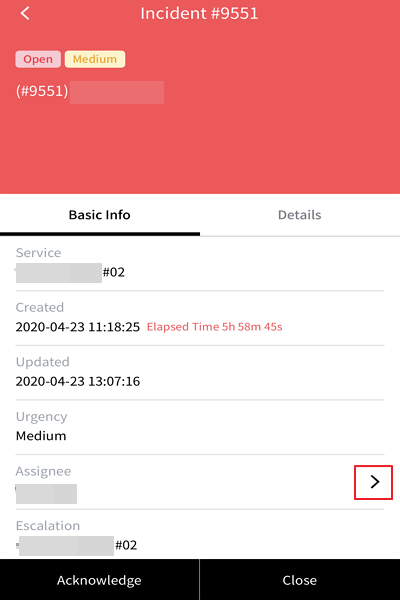
② Search for an assignee. Tap the name of the person you want to reassign.
Notification settings
① Push Notifications
To receive incident notifications from AlertNow on your app, turn on push notifications in Personal Settings > Notifications.
② Wake Notifications
To receive incident notifications from AlertNow, turn on wake notifications in Personal Settings > Notifications. Just like Voice Call, the system will call you on your cell phone to notify you whenever alarms are triggered. When you press the call button, the system thinks that you received the notification, and the call is ended.